Semiparametric Sieve Maximum Likelihood Estimation Under Cure Model with Partly Interval Censored and Left Truncated Data for Application to Spontaneous Abortion Data
Yuan Wu1, Christina D. Chambers2,3 and Ronghui Xu3,4 1Department of Biostatistics and Bioinformatics, Duke University, Durham, North Carolina.
2Department of Pediatrics, 3Department of Family Medicine and Public Health,
4Department of Mathematics,
University of California, San Diego.
Abstract
This work was motivated by observational studies in pregnancy with spontaneous abortion (SAB) as outcome. Clearly some women experience the SAB event but the rest do not. In addition, the data are left truncated due to the way pregnant women are recruited into these studies. For those women who do experience SAB, their exact event times are sometimes unknown. Finally, a small percentage of the women are lost to follow-up during their pregnancy. All these give rise to data that are left truncated, partly interval and right-censored, and with a clearly defined cured portion. We consider the non-mixture Cox regression cure rate model and adopt the semiparametric spline-based sieve maximum likelihood approach to analyze such data. Using modern empirical process theory
we show that both the parametric and the nonparametric parts of the sieve estimator are consistent, and we establish the asymptotic normality for both parts. Simulation studies are conducted to establish the finite sample performance. Finally, we apply our method to a database of observational studies on spontaneous abortion.
Our work was motivated by research work carried out at
the Organization of Teratology Information Specialists (OTIS), which is a North American network of university or hospital based teratology services that counsel between 70,000 and 100,000 pregnant women every year.
Research subjects are enrolled from the Teratology Information Services and through other methods of recruitment, where the mothers and their babies are followed over time.
Recently it has been of interest to assess the effects of medication and vaccine exposures on spontaneous abortion (SAB).
By definition SAB occurs before 20 completed weeks of gestation; any pregnancy loss after that is called still birth. Ultimately we would like to know if an exposure modifies the risk of SAB for a woman, which may be increased or decreased.
It is known that in the population
for clinically recognized pregnancies the rate of SAB is about 12%.
On the other hand, in our database the empirical SAB rate is consistently lower than 10%.
This is due to the fact that women may enter a study any time before 20 weeks’ gestation.
The fact that we do not observe the women from the start of their pregnancy is known as left truncation in survival analysis; it reflects the selection bias in that women who have early SAB events can be seen as less likely to be in our studies.
In addition, a substantial portion of the SAB events do not have an exact known date, rather a window during which it occurred is typically available. This is known as interval censoring in survival analysis.
Finally, the fact that the majority of the pregnant women are free of SAB is considered “cured” in the time-to-event context.
Like in other clinical studies
our data also have right-censoring due to loss to follow-up before 20 weeks of gestation.
The typical survival analysis models assume that all subjects in the study population will eventually experience the event of interest,
at least if they are not lost to follow-up. When this is not the case,
in the literature researchers have proposed mixture and non-mixture cure models to deal with the situation. Mixture cure models have parts for the cure rate and the hazard function of the uncured subjects separately. The most popular semiparametric mixture cure rate model adopts logistic regression for the cure rate and Cox regression for the hazard rate. For example, Sy and Taylor (2000) proposed the estimation under this model for right-censored data, Ma (2010) proposed the estimation under the same model for interval censored data, and Lam and Xue (2005) and Hu and Xiang (2016) adopted the sieve approach to ease computation for interval censored data. Mixture cure models might have easy interpretation for practitioners,
but are computationally complex. On the other hand,
the non-mixture cure model is easier to compute, and
has become popular for analyzing population with a well defined cured portion. For right-censored data, Chen et al. (1999) proposed a semiparametric method for a non-mixture cure model based on the Cox regression, and Zeng et al. (2006) further extended the Cox regression to general transformation models. For interval censored data, Liu and Shen (2009) proposed a semiparametric method under the non-mixture cure model and established consistency of their estimator, Hu and Xiang (2013) adopted the sieve approach for the nonparametric part and besides consistency they also established the asymptotic normality for the parametric part of the model.
In practical data analysis using cure models, a predetermined follow-up time window is often used to identify the observed cured subjects, see for example, Sy and Taylor (2000) and Zeng et al. (2006). The end point of the follow-up window is called cure threshold by Zeng et al. (2006), and it is assumed that most or all events will occur before the cure threshold. In some applications, the cure threshold may be naturally defined related to the events of interest. For example, spontaneous abortion (SAB) mentioned earlier is only defined as pregnancy loss before week 20 of gestation, and subjects without such events before week 20 week are clearly “cured” for SAB. Therefore, the cure threshold is naturally defined as week 20 for SAB. In this way, the cure model is also a natural candidate to be used for analyzing this type of data.
The fact that the SAB data consist of both interval censored and exactly observed event times is referred as partly interval censored and actually occurs very often in practice. Another example of partly interval censored data is progression free survival (PFS) time in clinical trials, because PFS time is defined as the smaller of death and progression times which are usually right-censored and interval censored, respectively. Intuitively the asymptotic results for the maximum likelihood estimation (MLE) under the Cox model with partly interval censored data will be the same as those for the MLE with right-censored data in terms of convergence rate, since for both partly interval censored and right-censored data the likelihood function will be dominated by the term with observed events.
However, Kim (2003b) pointed out that if the interval censored observations are naively ignored from the whole data set, both estimation bias and standard error will be enlarged. Hence, a method correctly addressing this type of complicated data set is needed.
Unfortunately we have found no published work on cure rate model with partly interval censored data in the presence of left truncation, which is the case for the SAB data application that we will describe in more details in Section 7.
We will consider the sieve approach which has shown efficiency in computation for both nonparametric and semiparametric survival analysis problems under smoothness assumptions, and has variance estimator readily available.
Ramsay (1988) has observed that closely related to the well-known B-splines, there are so-called M-splines and I-splines, where the M-splines are the derivatives of the I-splines. In the following we will use the B-spline form for theoretical developments, and the M-spline and I-spline form for simplicity of computing.
To our best knowledge, this work is the first attempt to provide an approach for analyzing the complex survival data that are partly interval censored, left truncated and with a cured portion. The paper is organized as follows. Section 2 proposes the semiparametric sieve MLE for the non-mixture Cox model when data are left truncated, partly interval censored and with a cured portion.
Section 3 provides all the asymptotic results for both the parametric part and the nonparametric part including consistency and asymptotic normality results. The convergence rate is showed to be the optimal for the nonparametric MLE problem. The asymptotic normality for the nonparametric part is established for the smooth functional of the sieve estimator. Section 4 describes the computational method for the proposed sieve MLE. Section 5 finds the estimator for the variance of both the parametric and the nonparametric part. Section 6 conducts simulation studies to verify the finite sample performance for the proposed method. Section 7 applies the proposed methodology to analyze an observational data set on spontaneous abortion. Section 8 summaries the theoretical and numerical results and discusses how it performs when our target data structure is simplified as several types and mentions some potential future work. In Appendix we provide proofs for all theorems in this paper with necessary lemmas using modern empirical process theory.
2 Semiparametric sieve MLE
Consider the non-mixture cure model proposed by Chen et al. (1999), in which the survival function of the event time given covariates is
,
where is a vector of regression parameter contains an intercept and -dimensional vector , and is a distribution function. Let and in the following we focus on the case when . Since the survival function here does not decrease beyond , there are no subjects with and the cure threshold is naturally equal to Zeng et al. (2006). In addition, subjects who do not experience the event within the time window are cured.
Let be the left truncation time on with . And let be the observation interval on , where and may be both equal to . We assume that and are independent given and , and and are independent given .
Denote for interval censoring, for right-censoring and for observed events.
Write , which represents the baseline cumulative hazard for the non-mixture cure model. Note that and have a one-to-one correspondence and since is a distribution function and has maximum one. With left truncated data the baseline cumulative hazard may not be reliably estimated due to lack of observations at the left end.
In this paper we will show that nonetheless the functional increase of the baseline cumulative hazard from a “non-zero” point can be still accurately estimated.
We note that since , it will be also hard to estimate with left truncated data, and here we avoid this estimation by focusing on and its increment.
In the following we rewrite the above non-mixture cure model as
(1)
where , which is different from the unbounded cumulative baseline hazard in the original Cox model without cured subjects.
Let be the random observation and let satisfy . The log-likelihood of an i.i.d. sample , , based on the cure model (1) is
(2)
by omitting the additive terms that do not involve .
The optimization of the above log-likelihood can be very challenging, as the semiparametric MLE approach would discretize into point masses at each distinct observed event time, and under the continuous distribution assumption the number of distinct observations is comparable to the sample size. We will then have to maximize (2) with a very large number of parameters when the sample size is large.
To ease the computational difficulties for these type of estimation problems, Geman and Hwang (1982) proposed a sieve maximum likelihood estimation procedure. The main idea of the sieve method is maximize the likelihood with much fewer variables in a subclass that “approximates” to the original function space.
In addition, Huang et al. (2008) established that the sieve method provides an easy way to compute the observed information matrix. In the following
the sieve maximum likelihood estimation is proposed for the non-mixture cure model with partly interval censored and left truncated data.
Let the B-spline basis functions of order be with knot sequence satisfying
where for .
With , define
The requirement for all coefficients being positive will guarantee that only contains nonnegative function for approximating the space of smooth hazard functions on .
If is replaced by in (2)we have the log likelihood function as
(3)
The sieve maximum likelihood estimation is obtained through maximizing the log-likelihood function (3) in terms of . Note that the sieve MLE could have good asymptotic properties if “approximates” the space of nonnegative functions.
3 Asymptotic properties
In this section, we describe asymptotic properties
of the proposed sieve semiparametric MLE. Study of the asymptotic properties of the proposed sieve estimator needs empirical process theory and requires
some regularity conditions, regarding the event time, observation time, truncation time and covariates. The following conditions sufficiently guarantee the results
in the forthcoming theorems.
C1
Covariate variable is bounded, that is, there exists a scalar such that . Here denotes Euclidean norm.
C2
For the true cumulative hazard for , let satisfy . Then is continuously differentiable up to order on .
C3
If is interval censored, then has a uniform positive lower bound.
C4
Let be the survival function of at given and , then has a uniform positive lower bound for independent of and .
C5
The joint density of has a uniform positive lower bound and a uniform upper bound in the the support region of joint random variable.
C6
For some , for all .
Remark 1. Condition C2 implies that is bound on and hence the survival rate of at is not 0, which corresponds cure rate model; Condition C2 also implies that the first derivative of is bounded on , which is necessary to apply the result of Example 19.10 in van der Vaart (1998) in the proof of consistency. Condition C3 guarantees the interval censored term in the likelihood function to be bounded. Condition C4 implies that the conditional survival function of has a positive lower bound, which is a reasonable assumption since a significant portion of subjects are cured at the threshold ().
Condition C5 implies that the density functions of , and all have positive lower bounds and hence the data structure is truly partly interval censored including significant portions of observed events, interval censored events and right-censored events.
Condition C6 will be used similarly as C13 and C14 in Wellner and Zhang (2007).
Before stating our main theorems, we define some notations.
For the knot sequence previously defined for with for , further let and . Then, with we define
where and satisfy and on , is a large positive number for relaxing the constraints on in finite sample computing as discussed in Section 4.
Note and do exist given C2 and C5. Then . Note that is a general space of positive spline functions, and for the theoretical developments some regularity conditions are necessary to form . We also let be a compact set in and includes in its interior, and let with and . Then .
We denote the maximizer of over .
Define the norm associated with the joint probability measure for based on the fact that , as
. Then we could define the distance between and as
For one single observation from the random observation and a general semiparametric variable , the likelihood (after removing terms unrelated to ) is given by
with . We denote with being the true joint probability measure of , and
with
the empirical process indexed by . Let be a constant that might have different values from place to place in the theoretical development. In what follows, we first show the consistency of the proposed estimator and establish the rate of convergence.
Theorem 1.
Suppose that C1–C6 hold, then is a consistent estimator for and
Remark 2. This theorem implies that for , , which is the optimal convergence rate for the nonparametric MLE when the true target functions are continuously differentiable up to order .
For any fixed and with and . Lemma 4 in the supplemental material implies that . Hence, the estimation for the baseline hazard at any “non-zero” point is fine and the functional increase can be consistently estimated by the proposed sieve MLE. This is similar to the theoretical result for the estimated baseline hazard based on left truncated interval censored data in Kim (2003a).
Now we present the asymptotic normality for the proposed estimator including the parametric part and the smooth functional of the nonparametric part.
Consider a parametric smooth submodel with parameter with , then , and for the functional . Let be the class of functions defined by this equation. The score operator for with is the directional derivative at along :
And the two times directional derivative at along and is
In addition, for with for , let be the d-dimensional vector with its th element . For and
, let be the matrix with its th row th column element .
For the -dimensional , let , where is the partial derivative of with respect to , .
Denote for . If , then by Theorem 1 on page 70 in Bickel et al. (1993) the efficient score for is with . Let , then the information matrix for is given by
Theorem 2.
Suppose that C1–C6 hold,
where . That is, by the central limit theorem.
Since the convergence rate we established is slower than , the asymptotic normality is not easy to obtain for , the nonparametric part of the sieve MLE. However it can still be shown that the asymptotic normality is available for its smooth functional , which is the plug in estimator of for any fixed and with and . Here is chosen due to the left truncation, when the parameter cannot be estimated efficiently on the region close to zero. This corresponds to the consistency result for the nonparametric part we discussed in Remark 2.
The asymptotic normality of is established using the idea used in Shen (1997) and Chen et al. (2006).
Let with and be a bounded function, then the directional derivative along of evaluated at is given by
(4)
where is as previously defined.
Based on the directional derivative, the Fisher information inner product is defined as
and the Fisher information
distance is given by .
Now for the directional derivative of at , the Riesz representation theorem implies that there exists such that for any as defined above
and
Theorem 3.
Given that C1–C6 hold,
with the finite variance .
4 Computing the sieve MLE
In theoretical part we denoted the sieve MLE as the maximizer of defined by (3) over . In finite sample computing, we consider to relax the conditions for the ’s in . First for the spline knot sequence as in Zhang et al. (2010) and Wu and Zhang (2012) for sample size of distinct observations we let , the largest integer smaller than , and position interior knots based on quantiles of the data distribution. It can be seen that is naturally bounded since C5 implies distinct observations will be “approximately” equally distributed. In the condition implies that the difference between two adjacent I-spline coefficients is not large compared to , which will hold if for finite sample size and large .
Hence, if we define
with the knot sequence we just mentioned, then for finite sample computing we could replace by and find the maximizer of (3) over . From the compactness of , we simply let in computing.
We observe that in (3) the integration of the B-spline basis functions are involved, which complicates the computing. As an alternative to B-spline based sieve estimation, monotone I-spline technique for sieve estimation was first introduced by Ramsay (1988). In what follows we choose to adopt the monotone I-splines to approximate the cumulative hazard . Thus the integration of B-spline basis functions can be avoided.
We note that Joly et al. (1998) also applied a similar computational approach for estimating hazard and cumulative hazard functions in survival data with a penalty term in the likelihood, but with no theoretical results.
Let and be I-spline and M-spline basis functions, respectively, as defined by Ramsay (1988) and Schumaker (1981), with . Wu and Zhang (2012) showed that and , where are two knots from the knot sequence associated with the according B-spline basis functions. Note that has degree , while both and have degree .
Then we can show that is equivalent to with the I-spline function space defined as
Hence, the B-spline based estimation problem can be converted to a equivalent I-spline based estimation problem. As just discussed, for finite sample case with large we could further simplify as
(5)
with each small positive number .
Now we write the likelihood with I-spline basis functions as
(6)
In practice for the finite sample I-spline based computing,
we need to find the maximizer for as defined by (6) over . Then by the aforementioned equivalency, we have .
Since the constraints in given by (5) is made by linear inequalities, the maximization of (6) over can be efficiently implemented by the generalized gradient algorithm Jamshidian (2004), as done in Zhang et al. (2010) and Wu and Zhang (2012). More details about this algorithm can be found in these papers.
5 Variance estimation
In addition to the advantage in computing the MLE, it is also straightforward to obtain the consistent observed information matrix for based on the proposed sieve MLE approach.
Denote as the vector of B-spline basis functions of order , then
Let ,
, and
. The observed information matrix is given by
Theorem 4.
Given that C1-C6 hold,
Next, we propose how to estimate the variance for the plug-in estimator for . We consider a similar method as for the observed information matrix for . In what follows we adopt the idea described in Cheng et al. (2014). Let with . By the construction of , , and above, we can treat as the observed information matrix for the spline coefficient vector . Since
,
we have
Hence, by delta method the variance for can be estimated by .
6 Simulation studies
In simulation studies we let all spline basis functions have order , that is, we use quadratic B-spline and M-spline basis functions, cubic I-spline basis functions throughout the simulation. We choose sample size as 200 and 500 with 1000 repetitions. The knot sequence for splines is chosen as described in Section 4.
Let and let covariate , where follows standard normal distribution and follows Bernoulli distribution with probability of .
We generate event time with three cumulative hazard functions , and satisfying , and for , and , and for . Hence, for all cases the cure threshold . Note that represents the situation with an average observed cure rate of (small cure rate), with an average cure rate of (medium cure rate) and with an average cure rate of (large cure rate).
For all three cumulative hazard functions we generate left truncation time and observation interval in two different ways: 1) is generated from Uniform , and is generated from Uniform ; 2) is generated from Uniform , and is generated from Uniform . For both cases and are set to if they are , and if .
For 1) the resulting truncation rates in the uncured subjects with , and are , , and , respectively, and the resulting censoring rates in the remaining subjects after truncation are , and , respectively; for 2) the corresponding truncation and censoring rates
are , , and , and
, and , respectively.
We refer to the above two settings as relatively light versus heavy truncation and censoring in the following.
We use the proposed sieve MLE method to estimate the parametric part and the smooth functionals of the nonparametric part for , and 3.
Due to limitation of space we present here results for the small and large cure rates ( and 3), while the results for are in-between of these two cases and are available from the authors.
Table 1 and 2 present the results for estimating for 200 and 500, and
Table 3 and 4 present the estimation results for with and 3, and , respectively.
The tables include estimation bias, sample standard deviation (SD) and average estimated standard error based on the proposed estimated information matrix introduced in Section 5 (SE), and coverage probability of nominal confidence intervals based on the estimated standard error ( CP).
Table 1: Estimation of the parametric part with small cure rate
Light truncation and censoring
True value
Estimate
SD
SE
CP
size=200
0.7
0.711
0.112
0.117
96.5%
-0.5
-0.503
0.177
0.186
96.0%
size=500
0.7
0.709
0.069
0.071
95.7%
-0.5
-0.501
0.112
0.114
95.4%
Heavy truncation and censoring
True value
Estimate
SD
SE
CP
size=200
0.7
0.736
0.153
0.163
96.4%
-0.5
-0.525
0.244
0.256
94.7%
size=500
0.7
0.716
0.098
0.097
95.7%
-0.5
-0.510
0.149
0.155
95.5%
Table 2: Estimation of the parametric part with large cure rate
Light truncation and censoring
True value
Estimate
SD
SE
CP
size=200
0.7
0.717
0.209
0.221
96.7%
-0.5
-0.527
0.405
0.412
96.5%
size=500
0.7
0.710
0.129
0.129
95.3%
-0.5
-0.524
0.244
0.245
95.0%
Heavy truncation and censoring
True value
Estimate
SD
SE
CP
size=200
0.7
0.736
0.381
0.468
96.8%
-0.5
-0.619
0.697
0.856
99.0%
size=500
0.7
0.720
0.212
0.230
96.7%
-0.5
-0.509
0.399
0.427
96.6%
Table 3: Estimation of the cumulative hazard difference with small cure rate
Light truncation and censoring
True value
Estimate
SD
SE
CP
size=200
0.490
0.507
0.109
0.112
95.9%
0.967
0.980
0.207
0.224
96.8%
1.142
1.142
0.233
0.308
98.3%
size=500
0.490
0.496
0.067
0.070
96.6%
0.967
0.974
0.126
0.133
95.5%
1.142
1.144
0.148
0.171
96.6%
Heavy truncation and censoring
True value
Estimate
SD
SE
CP
size=200
0.490
0.515
0.133
0.143
96.2%
0.967
1.020
0.262
0.277
96.4%
1.142
1.210
0.295
0.328
97.7%
size=500
0.490
0.500
0.087
0.087
94.4%
0.967
0.983
0.155
0.160
95.9%
1.142
1.170
0.178
0.185
95.5%
Table 4: Estimation of the cumulative hazard difference with large cure rate
Light truncation and censoring
True value
Estimate
SD
SE
CP
size=200
0.044
0.046
0.013
0.015
96.9%
0.088
0.088
0.028
0.032
96.1%
0.104
0.104
0.032
0.074
99.1%
size=500
0.044
0.046
0.008
0.009
96.1%
0.088
0.088
0.018
0.019
95.4%
0.104
0.104
0.020
0.030
98.6%
Heavy truncation and censoring
True value
Estimate
SD
SE
CP
size=200
0.044
0.047
0.021
0.025
95.9%
0.088
0.094
0.039
0.056
97.6%
0.104
0.109
0.044
0.070
98.0%
size=500
0.044
0.047
0.013
0.014
94.5%
0.088
0.092
0.025
0.029
96.1%
0.104
0.107
0.029
0.033
95.4%
From the tables we can see that the simulation results for estimating both and the increments of the baseline cumulative function from to in general become more accurate when sample sizes increase or truncation and censoring becomes less severe, with smaller biases, more accurate standard errors compared to the sample standard deviations, and reduction in the variability of estimation. We also see that the coverage probabilities of the confidence intervals are generally acceptable.
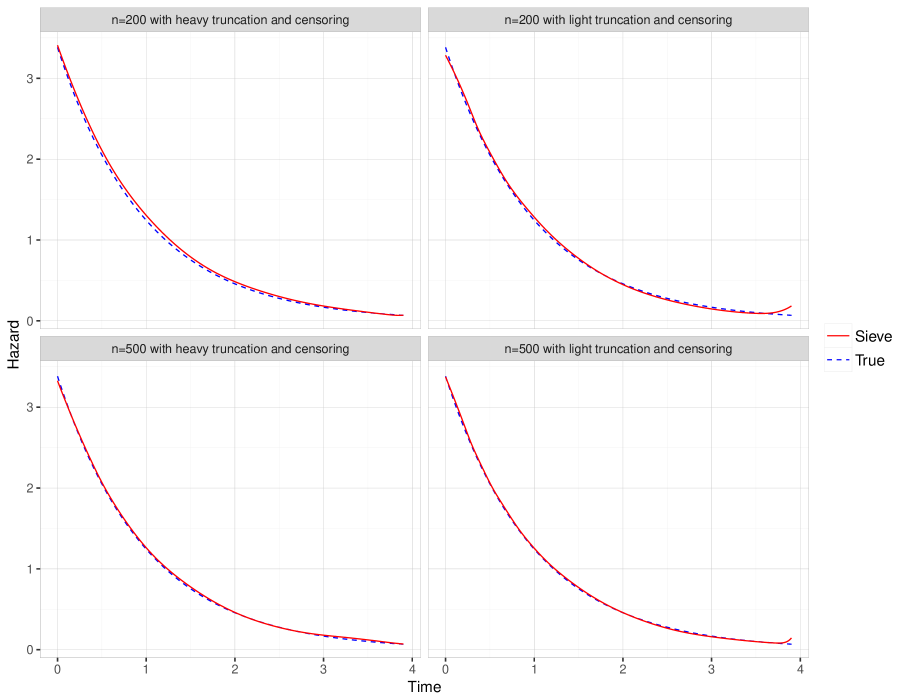
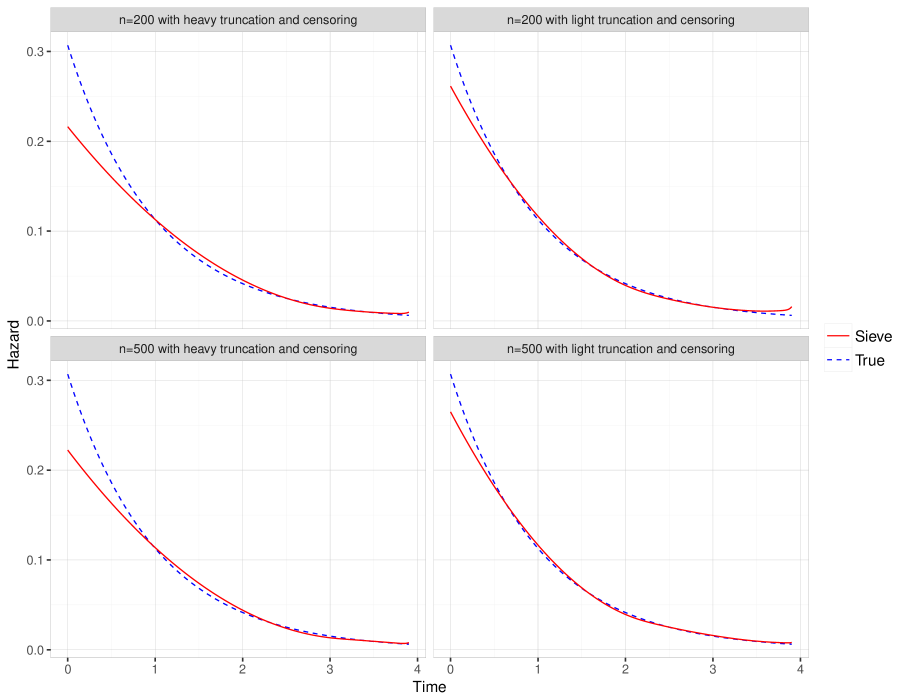
Finally, we also show the estimation results of the baseline hazard function with and 3 on interval [0, 3.9] for sample size 200 and 500, which are averaged over 1000 curves. Figure 1
and 2 present the results for estimating and , respectively.
We see that the estimation becomes more accurate for larger . These figures also show that the estimation close to the right end point is not very accurate for light truncation and censoring and sample size 200, which is likely caused by the small number of the events around there.
We note that the estimation near seems to improve with heavier truncation and censoring, most likely because with heavier truncation more observations appear at later times (closer to ). In addition, it is important to note that the baseline hazard becomes noticeably underestimated close to time zero when the cure rate is larger and truncation and censoring is more severe. This underestimation phenomenon is likely caused by the reduced
risk sets due to left truncation and is consistent with our theoretical result that the estimation of the hazard function close to time zero is not reliable. However, we have noted earlier that the increments of the baseline cumulative function can nonetheless be well estimated.
Figure 1: True baseline hazard function (True) and its sieve MLE (Sieve) with small cure rate.
Figure 2: True baseline hazard function (True) and its sieve MLE (Sieve) with large cure rate.
7 Spontaneous abortion data analysis
We apply the proposed sieve MLE method to an observational data set on spontaneous abortion from the autoimmune disease in pregnancy database of the Organization of Teratology Information Specialists (OTIS) mentioned earlier. Our focus is to investigate the potential effect of autoimmune disease medication on (spontaneous abortion) SAB, which is defined as any spontaneous pregnancy loss occurring before week 20 of gestation.
Our study sample includes pregnant women who entered a research
study between 2005 and 2012. It consists of 923 women who entered the study
before week 20 of their gestation. Since some women in the population may experience the SAB event before having the chance to enter the study, we consider the study entry time as left truncation time. Among the 923 subjects 56 women experienced the SAB event and the exact SAB time is known, 10 women also experienced the SAB event but only a time window including the incidence is available, 2 women were lost to follow-up before week 20, the rest of the women did not experience the SAB event.
In our proposed method, the lost to follow-up subjects and the observed cured subjects (subjects did not experience the SAB events before the cure threshold of week 20) are both treated as right-censored in the likelihood function under the non-mixture cure model, the same as in Sy and Taylor (2000). This way in the study sample we have 56 subjects with exact observed event times, 10 interval censored event times, and the rest are treated as right-censored. So the data set is partly interval censored with left truncation, as women entered the research study any time during the first 20 weeks of gestation, and also with a well defined cured portion. Since 10 interval censoring from all 66 women who experienced SAB is not an ignorable portion, the existing methods based on right-censoring is not applicable here. Therefore the proposed sieve MLE method can be a good choice for the analysis.
For the primary comparison groups, among the 923 women 481 are pregnant and with certain autoimmune diseases which were treated with medications under investigation, 262 are women with the same specific autoimmune diseases but who were not treated with the medications under investigation, and the rest are healthy pregnant women without autoimmune diseases who were not treated with the medications.
We also include three important covariates: maternal age (range 18.6 - 47.1 years), prior therapeutic abortion (TAB; yes/no), and smoking (yes/no).
For the analysis, as in the simulation studies we use quadratic B-spline and M-spline basis functions, and cubic I-spline basis functions. The knot sequence for the splines is chosen as described in Section 4.
Table 5 presents the estimation results for our study sample based on the proposed sive MLE approach.
According to the results from Table 5 we do not have statistical evidence to show that the autoimmune disease drugs have any significant effects on the risk of SAB. We also see that older women have higher risk to experience the SAB events and smoking will increase the risk of the SAB.
Table 5 also shows the proposed sieve MLE for and with and (weeks). The standard errors of these estimates are consistent with our theoretical results and imply that while the direct estimate for the baseline cumulative hazard function for the SAB occurring time has too much variability due to left truncation, the functional increase from a point not close to zero can still be reliably estimated.
Table 5: Estimation of covariate effects and cumulative baseline hazard using the spontaneous abortion data
Estimate
SE
-value
Maternal age
0.079
0.025
0.002
Prior Tab
-0.358
0.436
0.411
Smoking
0.823
0.364
0.024
Healthy control
-0.303
0.479
0.527
Diseased control
0.236
0.279
0.398
0.0173
0.020
-
0.0174
0.020
-
0.0174
0.020
-
0.0124
0.004
-
0.0125
0.004
-
0.0126
0.004
-
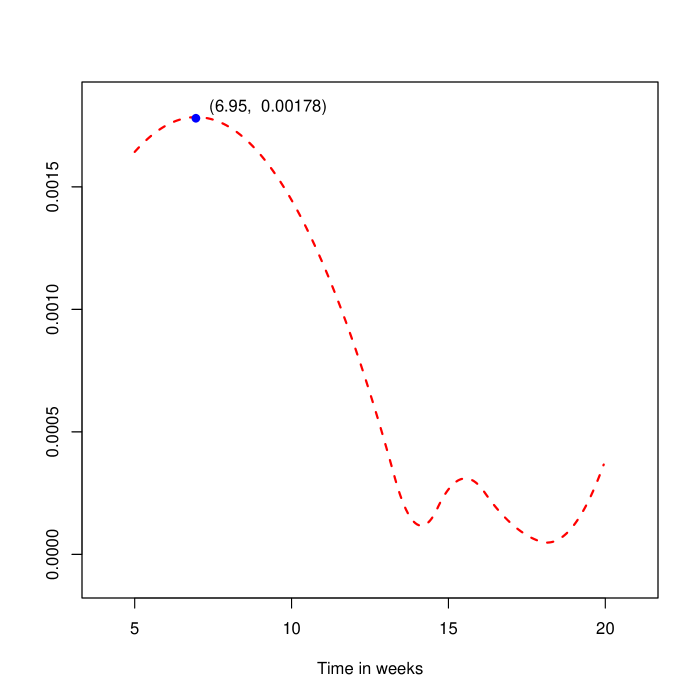
Figure 3 shows the estimated baseline hazard function based on the proposed sieve MLE,
and implies that the highest risk period for women to experience the SAB events is between 5 and 10 weeks of gestation. This is consistent with existing scientific knowledge about spontaneous abortion.
Figure 3: Estimated baseline hazard of spontaneous abortion
8 Concluding remarks
In this paper we have proposed the semiparametric sieve MLE method to analyze complex survival data that are partly interval censored, left truncated and with a cured portion. The proposed approach is motivated by a spontaneous abortion data application with this type of complicated structure, since no existing survival method is able to directly handle this type of survival data. Non-mixture cure model based on the Cox regression is used due to the relative simplicity of the likelihood computation. Using modern empirical process we have thoroughly studied the asymptotic properties for the proposed method: we have established that the proposed estimation is consistent with optimal convergence rate for the nonparametric MLE problem; we have also established the asymptotic normality for both estimators of the parametric part and a functional of nonparametric part. In addition, we have provided closed form variance estimation for both the parametric and the nonparametric parts. In simulation studies we have showed that the finite sample performance of the proposed sieve MLE is satisfactory. Finally, the proposed model was successfully applied for analyzing the SAB data set.
The proposed method is designed for relatively general survival data and usually applicable for simpler data structures. For different types of survival data, the proposed model may perform differently. For example, if partly interval censored data is replaced by right-censored only data, the proposed sieve MLE has the same asymptotic properties in terms of convergence rate and asymptotic normality as we mentioned in Section 1. However, if the data is purely interval censored, the estimation of hazard function will not be available based on the likelihood (since the third term in (2) disappears);
separately by similar method as in Zhang et al. (2010) it can be shown that the rate of estimation of cumulative hazard function will be slower than .
In addition, if there is no left truncation, the baseline cumulative hazard function itself can be reliably estimated, as opposed to only its functional increases.
We have established that due to lack of data information around time zero for left truncated data, the nonparametric estimation around that region is not reliable. In the future we plan to tackle this issue and improve the estimation for the nonparametric part around time zero.
Another related potential work might be to replace the Cox model by the more general transformation model Zeng et al. (2006) and developing the general semiparametric sieve MLE method.
Acknowledgements
The research of Yuan Wu was supported in part by award number P01CA142538 from the National Cancer Institute. The content is solely the responsibility of the authors and does not necessarily represent the official views of the National Institute of Health.
References
Bickel et al. (1993)
Bickel, P., Klaassen, C., Ritov, Y., and Wellner, J. A. (1993).
Efficient and Adaptive Estimation for Semiparametric Models.
Johns Kopkins University Press, Baltimore.
Chen et al. (1999)
Chen, M. H., Ibrahim, J. G., and Sinha, D. (1999).
A new bayesian model for survival data with a survival fraction.
Journal of the American Statistical Association, 94,
909–919.
Chen et al. (2006)
Chen, X., Fan, Y., and Tsyrennikov, V. (2006).
Efficient estimation of semiparametric multivariate copula models.
Journal of the American Statistical Association, 475,
1228–1240.
Cheng et al. (2014)
Cheng, G., Zhou, L., Chen, X., and Huang, J. Z. (2014).
Efficient estimation of semiparametric copula models for bivariate
survival data.
Journal of Multivariate Analysis, 123, 330–344.
de Boor (2001)
de Boor, C. (2001).
A Practical Guide to Splines, Revised Ed.Springer, New York.
Geman and Hwang (1982)
Geman, A. and Hwang, C. R. (1982).
Nonparametric maximum likelihood estimation by the method of sieves.
Annals of Statistics, 10, 401–414.
Hu and Xiang (2013)
Hu, T. and Xiang, L. (2013).
Efficient estimation for semiparametric cure models with
interval-censored data.
Journal of Multivariate Analysis, 121, 139–151.
Hu and Xiang (2016)
Hu, T. and Xiang, L. (2016).
Partially linear transformation cure models for interval-censored
data.
Computational Statistics and Data Analysis, 93,
257–269.
Huang et al. (2008)
Huang, J., Zhang, Y., and Hua, L. (2008).
A least-squares approach to consistent information estimation in
semiparametric models.
Technical report, Department of Biostatistics, University of Iowa.
Jamshidian (2004)
Jamshidian, M. (2004).
On algorithms for restricted maximum likelihood estimation.
Computational Statistics and Data Analysis, 45,
137–157.
Joly et al. (1998)
Joly, P., Commenges, D., and Letenneur, L. (1998).
A penalized likelihood approach for arbitrarily censored and
truncated data: application to age-specific incidence of dementia.
Biometrics, 54, 185–194.
Kim (2003a)
Kim, J. S. (2003a).
Efficient estimation for the proportional hazards model with
left-truncated and “case 1” interval-censored data.
Statistica Sinica, 13, 519–537.
Kim (2003b)
Kim, J. S. (2003b).
Maximum likelihood estimation for the proportional hazards model with
partly interval-censored data.
Journal of the Royal Statistical Society, Series B, 65,
489–502.
Lam and Xue (2005)
Lam, K. F. and Xue, H. (2005).
A semiparametric regression cure model with current status data.
Biometrika, 92, 573–586.
Liu and Shen (2009)
Liu, H. and Shen, Y. (2009).
A semiparametric regression cure model for inverval-censored data.
Journal of the American Statistical Association, 104,
1168–1178.
Ma (2010)
Ma, S. (2010).
Mixed case interval censored data with a cured subgroup.
Statistica Sinica, 20, 1165–1181.
Ramsay (1988)
Ramsay, J. O. (1988).
Monotone regression splines in action.
Statist Science, 3, 425–441.
Schumaker (1981)
Schumaker, L. (1981).
Spline Function: Basic Theory.
John Wiley, New York.
Shen (1997)
Shen, X. (1997).
On methods of sieves and penalization.
Annals of Statistics, 25, 2555–2591.
Sy and Taylor (2000)
Sy, J. P. and Taylor, J. M. G. (2000).
Estimation in a cox proportional hazards cure model.
Biometrics, 56, 227–236.
van der Vaart (1998)
van der Vaart, A. W. (1998).
Asymptotic Statistics.
Cambridge University Press, Cambridge.
van der Vaart and Wellner (1996)
van der Vaart, A. W. and Wellner, J. A. (1996).
Weak Convergence and Empirical Processes.
Springer, New York.
Wellner and Zhang (2007)
Wellner, J. A. and Zhang, Y. (2007).
Likelihood-based semiparametric estimation methods for panel count
data with covariates.
Annals of Statistics, 35, 2106–2142.
Wu and Zhang (2012)
Wu, Y. and Zhang, Y. (2012).
Partially monotone tensor spline estimation of the joint distribution
function with bivariate current status data.
Annals of Statistics, 40, 1609–1636.
Zeng et al. (2006)
Zeng, D., Yin, G., and Ibrahim, J. G. (2006).
Semiparametric transformation models for survival data with a cure
fraction.
Journal of the American Statistical Association, 101,
670–684.
Zhang et al. (2010)
Zhang, Y., Hua, L., and Huang, J. (2010).
A spline-based semiparametric maximum likelihood estimation for the
cox model with interval-censored data.
Scandinavian Journal of Statistics, 37, 338–354.
Appendix
Proofs for theorems
Proof of Theorem 1
(1)
We apply Theorem 5.7 in van der Vaart (1998) to show the consistency. By the proof of Theorem 5.7 in van der Vaart (1998), we need to find a set including both and as the “” of Theorem 5.7 in van der Vaart (1998).
For this goal with enough small and enough large and first we define as
(7)
And denote
(8)
Then Lemma 1 implies and , hence include and . Then is the “”. In what follows we complete the proof by verifying the conditions of Theorem 5.7 in van der Vaart (1998).
So when is small enough and and are large enough.
Therefor and , hence include and . Then is the “”. In what follows we complete the proof by verifying the conditions of Theorem 5.7 in van der Vaart (1998).
First, we verify .
Denote , then
it suffices to show that is a -Glivenko-Cantelli, since
.
Since compact set can be covered by balls with radius , it can be shown that for any there exists a with such that ,
and hence for any by C1.
By Example 19.10 on Page 272 in van der Vaart (1998), we know that there exists -brackets
to cover . It is obvious that for any and ,
there exists such that for some , then
for both and .
Hence, it is easy to construct a set of brackets with and
that for any with any observation we have , where
It can be seen that by C1, C2, C3, C5 and Taylor’s expansion (by some algebra using the properties of ).
This leads to the conclusion that .
Then by , we have . Hence, is a -Glivenko-Cantelli
by Theorem 2.4.1 in van der Vaart and Wellner (1996).
Finally, we verify .
Lemma 3 establishes that there exists an in such that , then also
.
For , it can be seen that . Then since is the MLE over , we have
Hence,
By C1, C2, C3, the construction of and Taylor’s expansion, we know that
Then
By , we have . Then
So is a donsker by Theorem 19.5 in van der Vaart (1998). Then by Corollary 2.3.12 in van der Vaart and Wellner (1996) we have
In addition, by Cauchy-Schwarz inequality as
Then . Hence,
This completes the proof of .
(2)
Next we establish the rate of convergence
by verifying the conditions of Theorem 3.4.1 in van der Vaart and Wellner (1996). To apply this theorem, we denote as and denote as . And we let the maximizer of or the true parameter as .
Let with and . We verify that for every and arbitrary with ,
Since for large . By C1, C2, C3, C5 and the construction of we can show that . Then by the result in the consistency development for large ,
We shall find a function such that
and is decreasing for , for some , and for , it satisfies
For as defined previously, let
First we evaluate the bracketing number of . Let
and
As , can be covered by balls with radius , that is, for any there exists a with such that and hence by C1. This implies that
for any . Then for any , there exists such that with .
Also by Lemma 0.6 in Wu and Zhang (2012), there exists -brackets , to cover . Denote and , then for any , there exists , such that or equivalently
.
Hence, for any there exist and with , and , where
and
By some algebra using the properties of , we can show that . Hence, the -bracketing number with norm for is . Then obviously also has the -bracketing number for norm. Since -norm is bounded by norm, we have
By C1, C2, C3, C5 and some algebra using the properties of , we can show that and is uniformly bounded.
In addition,
Then Lemma 3.4.2 in van der Vaart and Wellner (1996)
with . It is easy to see that is a decreasing function of . Note that for ,
Therefore, if then . Moreover
This implies if , then and .
Since and in probability. Therefore, it follows by Theorem 3.4.1 in van der Vaart and Wellner (1996) that . Hence, by
This establishes the convergence rate.
Proof of Theorem 2
By Theorem 8.1 in Huang et al. (2008), we only need to verify the following three conditions:
B1
and ,
B2
,
B3
.
Without loss of generalization in the following arguments for the three conditions we assume is one dimensional, then is also one dimensional and denoted as .
First we verify B1:
Since is the sieve MLE, we know that
By Jackson’s Theorem on page 149 in de Boor (2001), we could find
with being the arbitrary B-spline space on with such that . We also know that , which is the directional derivative for along at with . In addition, we have
for with small absolute value, then .
Then we can write
where
and
Let . Since for a fixed and any we have . Then by similar arguments as in convergence rate development, we can first show that
and therefore show that for
In addition, it can be similarly shown that for
Hence combining the bracketing numbers for and ,
for
Then
Then by Theorem 19.5 in van der Vaart (1998) we know is a Donsker class. Since
and as
, then by Corollary 2.3.12 of van der Vaart and Wellner (1996) we have
By some algebra and Cauchy-Schwarz inequality, it can be shown that
Then, . Hence, B1 holds.
Next, we verify B2:
Let . Then by similar arguments as for verifying B1 we can show that
Using the preceding argument, we know is a Donsker class. Since by the convergence rate of , it can be shown
Hence, by Corollary 2.3.12 in van der Vaart and Wellner (1996) B2 holds.
Finally, we verify B3:
By bivariate Taylor’s expansion and the convergence rate of we have
and
By the definition of and Theorem 11.1 in van der Vaart (1998),
To derive the asymptotic normality we need the following assumptions:
Assumption 1. Let satisfying . Then there exists small , such that
Assumption 2. Let be the arbitrary B-spline space as set before, then
. Then there exists such that for , we have hence .
Assumption 1 and 2 can be easily verified by convergence rate for and Jackson’s Theorem in de Boor (2001).
Let be the two times directional derivative of at along as defined by (4) in main paper. Then C1, C2, C3 and C5 guarantee the boundedness of the terms from
the second directional derivative. And the following assumption follows.
Assumption 3. If and ,
Next, let
By evaluating the bracketing number for , it can be shown that is a Donsker class. Then we can establish the following assumption by Corollary 2.3.12 of van der Vaart and Wellner (1996).
Assumption 4. If ,
Then using Assumption 1-4 and following the proof of Theorem 1 in Chen et al. (2006) we can establish that
Given C5, by Cauchy-Shwarz inequality and Lemma 4 we have
It is easy to see that .
Hence, .
Proof of Theorem 4
Let with . Huang et al. (2008) showed that . Hence, now we need to verify that
We first show that .
Let . We see that
so is a Glivenko-Cantelli class. By the Jackson’s Theorem on page 149 in de Boor (2001) there exists a such that . Then Glivenko-Cantelli theorem and Dominated Convergence Theorem with regularity conditions
Huang et al. (2008) showed that can be obtained from standard least-squares calculation and is a function of , then and regularity conditions imply that there exists function such that .
Let
.
Then we find that so is a Glivenko-Cantelli class.
It is obvious that is also a Glivenko-Cantelli class.
We just showed that , then
Then by and both being Glivenko-Cantelli classes, Glivenko-Cantelli theorem results in
Then by using Dominated Convergence Theorem
and
Then
Then by is the minimum of and by the fact that for the continuous functional the range is closed for a closed domain, there exists for any a number such that
for any h with . Thus, for large
Then we know for . Hence, .
Next, let . Since we can show so is a Glivenko-Cantelli class. Also by both and are consistent, we have
Technical lemmas
Lemma 1.
Given C2 and C5. Then both and will belong to , where is defined by (7) in the proof of Theorem 1.
Proof of Lemma 1
By C2 and C5, it is obvious that . By the property that the sum of all basses equal to 1 on for B-spline we
have on . Next
So when is small enough and and are large enough.
Lemma 2.
Given C3–C6, for and , where is defined by (8) in the proof of Theorem 1. Then
Let denote the survival function for conditional on for true and for any , respectively, and let and . Then
, after removing terms unrelated to . And the true likelihood function is defined similarly.
Let for Lebesgue measure (dominating measure) . It is easy to see is closely related to since is the joint probability measure of . Then C3, C5 and construction of implies has a positive upper bound and has a positive lower bound. Hence by the proof of Lemma 5.35 in van der Vaart (1998)
Suppose the spline coefficients of are chosen as where ’s are defined by (0.5)
in proof of Lemma 0.2 in Wu and Zhang (2012).
Given C2, by Jackson’s Theorem on page 149 in de Boor (2001) it is easy to see that
.
To complete the proof, it remains to show that ’s satisfy the conditions for .
1.
By , we have for all ’s.
2.
.
3.
.
Lemma 4.
Given C5 and let and be any two fixed numbers with and . Then