Assessing density functionals using many body theory for hybrid perovskites
Abstract
Which density functional is the ”best” for structure simulations of a particular material? A concise, first principles, approach to answer this question is presented. The random phase approximation (RPA)— an accurate many body theory— is used to evaluate various density functionals. To demonstrate and verify the method, we apply it to the hybrid perovskite MAPbI3, a promising new solar cell material. The evaluation is done by first creating finite temperature ensembles for small supercells using RPA molecular dynamics, and then evaluating the variance between the RPA and various approximate density functionals for these ensembles. We find that, contrary to recent suggestions, van der Waals functionals do not improve the description of the material, whereas hybrid functionals and the SCAN (strongly constrained appropriately normed) density functional yield very good agreement with the RPA. Finally, our study shows that in the room temperature tetragonal phase of MAPbI3, the molecules are preferentially parallel to the shorter lattice vectors but reorientation on ps time scales is still possible.
There is no question that Density Functional Theory (DFT)Hohenberg and Kohn (1964); Kohn and Sham (1965) has revolutionized our modeling of condensed matter and materials over the last five decades, and it is well understood why this is so: DFT offers a unique balance between computational efficiency and accuracy— a balance that is simply yet unreached by any other computational method. Equally important is that forces between the atoms are readily computable, so that relaxed ground state structures, vibrational properties, as well as finite temperature properties of any material are straightforwardly obtainable. But DFT is not without shortcomings. For instance, most semi-local functionals completely neglect van der Waals forces, and in many open structures such as perovskites the instabilities of the cage are not very well described. Quite generally, for materials modeling we are often left with the question of choosing the right density functional. This requires either some chemical intuition, or better, higher level reference calculations. In this letter, we present a fully ab-initio method based on the Random Phase Approximation (RPA) to select the best functional for finite temperature structure predictions of a certain material (here hybrid perovskites).
The RPA is an approximate many-body technique for total energies summing the so called bubble or ring diagrams to infinite order. Since it is closely related to the approximation of Lars Hedin Hedin (1965), it should describe band gap related properties very well. By comparison to experimental data and diffusion Monte Carlo calculations it has been shown that the RPA captures energy differences involving very diverse bonding types from covalent, over ionic, to van der Waals like very accurately Marini et al. (2006); Harl and Kresse (2009); Lebègue et al. (2010); Schimka et al. (2010); Olsen et al. (2011); Björkman et al. (2012); Ren et al. (2012); Schimka et al. (2013); Macher et al. (2014); Kaltak et al. (2014). The actual RPA calculations proceed in two steps. First, a DFT calculation is performed using an approximate density functional, in this case the PBE functional Perdew et al. (1996) and all occupied and unoccupied states are determined. Then the RPA correlation energy is evaluated as Nozières and Pines (1958); Langreth and Perdew (1977); Miyake et al. (2002); Fuchs et al. (2005); Furche (2008); Harl and Kresse (2009):
where is the independent particle polarisability calculated using DFT orbitals, is the Coulomb kernel and the imaginary frequency. The exact exchange energy () is calculated and added: .
If we trust RPA to be accurate for solids, the best strategy is obviously i) to calculate finite temperature ensembles using the RPA, ii) calculate total energies of the other functionals for these ”RPA” distributed configurations, iii) rank the functionals based on the energy difference () to the RPA. Calculating the ensembles using some approximate functional is also possible, but the explored structural phase space might not overlap with the correct higher accuracy RPA, biasing the final result.
This strategy is in principle straightforward, but cumbersome. With DFT, we can easily perform finite temperature simulations, yielding appropriately weighted microstates. In the absence of forces, this is rather difficult to do for high level methods, although energies alone suffice to perform Monte-Carlo (MC) or hybrid Monte-Carlo simulations Akira et al. (2009). To achieve high sampling efficiency, the MC moves need to be chosen judiciously, which is not a simple matter for systems where the dynamics is not well understood. Finite temperature Molecular Dynamics (MD) are conceptionally simpler, and this strategy has become possible with our recent implementation of forces within the RPA for solid state systems Ramberger et al. (2017). It is also the main strategy we adopt here to generate ensembles. How to obtain the RPA forces is elaborated in detail in Ref. Ramberger et al., 2017. In short, the key point is the insight that the first derivative of this functional with respect to the Green’s function is just the self-energy () in the approximation Dahlen et al. (2006). The relation between the RPA correlation energy and the self-energy is analogous to the relation between the Kohn-Sham energy and its potentialfn (1).
As an example of the predictive power of this method, the experimentally difficult to determine atomic structure of hybrid perovskites is studied. This is a unique class of materials based on an organic donor, methyl-ammonium (MA) CH3NH, trapped inside a (PbI3)- perovskite cage Green et al. (2014). These materials have reached a light to electricity conversion efficiency of 20% (2016) (NREL), approaching that of silicon based solar cells, but they can be produced cheaply using wet chemistry. Describing these systems with high precision using first principles methods is very challenging. Instabilities in the perovskite cage are often only well captured if band gap related properties and lattice constants are accurately described. In fact, the MA molecules rotate even at room temperature Poglitsch and Weber (1987); Brivio et al. (2015); *Carignano:jpcc15; *Quarti:pccp15; *Mattoni:jpcc15 coupled to concerted movements of PbI octahedra Lahnsteiner et al. (2016). The situation is complicated by the molecules being allegedly bonded to the cage by van der Waals (vdW) interactions Egger and Kronik (2014); Motta et al. (2015).
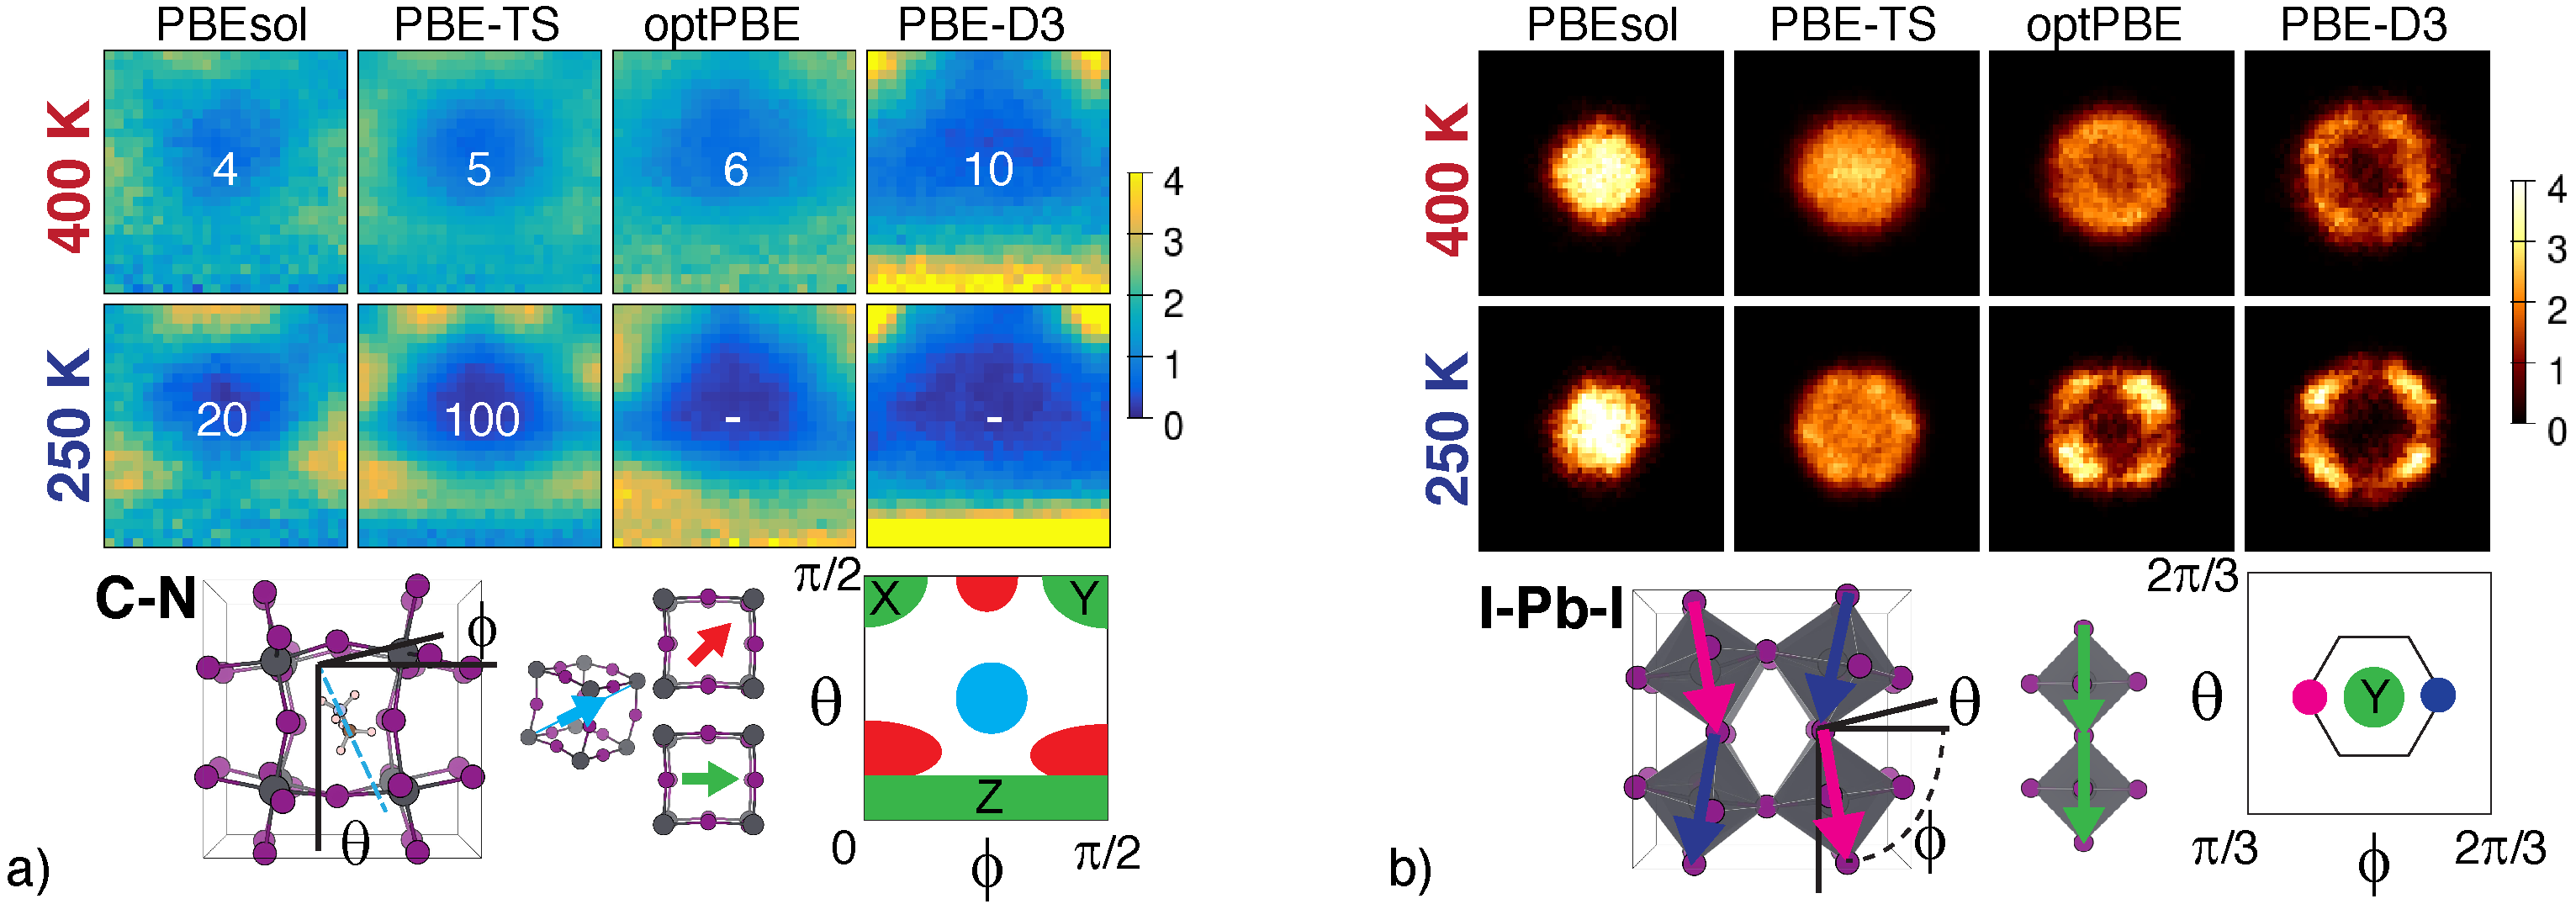
To study the influence of the specific functional on the ordering of the molecules and octahedra in MAPbI3 we have performed long finite temperature parallel tempering ab-initio MD calculations of pseudo-cubic supercells, containing 8 molecules in PbI3 cages. The calculations were performed using the vasp codeKresse and Hafner (1993); *Kresse:prb96; *Kresse:prb99 with a plane-wave basis and the projector augmented wave (PAW) method Blöchl (1994) neglecting spin orbit coupling (details in Supplemental Material SM ). Similarly as in Ref. Lahnsteiner et al., 2016, the orientations of all molecules inside the cages as well as the orientation of the PbI octahedra are extracted in polar coordinates as a function of time. These data are used to create the polar distributions of Figure 1. The ordering of the molecules is highly dependent on the functional and even amongst vdW functionals there are significant differences. The face-diagonal orientations are favored by PBEsol and TS, while optPBE and PBE-D3 favor the principle axes. The room-diagonal orientation is avoided by all considered functionals. The calculated relaxation times of the molecules are shown in Fig. 1 a) as white numbers. Most functionals give values in the order of picoseconds (ps) at room temperature in reasonable agreement with experiment Poglitsch and Weber (1987). The arrangement of the octahedra can be seen in Fig. 1 b). With PBEsol at 250 K the octahedra can tilt and rotate, but without a strong directional preference. For the other functionals, the octahedra tend to form zigzag patterns (or clockwise anti-clockwise patterns), and avoid orientations exactly along the principle axis. At 400 K the orientations are more smeared out. Based on these results alone, it is very difficult to determine which density functional accurately describes the material.
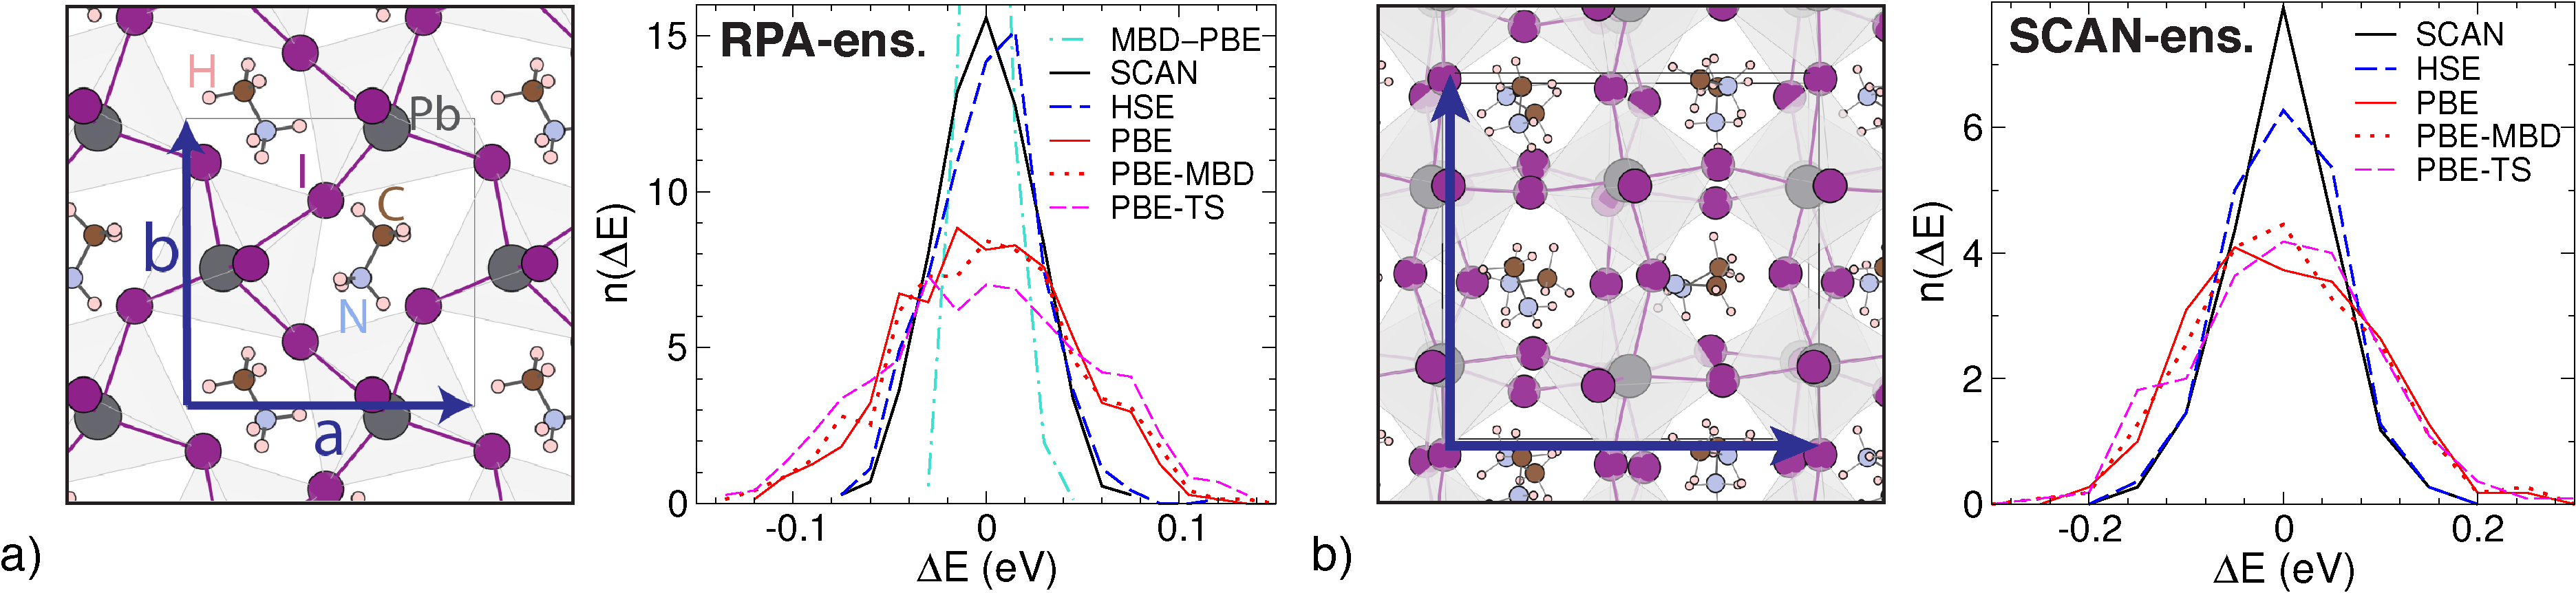
To judge the quality of each functional, a well distributed RPA canonical ensemble of structures is constructed. Because of the computational cost of the RPA, small cubic cells are used. This cell allows for different orientations of neighboring MA molecules (see Fig. 2a). As a starting point, we generate independent configurations using long DFT simulations at our desired temperature of 400 K. The internal geometry of the MA molecule is kept rigid allowing for a time step of up to 10 fs. For DFT simulations, results for rigid MA molecules are practically indistinguishable from unconstrained MD for the orientation of the molecules and dynamics of the cage. From this trajectory, 16 practically independent configurations are picked and finite temperature RPA-MD simulations at 400 K are performed. From the last 1.3 ps of each trajectory, 32 equally spaced configurations are picked yielding 512 partly correlated configurations. These form the RPA-ensemble.
| SCAN | Strongly Const. Approp. Normed Sun et al. (2015) | 25 | 53 | 67 |
| HSE-D3 | HSE Krukau et al. (2006)+ Grimme D3 Grimme et al. (2010) | 27 | 55 | 68 |
| HSE | Heyd-Scuseria-Ernzerhof Krukau et al. (2006) | 27 | 57 | 69 |
| PBE | Perdew-Burke-Ernzerhof Perdew et al. (1996) | 44 | 87 | 104 |
| PBE-MBD | many body dispersion Tkatchenko et al. (2012) | 47 | 89 | 109 |
| PBE-D3 | Grimme D3, vdW corrections Grimme et al. (2010) | 51 | 88 | 111 |
| PBE-TS | Tkatchenko-Scheffler, vdW corrections Tkatchenko and Scheffler (2009) | 54 | 90 | 109 |
| optPBE | vdW DFT functional based on PBE Klimeš et al. (2011) | 54 | 95 | 104 |
| PBEsol | revised PBE for solids Perdew et al. (2008) | 55 | 96 | 106 |
We evaluate the energy difference between each functional and the RPA for all configurations in the RPA-ensemble and subtract the mean difference, the resulting number is hereafter referred to as . The histograms of are shown in Fig. 2 a). The curves follow roughly a Gaussian distribution. In order to rank the functionals, we have calculated the square root of the variance of the energy differences () for many functionals and collect the values in Tab. 1. Of all the considered functionals the HSE, HSE-D3 and SCAN functionals perform best, whereas the PBE functional is noticeably worse. To confirm that the present results carry over to larger supercells and that the short simulation times did not bias the results, we performed MD simulations for a larger supercell using the best and worst preforming functional (SCAN and PBEsol). For both functionals an ensemble of structures was made SM .
As before, the energy differences to the RPA are calculated, the values tabulated in Tab. 1 and the results for SCAN are plotted in Fig. 2 b). The SCAN and PBEsol-ensemble yield a very similar ranking as the RPA-ensemble, although for the PBE derived functionals the order varies somewhat between the ensembles, with the PBEsol-ensemble clearly deviating more significantly from the RPA-ensemble. For all ensembles, though, the SCAN functional is suggested to be the best choice. This indicates that using ensembles created with approximate density functionals is a cheap and viable alternative, if the generation of ensembles using the high level functionals is not possible.
One intriguing result is that the approximate vdW corrected functionals do not improve systematically upon PBE. The many body dispersion (MBD) Tkatchenko et al. (2012) correction of Tkatchenko et al. gives a hint why this is so. In MAPbI3, the MBD corrections are small as indicated by the histogram for the energy differences [MBDPBE, dashed dotted line in Fig. 2 a)]. The curve exhibits a very narrow peak with meV, whereas is approximately 30 meV between PBE and other dispersion corrected schemes for the RPA-ensemble. This implies that the MBD corrections only add a constant shift to the energy but vary little between configurations. The MBD correction is based on the RPA total energy expression for the correlation energy. However, instead of calculating the polarisability from first principles, it assumes atomic dipole oscillators at each atomic site. Since the PbI3 cage has a small optical gap and screens excitations fairly well Bokdam et al. (2016), dispersion interactions are seemingly strongly washed out and show little structure dependence in MBD. The more conventional vdW corrections, such as TS and D3, which do not account for any screening of the cage, perform worse. For HSE-D3, the damping function in D3 is much stronger than for PBE reducing the vdW interactions and the structure dependence. This explains why HSE-D3 is within the statistical error bars identical to the parent functional HSE. Since MBD is by construction more accurate than pairwise vdW interactions, the virtually perfect agreement between PBE and PBE-MBD shows that standard pair-wise long range dispersion interactions should not be included for MAPbI3 and, presumably, most other hybrid perovskites.
The best means to reduce the error of the semi-local functionals is to include exact exchange or use the SCAN functional. The SCAN functional fulfills all known constraints for DFT functionals and depends not only on the density but also on the kinetic energy density Sun et al. (2015). We believe that the main reason for the improved performance of these functionals is a more balanced description of the cage instabilities. The close agreement between HSE and SCAN is in line with a recent publication of Sun et al. indicating that instabilities of perovskites are described equally well by hybrid functionals and SCAN Sun et al. (2016). Remarkably, in the present case, the SCAN functional performs even slightly better than HSE. This is most likely related to the SCAN functional including short range dispersion effects, which conventional hybrid functionals do not account for. We conclude that SCAN is the most suitable functional to study the atomic structure of hybrid perovskite materials.
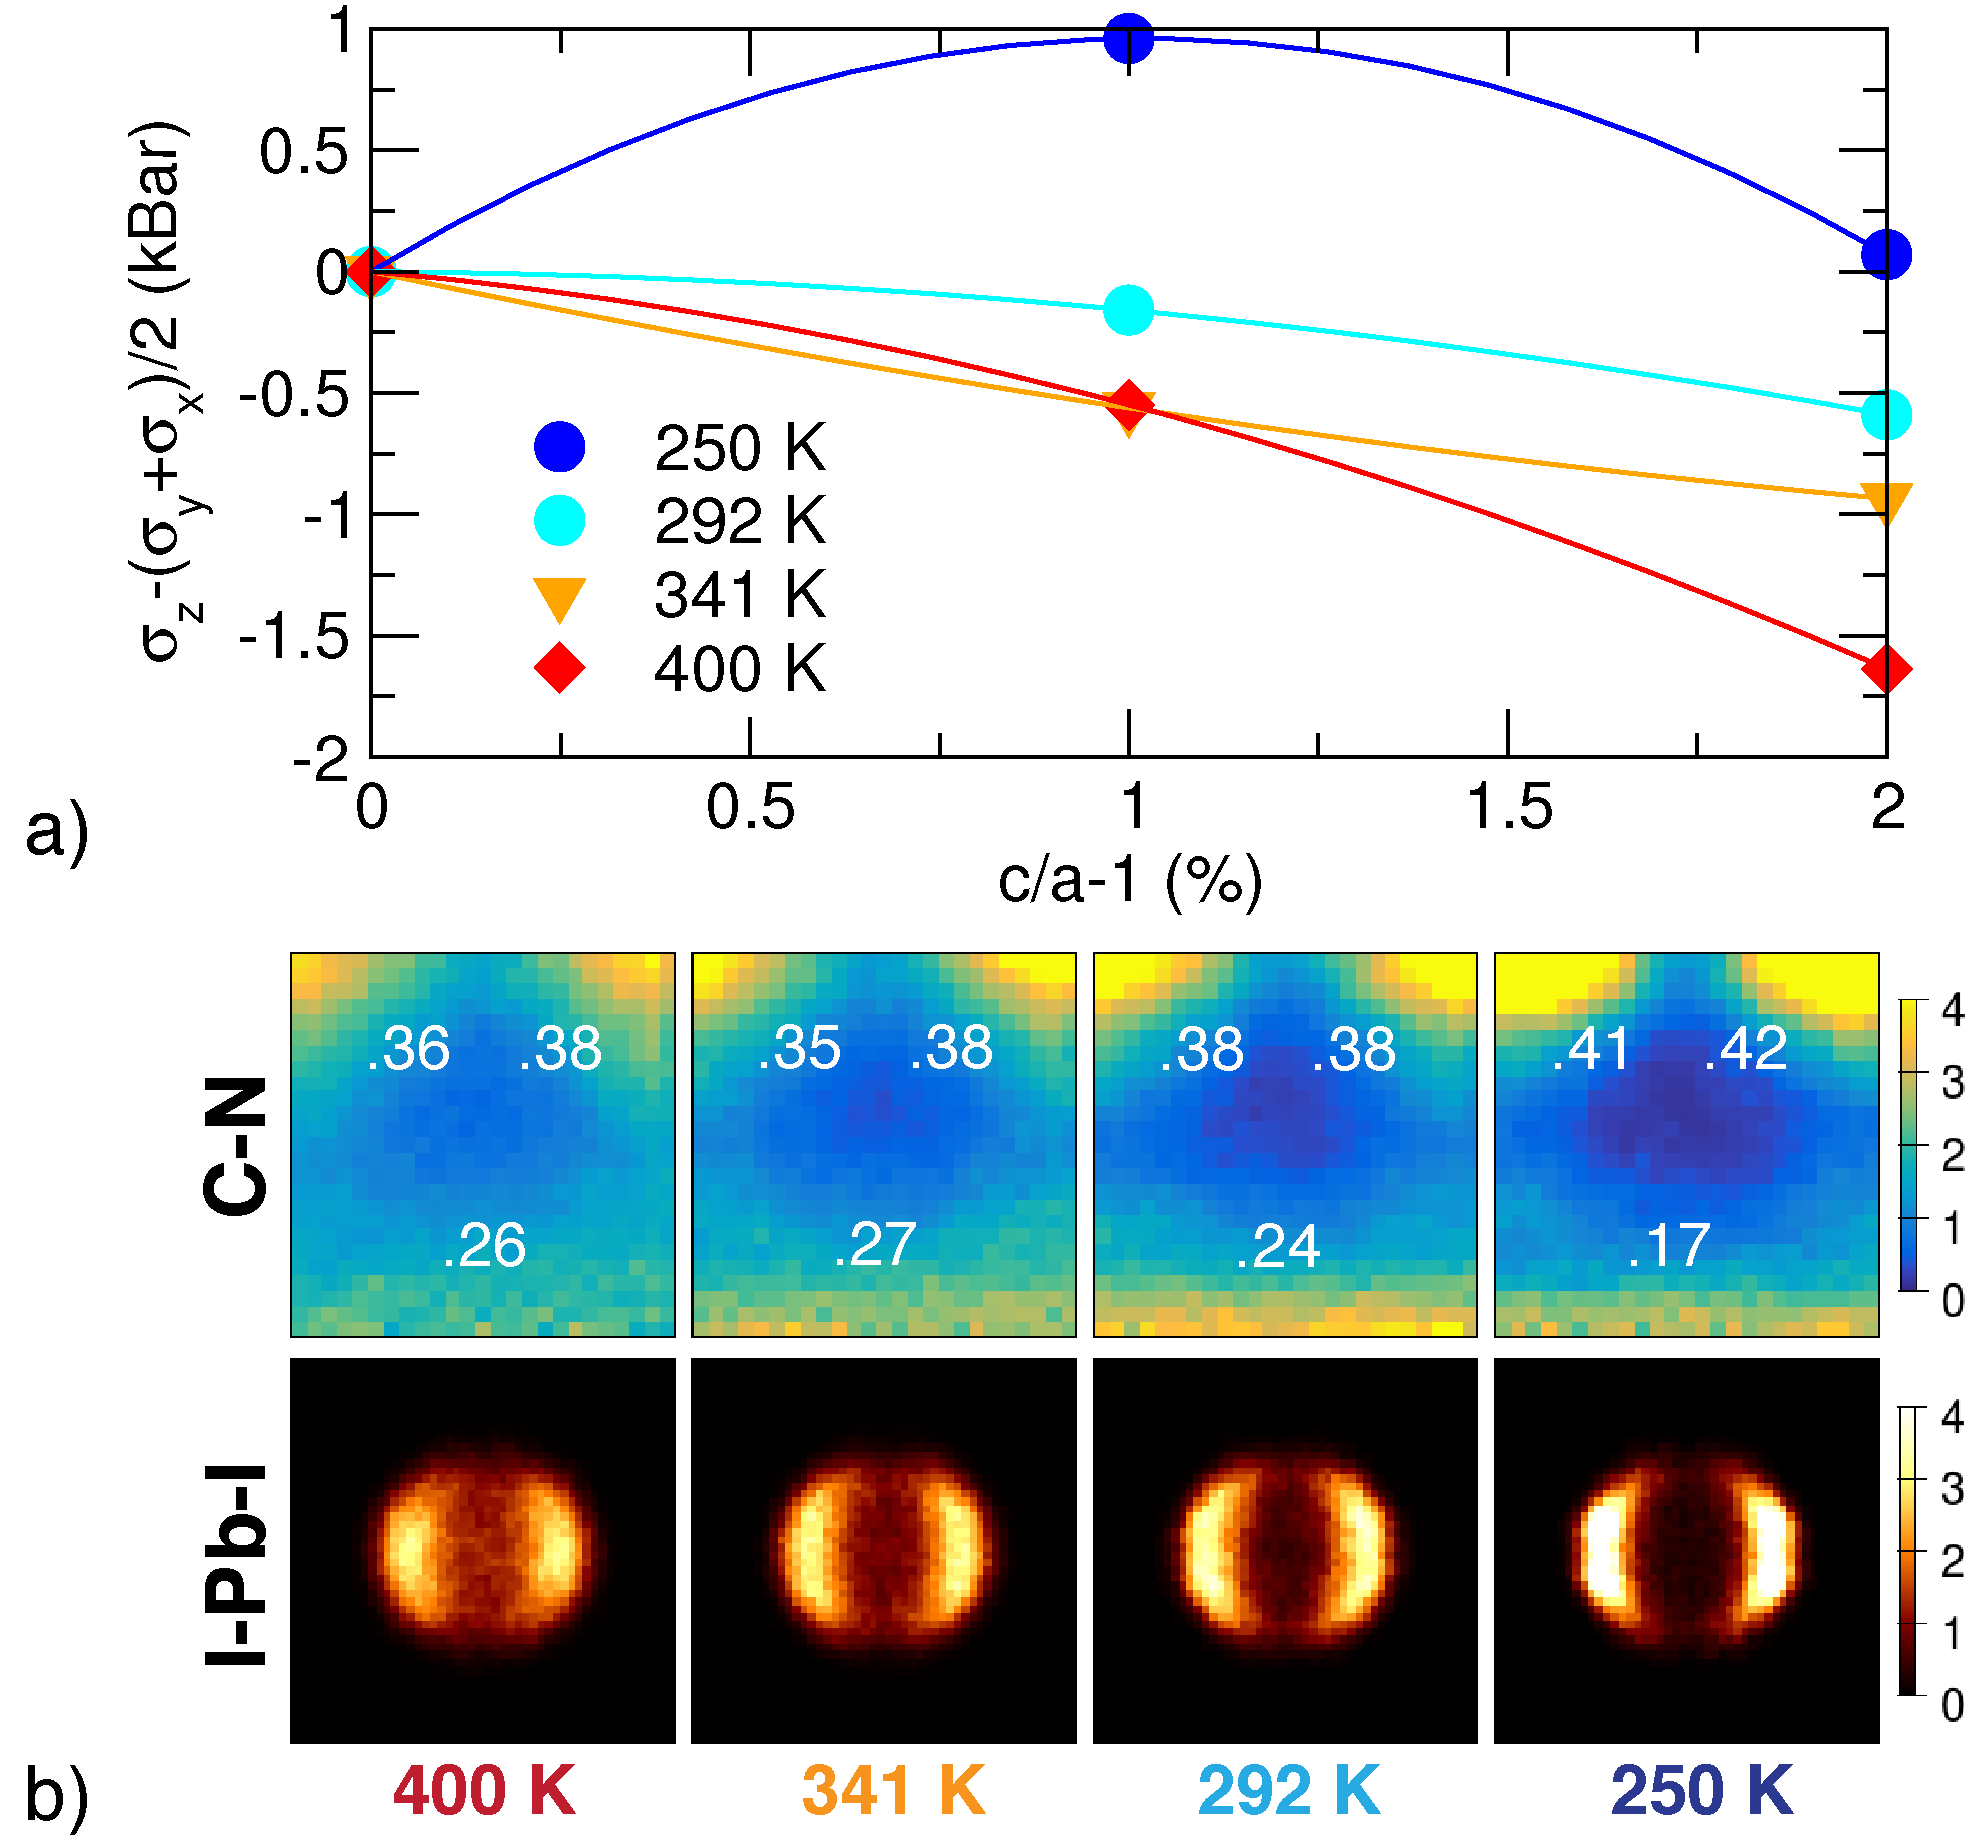
Last, we use the SCAN functional to study the tetragonal distortion () that is experimentally observed up to and about room temperatureWhitfield et al. (2016). To show that this distortion is preferred at low temperatures, we performed parallel tempering MD simulations for different ratios at a fixed volume (Å3 per formula unit) and calculate the average stress tensor . The results are shown in 3 a). For a stable cubic structure, one would expect that, as one elongates the cell in direction at fixed volume, a restoring stress opposing the distortion should develop (). However, at the lowest temperature and , the MD suggests that even further expanding into the direction is preferable, reaching a stable point at . Even at T=292 K the system is soft, with a very small restoring stress that grows roughly quadratic with displacement. The conventional linear elastic behavior is only observed at higher temperatures. In agreement with experiment we therefore predict a tetragonal instability at low temperatures. Considering the small supercell, one certainly cannot expect perfect agreement with experiment for the transition temperature or ratio. We note that the PBEsol functional, the only other functional we tested, does not yield a similar instability.
To study the origin of the distortion, Fig. 3 b) shows the polar distributions of the MA molecules and the PbI octahedra. In the tetragonal cell, the SCAN functional aligns the molecules along the principle axes. The fraction of the molecules aligned along the , and axes is indicated in white. At low temperatures, the molecules prefer to lie in the () plane, which is shorter than the axis (). As the temperature rises this preference becomes less pronounced. This suggests that the molecules act like springs and contract the lattice along the direction they are aligned to. Clearly this hints at a complex interplay between cage instabilities and molecule-cage interactions.
In summary, we have presented a general and predictive scheme to determine the optimal density functional for a specific materials problem. The strategy relies on the Random Phase Approximation (RPA), which is very accurate for condensed matter systems. By creating RPA ensembles and evaluating the variance between the RPA and a selection of DFT functionals, one can choose the best functional for large scale structure predictions. This avoids the common trial and error approach where different functionals are explored until agreement with experiment is obtained. For the modeling of hybrid perovskites, the important finding of the present work is that the SCAN functional Sun et al. (2015) works best compared to the RPA. Furthermore, many vdW functionals perform disappointingly, which is in contrast to previous suggestions that vdW interactions need to be included in these materials Egger and Kronik (2014); Motta et al. (2015). We have explained this by the strong screening of the cage. From a materials point of view, our present study sheds new light on the tetragonal instability of MAPbI3 (Fig. 3). We confirm that the MA molecules are dynamically reorienting even in the tetragonal phase and show that they prefer to be aligned along the two shorter axes, and , thereby contracting the lattice along these directions.
Acknowledgement: Funding by the Austrian Science Fund (FWF): P 30316-N27 and the SFB ViCoM (F41) is gratefully acknowledged. Computations were performed on the Vienna Scientific Cluster VSC3.
References
- Hohenberg and Kohn (1964) P. Hohenberg and W. Kohn, Phys. Rev. 136, B864 (1964).
- Kohn and Sham (1965) W. Kohn and L. J. Sham, Phys. Rev. 140, A1133 (1965).
- Hedin (1965) L. Hedin, Phys. Rev. 139, A796 (1965).
- Marini et al. (2006) A. Marini, P. García-González, and A. Rubio, Phys. Rev. Lett. 96, 136404 (2006).
- Harl and Kresse (2009) J. Harl and G. Kresse, Phys. Rev. Lett. 103, 056401 (2009).
- Lebègue et al. (2010) S. Lebègue, J. Harl, T. Gould, J. G. Ángyán, G. Kresse, and J. F. Dobson, Phys. Rev. Lett. 105, 196401 (2010).
- Schimka et al. (2010) L. Schimka, J. Harl, A. Stroppa, A. Grüneis, M. Marsman, F. Mittendorfer, and G. Kresse, Nature Mater. 9, 741 (2010).
- Olsen et al. (2011) T. Olsen, J. Yan, J. J. Mortensen, and K. S. Thygesen, Phys. Rev. Lett. 107, 156401 (2011).
- Björkman et al. (2012) T. Björkman, A. Gulans, A. V. Krasheninnikov, and R. M. Nieminen, Phys. Rev. Lett. 108, 235502 (2012).
- Ren et al. (2012) X. Ren, P. Rinke, C. Joas, and M. Scheffler, J. Mater. Sci. 47, 7447 (2012).
- Schimka et al. (2013) L. Schimka, R. Gaudoin, J. Klimeš, M. Marsman, and G. Kresse, Phys. Rev. B 87, 214102 (2013).
- Macher et al. (2014) M. Macher, J. Klimeš, C. Franchini, and G. Kresse, J. Chem. Phys. 140, 084502 (2014).
- Kaltak et al. (2014) M. Kaltak, J. Klimeš, and G. Kresse, Phys. Rev. B 90, 054115 (2014).
- Perdew et al. (1996) J. P. Perdew, K. Burke, and M. Ernzerhof, Phys. Rev. Lett. 77, 3865 (1996).
- Nozières and Pines (1958) P. Nozières and D. Pines, Phys. Rev. 109, 741 (1958).
- Langreth and Perdew (1977) D. C. Langreth and J. P. Perdew, Phys. Rev. B 15, 2884 (1977).
- Miyake et al. (2002) T. Miyake, F. Aryasetiawan, T. Kotani, M. van Schilfgaarde, M. Usuda, and K. Terakura, Phys. Rev. B 66, 245103 (2002).
- Fuchs et al. (2005) M. Fuchs, Y.-M. Niquet, X. Gonze, and K. Burke, The Journal of Chemical Physics 122, 094116 (2005).
- Furche (2008) F. Furche, The Journal of Chemical Physics 129, 114105 (2008).
- Akira et al. (2009) N. Akira, T. Tetsuya, and S. Motoyuki, Chem. lett. 38, 976 (2009).
- Ramberger et al. (2017) B. Ramberger, T. Schäfer, and G. Kresse, Phys. Rev. Lett. 118, 106403 (2017).
- Dahlen et al. (2006) N. E. Dahlen, R. van Leeuwen, and U. von Barth, Phys. Rev. A 73, 012511 (2006).
- fn (1) We note that the computational complexity of RPA calculations including forces is linear in the number of k-points and cubic in the number of plane waves. This is similar to DFT, however, the prefactors are typically a factor 102 (energies) to 103 (forces) larger than for standard DFT calculations. That calculating forces is about 5-10 times more expensive than calculating total energies is related to the computational costs for evaluating the self-energy . The steep cost means that one has to restrict simulations to fairly small supercells and few k-points.
- Green et al. (2014) M. A. Green, A. Ho-Baillie, and H. J. Snaith, Nature Phot. 8, 506 (2014).
- (25) N. R. E. L. (NREL), “Research cell efficiency records,” (2016).
- Poglitsch and Weber (1987) A. Poglitsch and D. Weber, J. Chem. Phys. 87, 6373 (1987).
- Brivio et al. (2015) F. Brivio, J. M. Frost, J. M. Skelton, A. J. Jackson, O. J. Weber, M. T. Weller, A. R. Goñi, A. M. A. Leguy, P. R. F. Barnes, and A. Walsh, Phys. Rev. B 92, 144308 (2015).
- Carignano et al. (2015) M. A. Carignano, A. Kachmar, and J. Hutter, J. Phys. Chem. C 119, 8991 (2015).
- Quarti et al. (2015) C. Quarti, E. Mosconi, and F. De Angelis, Phys. Chem. Chem. Phys. 17, 9394 (2015).
- Mattoni et al. (2015) A. Mattoni, A. Filippetti, M. I. Saba, and P. Delugas, J. Phys. Chem. C 119, 17421 (2015).
- Lahnsteiner et al. (2016) J. Lahnsteiner, G. Kresse, A. Kumar, D. D. Sarma, C. Franchini, and M. Bokdam, Phys. Rev. B 94, 214114 (2016).
- Egger and Kronik (2014) D. A. Egger and L. Kronik, J. Phys. Chem. Lett. 5, 2728 (2014).
- Motta et al. (2015) C. Motta, F. El-Mellouhi, S. Kais, N. Tabet, F. Alharbi, and S. Sanvito, Nature Comm. 6, 7026 (2015).
- Kresse and Hafner (1993) G. Kresse and J. Hafner, Phys. Rev. B 47, 558 (1993).
- Kresse and Furthmüller (1996) G. Kresse and J. Furthmüller, Phys. Rev. B 54, 11169 (1996).
- Kresse and Joubert (1999) G. Kresse and D. Joubert, Phys. Rev. B 59, 1758 (1999).
- Blöchl (1994) P. E. Blöchl, Phys. Rev. B 50, 17953 (1994).
- (38) See Supplemental Material at the end of this document for a detailed description of the applied computational techniques and settings, which includes Refs. Sugita and Okamoto, 1999; Stoumpos et al., 2013.
- Sun et al. (2015) J. Sun, A. Ruzsinszky, and J. P. Perdew, Phys. Rev. Lett. 115, 036402 (2015).
- Krukau et al. (2006) A. V. Krukau, O. A. Vydrov, A. F. Izmaylov, and G. E. Scuseria, J. Chem. Phys. 125, 224106 (2006).
- Grimme et al. (2010) S. Grimme, J. Antony, S. Ehrlich, and H. Krieg, J. Chem. Phys. 132, 154104 (2010).
- Tkatchenko et al. (2012) A. Tkatchenko, R. A. DiStasio, R. Car, and M. Scheffler, Phys. Rev. Lett. 108, 236402 (2012).
- Tkatchenko and Scheffler (2009) A. Tkatchenko and M. Scheffler, Phys. Rev. Lett. 102, 073005 (2009).
- Klimeš et al. (2011) J. Klimeš, D. R. Bowler, and A. Michaelides, Phys. Rev. B 83, 195131 (2011).
- Perdew et al. (2008) J. P. Perdew, A. Ruzsinszky, G. I. Csonka, O. A. Vydrov, G. E. Scuseria, L. A. Constantin, X. Zhou, and K. Burke, Phys. Rev. Lett. 100, 136406 (2008).
- Bokdam et al. (2016) M. Bokdam, T. Sander, A. Stroppa, S. Picozzi, D. D. Sarma, C. Franchini, and G. Kresse, Sci. Rep. 6, 28618 (2016).
- Sun et al. (2016) J. Sun, R. C. Remsing, Y. Zhang, Z. Sun, A. Ruzsinszky, H. Peng, Z. Yang, A. Paul, U. Waghmare, X. Wu, M. L. Klein, and J. P. Perdew, Nature Chem. 8, 831 (2016).
- Whitfield et al. (2016) P. Whitfield, N. Herron, W. E. Guise, K. Page, Y. Q. Cheng, I. Milas, and M. K. Crawford, Sci. Rep. 6, 35685 (2016).
- Sugita and Okamoto (1999) Y. Sugita and Y. Okamoto, Chem. Phys. Lett. 314, 141 (1999).
- Stoumpos et al. (2013) C. C. Stoumpos, C. D. Malliakas, and M. G. Kanatzidis, Inorg. Chem. 52, 9019 (2013).
Appendix A Supplementary Material
A.1 Computational Details
The first principles calculations were performed using the vasp codeKresse and Hafner (1993); *Kresse:prb96; *Kresse:prb99 with a plane-wave basis and the projector augmented wave (PAW) method Blöchl (1994). Setups varied somewhat between the calculations. For the RPA and SCAN calculations, we used the following accurate potentials PbdGW, IGW, CsW, NsGW, HGW. The potentials treat the (Pb), the ls (I), (C) and (N) as valence orbitals. For most finite temperature MD’s (except those for constructing the SCAN ensemble), we used softer potentials where the electrons of Pb are frozen (specifically we used the standard Pb, I, Cs, Ns and H potentials). To cross-check the potentials, we also evaluated the variance between the accurate and soft PAW sets for PBE as well as optPBE and found small values of meV for the unit cell. For SCAN, the variance between the two PAW sets doubled, explaining why we decided to use the accurate set for the SCAN calculations. The plane-wave cut-offs were typically set to 250 eV for MD simulations using the soft set and 300 eV for MD simulations using the accurate set.
A -only Brillouin zone sampling for the unit cell yields unconverged results and inaccurate statistics for the molecular orientations Lahnsteiner et al. (2016). To obtain reasonably converged results, two k-points in the unit cell [ and the k-point ] are required, corresponding to 16 k-points in the BZ of the primitive cell. All RPA calculations and reported variances use this minimal set of k-points. For the MD’s reported in Figure 1, the k-point grid was further doubled (although this did not change the distributions noticeably).
For the MD simulations, a Langevin thermostat controls the temperature and a ”Shake and Rattle” algorithm is used to constrain all internal degrees of freedom of the molecules except for the rotation of the NH3 relative to the CH3 group over the CN bond. By applying these constraints the rapid hydrogen oscillations are removed and this allows one to increase the time step to 10 fs. Parallel Tempering Sugita and Okamoto (1999) is applied, meaning that four trajectories run in parallel at four fixed temperatures between 250 and 400 K. Using a Metropolis algorithm and the kinetic and potential energies of the instantaneous structures, temperature swaps between the trajectories are attempted about every 50 steps. This increases the sampling efficiency of the phase space, in particular, at low temperatures. To converge the polar distributions of Figure 1, a minimal trajectory of 200 ps and up to 750 ps were necessary. The reorientation times were obtained from separate fixed temperature MD trajectories with a trajectory length of 200 ps or more. The auto-correlation function was calculated and fitted to a simple exponential as described in Ref. Lahnsteiner et al., 2016. If the auto-correlation function did not go to zero, but reaches a plateau above zero, a ”-” was placed instead of a number.
All the and supercell simulations (Figures 1 and 2) were performed for pseudo-cubic supercells with lattice constants fixed to and Å, which corresponds to the typical experimental volume at 400 K Stoumpos et al. (2013). The simulations representative of the tetragonal distortion (300 K) are the only exception. Here we slightly reduced the volume to 245 Å3 per formula unit and used a supercell (Figure 3). After correcting for the Pullay stress, the pressure calculated with the SCAN functional at 292 K is zero within the statistical error bars. The macroscopic stress tensor is obtained by averaging over the elements calculated for every structure in the MD trajectory.
Variances between different exchange correlation functionals and the RPA for the RPA- and the SCAN-ensemble were always evaluated using the accurate potentials and with a cut-off at 380 eV to reduce errors related to the finite basis sets. This is higher than the suggested cut-off of 320 eV for these potentials. The Kohn-Sham orbitals have been calculated in two steps. First a standard PBE-DFT calculation is performed to obtain the charge density, hereafter an exact digitalization of the Hamiltonian is performed including as many orbitals as there are plane-waves in the basis. These orbitals are then used to calculate the exact exchange and the RPA correlation energies.
There are no D3 parameters by Grimme for the HSE hybrid functional in Ref. Grimme et al., 2010, therefore we used the scaling and damping coefficients of the PBE0 functional for the HSE+D3 calculations. The HSE is a range separated improvement of the PBE0 functional, with the same ratio of exact to PBE exchange in the sort range. Furthermore, it is exactly equivalent to PBE0 if the range separator () is set to zero.
A.2 Structures in the SCAN and PBEsol ensembles
For SCAN, 10 independent 16 ps MD simulations were performed at T= 400 K with pseudo-cubic supercells. Furthermore, we included supercells at T=273 K starting from tetragonal and orthorhombic prototype structures Lahnsteiner et al. (2016) with the same number of atoms as the cells. A total of 200 configurations were selected from these simulations and together form the SCAN-ensemble. For PBEsol, 64 configurations were picked from the parallel tempering simulation at T=400 K shown Figure 1.