00 \SetVol002017
Looking for the weak members of the C family in the interstellar medium
G a l a z u t d i n o v, G.A.Instituto de Astronomia, Universidad Catolica del Norte, Av. Angamos 0610, Antofagasta, Chile
Pulkovo Observatory, Pulkovskoe Shosse 65, Saint-Petersburg, 196140, Russia
Special Astrophysical Observatory, Nizhnij Arkhyz, 369167, Russia
e-mail: runizag@gmail.com
K r e ł o w s k i, J.,Center for Astronomy, Nicholas Copernicus University, Grudzia̧dzka 5, Pl-87-100 Toruń, Poland
e-mail: jacek@umk.pl
Month Day, Year
We demonstrate, using the high resolution spectra from the ESPADONS spectrograph, fed with the 3.6m CFH telescope, that the strength ratios of the strong–to–weak spectral features, attributed to C, are variable. We found that in the range of expected 9366 Å C feature there are two diffuse bands centered at 9362.00.1 and 9365.30.1 Å with variable intensity ratio. We confidently confirm the lack of 9428 Å feature which, in the laboratory spectra of C, is stronger than 9366 Å. The weakest laboratory feature, near 9348.4 Å remains below the level of detection in all spectra. The intensity ratio 9577/9365 is variable. These facts contradict to their common origin and so – the identification of some interstellar spectral features as being carried by the cation of the “soccer ball”. We also refined the rest wavelength position of the strongest diffuse band in this range: it is 9576.80.1 Å. ISM
1 Introduction
The recent publication of Campbell et al., (2015) re–started the discussion on whether the C (“soccer ball”) molecule may be the carrier of two pretty strong, likely interstellar bands, observed in near–infrared at 9577 and 9632 Å. For a discussion of most recent publications see Galazutdinov et al. (2017). The latter paper demonstrated that even the ratio of the two strongest features, attributed to , is variable if all possible contaminations: stellar and telluric are properly taken care of. We could not find the weak members of the laboratory spectrum family but the region is severely contaminated with telluric lines which may create doubts as to whether the identifications or lack of them is reliable.
The publication of Walker et al.(2015) states that the weak bands near 9366 and 9428 Å can be traced in the spectra of HD183143 (only 9366) and HD169454 (both). In Walker (2016) the authors reported the detection of diffuse bands 9632, 9577, 9428, 9365 and 9348 towards the stars HD 46711, HD169454, HD183143.
The aim of this paper is to check whether the above mentioned conclusions are correct, using the spectra from the same instrument and, as far as possible, of the same objects. For HD183143 and HD169454 we use the same spectra, that were anaylised by Walker et al. (2015, 2016).
2 Spectral data
We have downloaded four spectra from the ESPADONS archive; spectra of HD169454, BD +40 4220 and of CygOB2 12 were recorded in 2005 by Bernard Foing. We have also downloaded a spectrum of HD183143, recorded in 2015 by Gordon Walker. All four studied objects are substantially reddened hot supergiants (see Table 1).
Owing to the more than 4000 m altitude of the Mauna Kea Observatory, spectra of ESPADONS possess much weaker telluric lines in comparison to the UVES data we have analyzed in Galazutdinov et al. (2017), thus the range of expected weaker members of C family can be analyzed much more confidently. To remove the telluric lines we have downloaded spectra of HD120315 and HR7235 observed using the same instrument. The latter object was used as a divisor in papers by Walker et al. We found that this object shows some weak diffuse interstellar bands like 5780 and 6284 which appear in some slightly reddened spectra (Galazutdinov et al. 1998). Theoretically, similar components of bands may alter their measurements. Fortunately, HD120315 is free of any interstellar features, thus we preferred it as a divisor.
| Star | Sp/L | V | B-V | E(B-V) | 9577.0 | 9365.2 left | 9365.2 right | |||||||||
| FWHM | EW | FWHM | EW | FWHM | EW | |||||||||||
| BD +40 4220 | O7Ia | 9.13 | 1.68 | 1.97 | 200 | 9576.8 | 103 | 35262 | 9361.9 | 108 | 11320 | 9365.2 | 94 | 10131 | ||
| CygOB2 12 | B3Iae | 11.48 | 3.22 | 3.35 | 40 | 9576.8 | 98 | 41561 | 9362.2 | 113 | 10020 | 9365.2 | 90 | 9030 | ||
| HD169454 | B1Ia | 6.70 | 0.91 | 1.10 | 39 | 9577.0 | 111 | 13646 | 9361.9 | 90 | 4315 | 9365.6 | 112 | 4318 | ||
| HD183143 | B7Ia | 6.84 | 1.20 | 1.24 | 37 | 9576.7 | 96 | 33026 | 9362.1 | 85 | 306 | 9365.0 | 77 | 558 | ||
| HR7437 | B7V | 5.00 | -0.09 | 0.04 | ||||||||||||
| HD120315 | B3V | 1.87 | -0.19 | 0.00 | ||||||||||||
| Star | EW(5780) | EW(5797) | 9577/9365right | |||||||||||||
| BD +40 4220 | 75342 | 22421 | 3.491.23 | |||||||||||||
| CygOB2 12 | 930124 | 32952 | 4.611.68 | |||||||||||||
| HD169454 | 46817 | 1568 | 3.161.70 | |||||||||||||
| HD183143 | 76618 | 1958 | 6.000.99 | |||||||||||||
| HR7437 | 351 | 51 | ||||||||||||||
All measurements have been performed with the aid of DECH111http://gazinur.com/DECH-software.html code. The wavelength scale of all spectra was aligned to the interstellar rest wavelength position using the Ki 7699 and CH 4300 Å lines. The neutral potassium profile is quite narrow in all spectra, except HD183143 (Fig. 1). In the latter it is composed of two Doppler components, separated by about 14 km/s (Herbig & Soderblom 1982). It is thus the problem to which of the components the spectrum should be moved? In this paper we decided to use for this purpose the weaker Ki component as it is evidently related to the stronger CH (4300.3 Å) Doppler line. This is why our central wavelength of 9577 differs in this paper from that of Galazutdinov et al. (2017). The intensity of this band is higher in this publication because it follows the measurement in ESPADONS spectrum which allows better removal of telluric lines (the latter are less saturated). Anyway, both measurements coincide within the calculated errors.
Equivalent widths errors were estimated using the equation 7 from Vollmann & Eversberg (2006) which includes contributions from both photon noise and continuum uncertainties.
All the downloaded spectra are of very good quality, with exception in the violet range where the polarimetric equipment makes the resultant signal–to–noise ratio reasonably low. This is not important for us since we try to separate infrared interstellar spectral features from the stellar spectra, though we cannot discuss possible relations between the considered DIBs and interstellar molecules, such as CH, CH+ and CN.
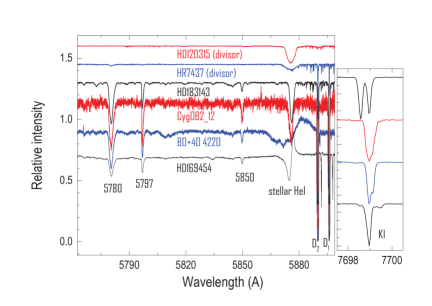
Our Fig. 1 presents the visual range of spectra of all our targets from Table 1. It is evident that the spectrum of HD120315 is completely free of any interstellar lines or bands. On the other hand the spectrum of HR7437, used as divisor in Walker et al. (2015, 2016), contains the interstellar sodium doublet as well as the weak 5780 Å DIB. The other broad DIB, 6284 Å is seen as well. Apparently the target may contain some broad interstellar spectral features (like those, attributed to ), which may introduce some uncertainties. The variable ratio of 5780/5797 DIBs demonstrates that the environments along the chosen sightlines are not of identical physical parameters. It is also clearly seen that the stellar Hei line profile is very broad and extended in the spectrum of BD +40 4220 in contrast to other objects (see the rotational velocities, listed in Table 1). This is important as interstellar features’ profiles remain the same in all heavily reddened spectra but stellar ones must be evidently different which allows to distinguish between unidentified DIBs and possible weak stellar lines.
3 Results
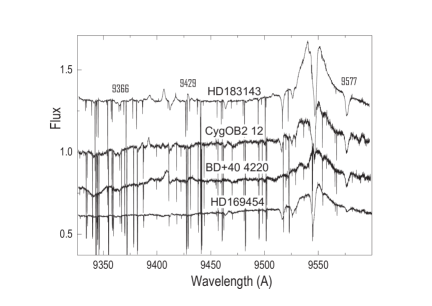
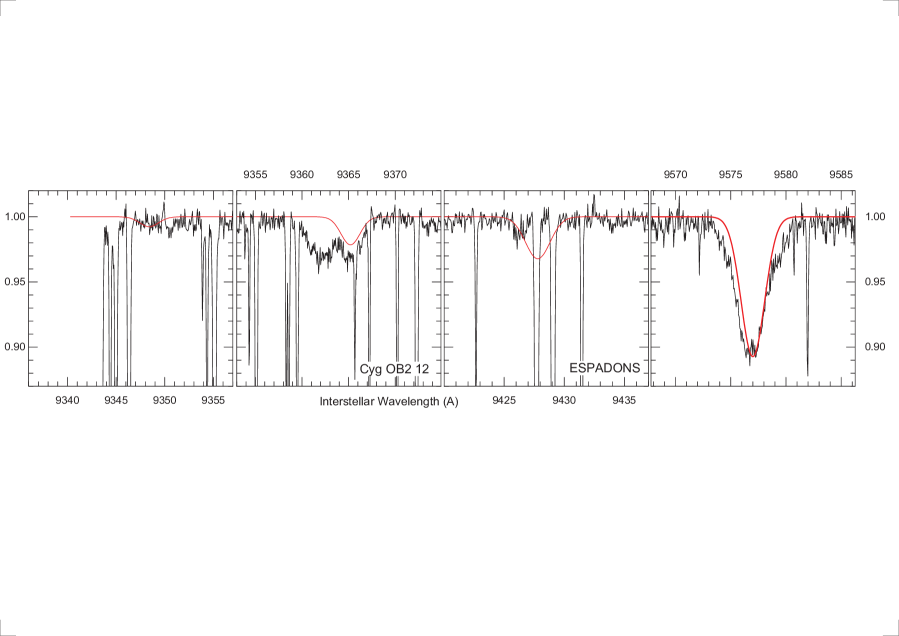
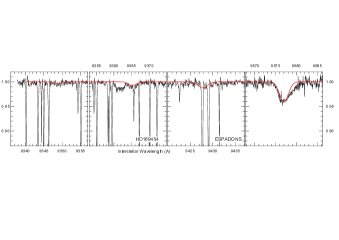
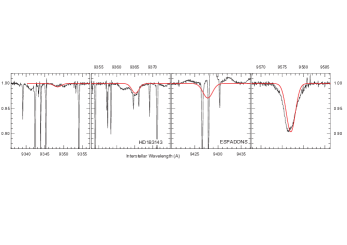
We have divided the spectra of our reddened targets by that of the selected standard. The result is shown in Fig. 2. The remnants of telluric lines are owing to the saturation of the atmospheric features. They can be easily removed manually. It is evident that the 9577 Å band, attributed to , is strong in all four spectra of reddened targets and free of even telluric remnants which makes its profile reliable. The second feature – 9428 Å is doubtful. As already described by Walker et al. (2015) the expected position of the feature coincides in HD183143 with a stellar emission. We identified it as the line of Feii. There is no emission in the spectrum of the heavily reddened CygOB2 12 but the expected interstellar feature remains below the level of detection (see Fig. 3).
The third possible feature – 9366 Å is present in all four spectra but its profile is evidently “W” shaped. This may be either due to different physical conditions of the intervening medium (if this is a single band) or due to the fact that we observe two DIBs, partially blended and of another origin. We measured it as two separate diffuse bands (Table 1). In any case this feature is much stronger than the 9428 Å one (if the latter is present at all) which is opposite to the laboratory expectations.
 |
 |
 |
 |
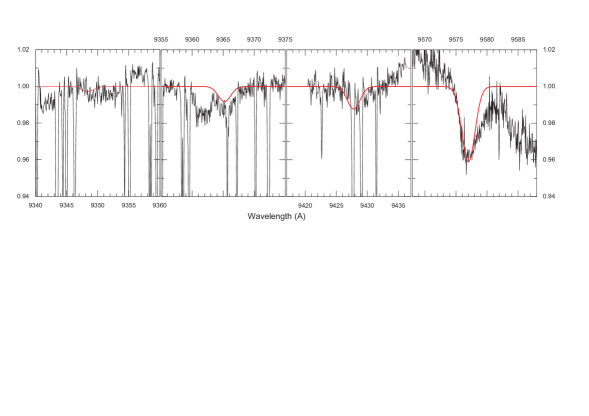
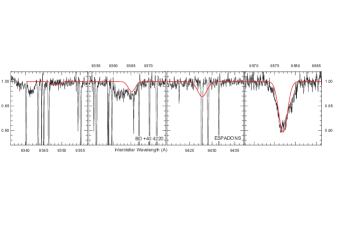
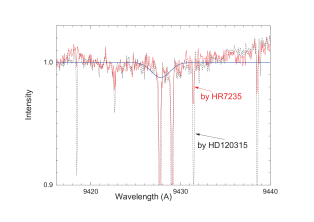
Let us emphasize that our spectrum of HD 169454 is just the same that was analyzed in Walker et al. (2016) where the authors reported the presence of DIB 9428 being about 50% stronger than the clearly seen 9366 Å one. However, in our Fig. 3, the lack of the 9428 Å feature is surprisingly evident. Note that the continuum normalization offers no difficulties for this object. Nevertheless, to avoid speculations about uncertainties introduced by this procedure, the spectrum of HD 169454 is also shown right after telluric lines removal, i.e. before the continuum normalization (Fig. 4). For clarity, each depicted fragment of the spectrum was normalized to a constant, in order of facilitating the comparison of all four studied wavelength ranges. Only the area around 9577 Å exhibits some tilt (due to broad and strong hydrogen line in the spectrum of divisor) while other areas are almost identical to those in Fig. 3 where the continuum normalization was done. Indeed, the origin of feature shown in the upper panel of Fig. 5 of Walker et al (2016). is unclear for us. It stands to mention that the use of HR7235 as a divisor (the same divisor was used in Walker et al., 2016) exhibits similar result, i.e. the DIB 9428 Å cannot be revealed (Fig. 5).
Let’s compare the discovered DIB profiles after the continuum normalization. This is demonstrated in Fig. 3 where the normalized spectra are overplotted on the laboratory spectrum model calculated according to the most recent version of C data (Campbell et al. 2016). For each target the model spectrum is normalized to the observed intensity of 9577 Å band. Thus the Fig. 3 demonstrates the relative intensities of four bands, attributed to C. The 9428 Å feature remains below the level of detection. We also measured the rest wavelengths of the considered DIBs (Table 1). Let’s emphasize also that the whole spectral range, depicted in Figs. 2 and 3, is full of weak stellar lines and it is thus difficult to separate reliably possible stellar contaminations from interstellar bands. The best argument is that all interstellar features should be of the same (more or less) profiles, doesn’t matter what’s the rotational velocity of the observed star. Stellar lines should be broadened and extended in spectra of the heavily reddened, rapidly rotating targets.
The fact that the strength ratio 9577/9366 is variable (Fig. 3, Table 1) is a strong argument against their common origin. Moreover, we are not able to detect the 9428 Å band which should be stronger than 9366 Å, according to the laboratory data. Moreover, we have to face the problem, presented already by Walker et al. (2015), i. e. that of the shape of the 9366 feature. As mentioned above, there is a possibility that we observe two DIBs, partially blended, which do not share the same carrier. Another possibility is that the carrier is centrosymmetric and one of the observed peaks is just the bandhead. This could, for example, follow higher or lower rotational temperatures of the DIB carrier, possibly correlated with that of interstellar . However, such a comparison is not possible. In BD +40 4220 the lines are single, in CygOB2 12 they show evident Doppler splitting; which of the peaks is related to DIBs? In HD183143 the is hardly detectable. It creates the question whether very complex carbon molecule can be present while the simplest one is nearly absent? Also the abundance of is at least twice as big in Cyg OB2 12 as in BD +40 4220. The ESPADONS spectra do not allow to search for the violet because of high noise level in this range. The very weak feature, seen in the laboratory spectra near 9348.4 Å remains below the level of detection in all our spectra.
The results of our measurements are given in Table 1. The 9366 Å feature was divided into two possible bands. It is interesting that even if to take into account only its stronger (in HD183143) component, it appears too strong (in relation to 9577 Å) in most of the targets if the laboratory intensities are applied. If the feature is not a blend, the EW(9366) intensity is always too high. Let’s emphasize that the 9366 Å feature is very shallow and thus its measurements – difficult, because of high noise contamination. It seems of basic importance to check the 9366/9577 relation using a statistically meaningful sample but the latter must contain heavily reddened objects as in other ones the considered features (especially 9366) are very weak and thus – their measurements uncertain.
Our very poor statistics (Table 1) allows to infer a vague conclusion that the intensities of infrared DIBs are in a way correlated with those of other DIBs. This, however, does not bring any substantial information. The sightlines to our heavily reddened targets intersect several clouds – see Fig. 1. In such a case we observe always a kind of ill–defined average and it is not astonishing that all interstellar features are in such the averages correlated.
4 Conclusions
We have concluded in the previous paper – Galazutdinov et al. (2017) – that the attribution of the two evident DIBs: 9632 Å and 9577 Å to is premature. The proper elimination of both telluric and stellar contaminations – necessary to check the rest wavelengths and strength ratios – is very difficult. In the former paper we have demonstrated that the 9632/9577 strength ratio is variable; now we show that 9577/9366 ratio is variable as well. Moreover, the expected at 9428 Å feature seems to remain below the level of reliable detection, despite the fact that we tried to find it in the spectrum of Cyg OB2 12 – the one of most heavily reddened stars ever observed in high resolution. This is another argument against as the carrier of the considered bands because the 9428 Å band should be stronger than 9366 Å according to the laboratory predictions. We were not able to detect something resembling 9366 DIB in our sample of 19 objects (Galazutdinov et al. 2017) except, very vaguely, three objects. The spectra, used in this paper allow a more precise elimination of telluric lines because the instrument is situated on a much higher elevation which makes telluric features less saturated. It should also be emphasized that the strongest 9577 band is in practically all objects broader than the laboratory band of (Fig. 3). The effect cannot be explained by the Doppler splitting as in three objects the interstellar Ki line is narrow and, even if Doppler–splitted, cannot explain the observed broadening of the feature. In general the statistics of high quality spectra of heavily reddened stars in the infrared range is poor and its extension seems to be really important. However, the probability that is present in a substantial amount in translucent interstellar clouds, being responsible for the observed features, is very low.
GAG acknowledges the support of Russian Science Foundation (project 14-50-00043, area of focus Exoplanets) for support of experimental part of this work. JK acknowledges the financial support of the Polish National Science Center during the period 2015–2017 (grant 2015/17/B/ST9/03397). This research used the facilities of the Canadian Astronomy Data Centre (ESPADONS data archive) operated by the National Research Council of Canada with the support of the Canadian Space Agency.
References
- [1] \refitemCampbell E. K., Holz M., Gerlich D. & Maier J. P.2015Nature523322 \refitemCampbell E. K., Holz M. & Maier J.P.2016ApJ826L4 \refitemGalazutdinov G.A., Shimansky V.V., Bondar A., Valyavin G. & Krełowski J.2017MNRAS4653956 \refitemGalazutdinov G.A., Krełowski J., Moutou C. & Musaev F.A.1998MNRAS295437 \refitemHerbig G.H. & Soderblom D.R.1982ApJ252610 \refitemVollmann, K., Eversberg, T. 2006 Astron. Nachr. 327 862 \refitemWalker G.A.H., Bohlender D.A., Maier J.P. & Campbell E.K.2015ApJ8128 \refitemWalker G.A.H., Campbell E.K., Maier J.P., Bohlender D., and Malo L.2016ApJ831130
- [2]