Highly Confined Stacks of Graphene Oxide Sheets in Water
Abstract
Since the discovery of graphene oxide (GO), the most accessible of the precursors of graphene, this material has been widely studied for applications in science and technology. In this work, we describe a procedure to obtain GO dispersions in water at high concentrations, these highly dehydrated dispersions being in addition fully redispersible by dilution. With the availability of such concentrated samples, it was possible to investigate the structure of hydrated GO sheets in a previously unexplored range of concentrations, and to evidence a structural phase transition. Tentatively applying models designed for describing the small-angle scattering curve in the Smectic A (or Lα) phase of lyotropic systems, it was possible to extract elastic parameters characterising the system on the dilute side of the transition, thereby evidencing the relevance of both electrostatic and steric (Helfrich) interactions in stabilising aqueous lamellar stacks of GO sheets.
1 Introduction
Graphene oxide (GO) is a material obtained by mild oxidation and exfoliation of graphite, and one of the most common manner of preparing it is Hummer’s modified method hummers ; synthesis . This material is attracting a lot of interest, in particular because it can easily be dispersed in various solvents, including water, and many GO-based materials and composites have been developed by solution processing Behabtu2010 ; Kim2011 ; Bisoyi2011 ; XuGao2011_2 ; Frost2012 ; Kim2012 .
The structure of GO sheets, as well as their structural organisation in water have been investigated using various techniques, including atomic force microscopy (AFM), polarised optical microscopy (POM), circular dichroism (CD) and small-angle x-ray scattering (SAXS)–see for instance Kim2011 ; XuGao2011_1 ; Aboutalebi2011 ; Dan2011 ; XuGao2011_2 ; Zamora-Ledezma2012 ; Cao2013 ; DiMauro2016 . Most of these works–either directly (AFM) or indirectly (SAXS)–points to an atomic thickness for the GO sheet, significantly below nm (assuming for the GO density a value around g/cm3 in the SAXS-based method). Furthermore, it is now a consensus from POM and SAXS studies that the phase diagram of the lyotropic GO–water dispersion exhibits isotropic, nematic and lamellar (or lamellar-like) phases, phase transitions being driven by the increase of GO concentration in the dispersion, as also observed in somehow similar materials made of planar, solid-like sheets of near-atomic thickness Gabriel2001 ; Michot2006 –or a bit thicker Kleshchanok2012 .
In qualitative accordance with Onsager’s theory for the isotropic-to-nematic phase transition in suspensions of hard colloids, quantitatively valid for slender particles Onsager1949 , the particle volume fraction at the transition onset is given in numerical simulations for “pancake” particles by Frenkel1982 ; Cinacchi2014 ; Cinacchi2015
| (1) |
in terms of the particle aspect ratio . Equation (1) describes reasonably well the mass fraction of GO when birefringence first occurs (viz. when the nematic phase first appears) using , considering the dispersity Đ in lateral extensions Kooij1998 ; Bates1999 , as well as uncertainties in GO thickness and density . Such an agreement is considered as a convincing argument for the GO sheets being rigid enough to remain essentially uncrumpled in dilute suspensions Kim2011 ; XuGao2011_2 .
Structures commonly described as lamellar are observed in more concentrated GO dispersions, as mainly results from SAXS studies XuGao2011_1 ; XuGao2011_2 ; Zamora-Ledezma2012 ; Xu2014 , a behaviour also found in similar (inorganic) materials such as phosphatoantimonates, clays or titanium-iron acid oxides Gabriel2001 ; Michot2006 ; Kleshchanok2012 ; Geng2013 . The structure (sometimes depicted more cautiously as a nematic gel, a locally layered system, or a pseudo-smectic phase because compelling evidence for positional long-range order is not easily found) is formed by stacking GO sheets (or other kinds of solid-like sheets), separated by layers of water, with a given distance of repetition of the unit cell along the stacking axis . In the plane perpendicular to , the structure of the two-dimensional solid-like sheet is well-defined locally, but more difficult to ascertain at scales larger than . Owing to the repulsive interaction along between two facing sheets, with a significant electrostatic contribution according to refs. Gabriel2001 ; Michot2006 ; XuGao2011_2 , the thickness of the water layers increases, with therefore an increase in , when (low ionic strength) water is added to the system. In a geometric description of the swelling process where and is a constant, a simple dilution law, namely
| (2) |
is expected and indeed observed, as in refs. XuGao2011_2 ; Zamora-Ledezma2012 , at least for a restricted range of particle volume fractions , see Gabriel2001 ; Michot2006 . The dilution law, eq. (2), yields the above-mentioned SAXS (indirect) estimate for the GO sheet thickness .
One of the purpose of the present contribution is to explore the validity of eq. (2) towards more concentrated GO dispersions than previously investigated. In the next sections, we describe how our samples are characterised using dynamic light (sect. 2.1) or small-angle x-ray (sect. 2.3) scattering techniques, and dehydrated in a controlled way to almost complete dryness while remaining fully redispersible in water (sect. 2.2). Our main results are summarised in sect. 3.1, with evidences for a structural phase transition between lamellar structures, not reported previously, as dehydration proceeds. In sect. 3.2, we discuss possible mechanisms stabilising in water the lamellar stacks of GO sheets, drawing an analogy with lamellar stacks of self-assembled amphiphilic bilayers. Though we give no clues as regards the most concentrated regime, the lamellar stack of GO sheets appears to be well described in the dilute regime by the so-called “unbinding transition” phenomenon that results from repulsive Helfrich Helfrich1978 and electrostatic interactions between stacked layers competing with attractive van der Waals interactions Lipowski1986 ; Milner1992 .
2 Materials and methods
2.1 Sample characterisation
The graphene oxide suspensions are prepared from a commercial aqueous solution sold by Graphenea (San Sebastian, Spain), with nominal concentration 4 mg/mL. Such a solution is concentrated enough to be birefringent, as revealed by POM, but does not yet exhibit any significant increase in viscosity compared to water. According to the producer, the dispersion presents more than 95 % of carbon monolayers and an amount between 41 and 50% of oxygen atoms, with variable sheet dimensions below 10 m, usually around 1–2 m graphenea . Owing to the presence of COOH groups attached to the sheet surface, the aqueous GO suspensions are expected to be acid and, indeed, their measured H is about 2.4. Two different batches were bought and used to prepare the samples. For both batches, dynamic light scattering (DLS) experiments were carried out, using a research goniometer and laser light scattering system from Brookhaven Instruments Corporation (Holtsville, NY, USA). Freshly prepared samples were diluted in water to 0.04 mg/mL. At such a concentration, the samples are no longer birefringent but faint depolarised fluctuations can be observed by POM in an optically thick ( mm) cell from VitroCom (Mountain Lakes, NJ, USA). The DLS experiment is performed with incident light polarised perpendicular to the scattering plane, without analysing the polarisation of the scattered signal. DLS experiments have been repeated from time to time on ageing samples prepared with the first batch along a total period of about 2 months in an attempt to characterise ageing, if any. Some representative results on freshly prepared samples are shown in fig. 1.
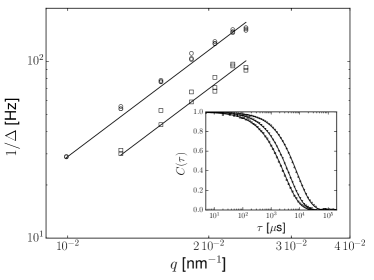
Fitting the DLS data to a stretched exponential model, see eq. 3, as a convenient (but ad hoc) way to somehow take into account the GO dispersity, two parameters (a characteristic time and a stretching exponent) were obtained as a function of the scattering wave vector .
The model correlation function is expressed as
| (3) |
where is the characteristic relaxation time and the stretching exponent. Parameter was found to decrease from ca. 0.9 to 0.7 as the scattering vector increases from ca. 1 to 2.2 nm-1. Besides, as illustrated in fig. 1 by the straight lines with a slope 2, the relaxation frequency is proportional to , meaning that an effective diffusion coefficient–or a hydrodynamic radius –can be defined. From the standard Stokes-Einstein relation
| (4) |
with the Boltzmann constant, the absolute temperature of the GO dispersion and the solvent viscosity, hydrodynamic radii were found equal to 0.74 m and 1.22 m for batches 1 and 2, respectively.
As mentioned above, possible effects of ageing were checked on samples prepared from the first batch, with three distinct histories:
-
1.
Samples were diluted to the concentration appropriate for DLS (ca. 0.04 mg/mL) immediately after receiving the solution from Graphenea, then stored for ageing;
-
2.
Samples were diluted to the concentration appropriate for DLS from the solution stored for ageing received from the manufacturer;
-
3.
Samples concentrated to mg/mL immediately after reception of the Graphenea solution (see below, sect. 2.2, for details regarding the concentration procedure) were stored for ageing, then diluted to the concentration appropriate for DLS.
Whatever the sample history, the storage conditions were the same, namely stable temperature (22∘C) and no exposure to direct light. In all cases, DLS did not reveal any significant ageing over a period of about 2 months.
2.2 Sample preparation
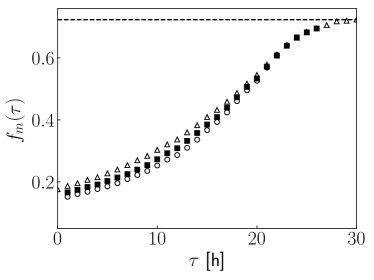
A procedure to increase the concentration of the commercial GO dispersions was implemented, requiring two steps. Centrifugation and ultracentrifugation are used in the first step. The commercial dispersion is first centrifuged for about 20 min at 1400, in order to remove “large” aggregates from the sample. After discarding the bottom phase, the supernatant is then ultracentrifuged at a much higher speed (302000) for 5 h. The recovered supernatant, mostly water at H=2.6, occupying almost the total volume of the centrifuge cell, is also discarded. The remaining phase appears as a highly viscous material with a dark, almost black colour. As explained below–see also fig. 2–, it turns out that the GO mass fraction achieved at this stage is around 0.16, thus corresponding to an increase in GO concentration by a factor about 40. We have checked that increasing the duration of the ultracentifugation procedure does not significantly increase , while decreasing it below ca. 3 h does not lead to concentrated enough dispersions.
After a period of about one week left for homogenisation in a closed container–required because the presence of small and uncontrolled amounts of water at the surface of the concentrated dispersion cannot be avoided when recovering the pellet from the centrifuge cell–the second step begins. A home-designed device is set up to slowly evaporate at room temperature the aqueous solvent from samples. It consists in a diaphragm pump connected to a desiccator where a dozen of (open) Eppendorfs containing the desired material are stored, with a pressure control system maintaining 300 mbar inside the vacuum chamber.
Figure 2 shows the evolution in time of the GO mass fraction for three dispersions resulting from the first, centrifugation-based step. As it appeared retrospectively, they differed by their initial mass fractions. The mass fraction ( when dehydration begins in the vacuum chamber) is determined, indeed, by weighing the sample at time , which obviously requires opening the vacuum chamber. The measured mass is . The clock is stopped (and the Eppendorfs closed) for the duration of the weighing operations, with an optional (mild) shaking intended to re-homogenise samples visually displaying drier patches. The same procedure is repeated at regular intervals of, typically, 1 h (in “vacuum times”, i.e. subtracting the ’s from the actually elapsed time). It has been observed that for h the mass does not decrease any more, and keeps a constant value . We have checked on a few sacrificial samples, submitted to a somehow stronger vacuum (pressure in the mbar range) for about 15 h, that remaining water cannot be extracted with our set-up: Achieving complete dehydration would require ultra-vacuum or elevated temperatures Scholz1969 ; Lerf2006 ; Rouziere2017 . On the basis of our x-ray measurements (see below, Section 3.1), we estimate the weight fraction of “bound” water from Ref. Scholz1969 to be %, with therefore .
Notably–and similarly to the first step–, the second step of the dehydration procedure is reversible. As shown by SAXS (see below, sect. 3), adding water to a sample extracted at time from the desiccator in the required amounts to mimic the composition of a sample stored for a lesser time leads to essentially identical diffractograms for the “wet” and “dried-rehydrated” samples when they both originate from the same centrifuged material. At contrast with what has been observed with, e.g., freeze-dried GO dispersions where the GO chemical structure is strongly affected Ham2014 , it seems to be preserved in our case as no aggregates were found in the slowly dried samples redispersed in water.
2.3 Experimental techniques
Samples removed at time from the desiccator were left for at least a week in their (now closed) preparation Eppendorfs to ensure relaxation of possible humidity gradients. After homogenisation, the samples were analysed by POM. Due to their extreme opacity when exceeds 50%, highly dehydrated samples could not be successfully observed. For samples with smaller mass fractions, images were recorded (data not shown) using an Olympus BX 51 microscope with crossed polarisers and a objective. The samples were sandwiched between a glass slide and a cover-slip, without special precautions for ensuring a constant optical path, estimated below 10 m, but preventing water evaporation by means of a UV-curing glue. Birefringence was always observed, indicating a liquid-crystalline organisation. The samples were homogeneous, as revealed by observing them without the analyser, indicating that aggregates were not present. The samples were also investigated by small angle x-ray scattering. The thick pastes were spread on a circular (diameter 1.3 mm), machine-drilled opening perpendicular to the long axis of cylindrical stainless steel supports (2.020.0 mm) which were then introduced in quartz capillaries with a nominal diameter of 2.5 mm. The spreading procedure did not allow a control of the optical path better than %. The quartz capillaries were further flame-sealed, to ensure tightness. Diffractograms were recorded on a Bruker-AXS Nanostar machine equipped with a Hi-Star detector, also from Bruker (Karlsruhe, Germany). From the entrance pinhole to the beryllium window in front of the detector, the whole flight path is evacuated. A crossed-coupled pair of Göbel mirrors (Bruker) selects the Å radiation of a copper source (Siemens), operated at 40 kV and 35 mA. A 3-pinhole system is used for collimating the incident beam, with a size (FWHM) at sample position ca. 0.43 mm in both vertical and horizontal directions. Two sample-to-detector distances, found close to 0.25 m and 1.05 m respectively, calibrated using silver behenate as standard Huang1993 , were used to match the variable stacking periods of the samples. From the Gaussian width of the first order Bragg peak of silver behenate, we estimate a resolution width (FWHM) Å-1 or Å-1 for the two configurations, respectively. Owing to the intrinsic broadening of silver behenate Huang1993 , the latter value could be slightly over-estimated. The scattering wave vectors that are practically accessible after subtracting the signal of a reference (water) capillary range from 0.04 Å-1 to 0.8 Å-1 in the “large-angle” configuration, and from 0.01 Å-1 to 0.2 Å-1 in the “small-angle” one. For accessing to even higher scattering wave vector values (typically 0.5–3.3 Å-1), as required to assess the in-plane order of the GO sheets, we use a custom-made instrument with a copper rotating-anode-based setup and crossed-coupled pair of Göbel mirrors, both from Rigaku (Tokyo, Japan), a 3-pinhole collimation system similar to the Bruker one and a mar345 image plate detector (marXperts, Norderstedt, Germany) with sample-to-detector distance 0.15 m. At contrast with the Bruker system, only the collimation flight path is evacuated. Acquisition times on the instruments were in the order of 5 hours (Bruker Nanostar) or 1 hour (custom instrument). Temperature, fixed at 20∘C, is controlled to within C by a water circulation system (Bruker Nanostar) or, with a lesser precision, by the air-conditioning system of the room (custom instrument). For both instruments, the 2D detector images were most often characteristic of slightly oriented samples, as previously observed XuGao2011_2 ; Zamora-Ledezma2012 , presumably because of the shear applied when filling the x-ray capillaries, or spreading the thick samples on the circular opening of the sample holders. Data was therefore azimuthally averaged to yield (normalised) intensities vs. scattering wave vector curves.
3 Experimental results and discussion
3.1 Results
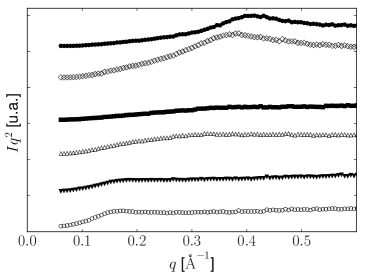
SAXS results (“small” and “large” angle configurations) for ten selected samples are shown for illustration in fig. 3, in the Kratky representation that factorises out the characteristic intensity decrease of very extended, thin and flat particles with random orientations bookKratkyPorod1949 .
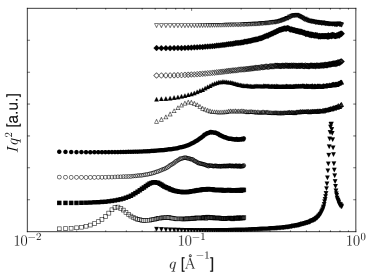
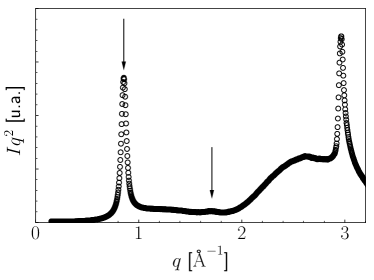
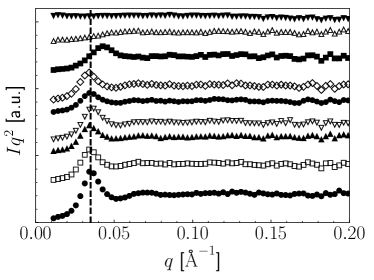
The observed peak, characteristic of the lamellar stacking, moves towards higher scattering wave vector as dehydration proceeds. The second order peak, though clearly observed in either the “small” or “large” angle configurations for the two more hydrated samples in the corresponding series (GO mass fractions 0.04 and 0.07, or 0.12 and 0.16, respectively), barely appears in the “large” angle configuration for the other samples–even though it still falls within the observation window. Nevertheless, as shown in fig. 4 with an observation window extending to much larger scattering wave vector values, the second order Bragg peak of the lamellar stacking, though weak, is clearly observed in one of the most dehydrated sample ().
As a matter of fact, upon increasing the GO content up to , the intensity ratio between the second and first order peaks decreases until the second order peak apparently disappears, to be unambiguously recovered when reaches ca. 0.29. In this concentration range, the first order peak is also significantly broadened–see fig. 5.
Such features of the SAXS diffractograms may point to a structural phase transition. It is, however, not evidenced in the POM observations. We return to this intriguing point immediately below.
From Bragg’s law, namely , it is found that, as expected, the period of the lamellar stack decreases when water is removed from the structure. The experimental dilution law , with volume fractions derived from mass fractions through the relation
| (5) |
(assuming volume additivity) is shown in fig. 6.
A striking discontinuous behaviour near ( close to 0.23) is clearly observed in the dehydrated limit of the dilution line. Besides, the discontinuity is precisely found to occur in the hydration range where broadening of the first order peak, as well as the disappearance of the second order peak have been observed, hinting again at the occurrence of a structural phase transition. Still, as evidenced in the inset to fig. 6 where SAXS data from samples submitted to the first concentration step (sect. 2.2)–some of them re-diluted–or only mildly dehydrated in the second step has been included, our data remains broadly compatible with the simple swelling law, eq. (2). This latter observation is nicely in agreement with the findings of previous studies, limited then to significantly more dilute GO dispersions XuGao2011_2 ; Zamora-Ledezma2012 than investigated here. The fit to the dilution data leads to a sheet thickness nm, a value close to, yet slightly lower than the value found in ref. Zamora-Ledezma2012 . The structural phase transition, if any, does therefore not strongly weakens the relevance of the simple geometric arguments at the origin of the simple swelling law.
As shown for illustration in fig. 4 corresponding to our dryiest sample (), the expected locally planar hexagonal structure of the carbon atoms in the graphene layers is observed using x-ray scattering at large angles. The peak found for 2.964 Å-1 can be related to the C–C nearest-neighbour distance in a given graphene layer using , which indeed yields a result (1.41 Å) close to the commonly accepted value ÅStructureGraphite . The same result is found for more hydrated samples, as long as there is enough signal for this peak to emerge from the background.
Two peaks (locations and 1.71 Å-1, close to ) can be found in the lower -range part of fig. 4. They are related to the lamellar stacking order of the GO sheets. The corresponding periodicity, about 0.74 nm, is ca. higher than the geometric parameter nm found in fitting the simple dilution law to the whole set of SAXS data, that is to say about twice higher than the interlayer distance in graphite StructureGraphite . This result is to be attributed to the water molecules remaining trapped between the GO sheets, about 46% in volume fraction from eq. (2), a value found in rather reasonable agreement with eq. (5), leading to .
3.2 Discussion
Despite a possible structural transition, occurring near and remaining to be characterised in details, it appears that GO aqueous dispersions exhibit a lamellar order over a quite extended concentration range, with a stacking period varying from about 0.8 nm in the dryiest available system to more than 45 nm in our most hydrated samples. It is worth noting here that periods as large as nm have even been found in other studies XuGao2011_2 . The physical mechanism stabilising the lamellar structure for vastly different water contents is therefore of obvious interest.
In the so-called lyotropic lamellar phases (self-assembled bilayers of surfactant or lipid molecules separated by layers of solvent, or solvent-swollen block-copolymer systems), a similar swelling of the lamellar structure over very extended composition ranges is also commonly observed Larche1986 ; Safinya1986 ; Strey1990 ; Freyssingeas1997 ; Ito2015 ; Uchida2016 . It is similarly present in systems structurally similar to GO, viz. based on extended solid-like sheets–phosphatoantimonate, for instance Gabriel2001 , or clay-based systems Michot2006 –dispersed in aqueous solutions. Such a swelling is commonly attributed to long-range, either direct or effective, repulsive interactions between the stacked sheets, acting across the solvent layers and of electrostatic origin, or resulting from the “undulation interaction” mechanism proposed by Helfrich Helfrich1978 .
In the case of GO aqueous dispersions, the two mechanisms have already been identified XuGao2011_2 ; Poulin2016 , at least indirectly in the case of Helfrich’s mechanism Poulin2016 . An electrostatic contribution is clearly evidenced when experimentally studying the swelling properties in the presence of added salts (in order to vary the ionic strength of the aqueous solvent layers). Using NaCl as a typical univalent salt in the (nominal) concentration range – M, the same effect as described in ref. XuGao2011_2 is observed here, namely a decreasing stacking period with increasing salt content above a -dependent salt concentration .
Indeed, as shown in fig. 7, up to the salt concentration (found about M for ), the first order Bragg peak position does not significantly change, and the overall appearance of the SAXS spectra remains the same. Conversely, the stacking period decreases and, simultaneously, the first order Bragg peak broadens, then becomes barely noticeable as the salt concentration increases above . Repeating the experiment at a different value for the GO mass fraction () yields qualitatively similar observations (data not shown), with however a significant decrease in the value (about M) for .
Regarding now “undulation interactions”, results have been interpreted in recent rheoSAXS experiments by introducing a bending modulus for GO layers in the order of , that is to say “superflexible” sheets Poulin2016 . Such a low value suggests quite strong steric repulsions between adjacent GO layers, owing to the confinement of undulation fluctuations. This would nicely explain the conspicuous swelling properties of the system and, in particular, the salt effect mentioned above. Indeed, as has been firmly established since Helfrich’s seminal article Helfrich1978 , swelling properties in lamellar stacks of flexible sheets result from a competition between, on one hand, the “unbinding” tendency of undulation fluctuations and, on the other hand, direct sheet–sheet interactions that may favour “bound” systems if attractive enough Lipowski1986 ; Milner1992 . An illustration may be found in a recent study of lamellar stacks of lipid bilayers Bougis2015 ; LeiteRubim2016 ; Bougis2016 , where the delicate interplay between “unbinding” tendencies and interactions favouring “bound” systems was varied by controlling the bilayer molecular composition. This amounted to varying simultaneously the bending modulus (“unbinding” tendencies) and the virial coefficient that encapsulates in the model the effect of interactions Milner1992 ; Bougis2015 ; LeiteRubim2016 ; Bougis2016 , in a way somehow similar to the theoretical approach to the lamellar–lamellar phase coexistence proposed in ref. Noro1999 .
As regards the salt effect on GO stacks, interpretations may be simpler than in refs. LeiteRubim2016 ; Bougis2016 , at least if it is safe to assume that the main effect of salt (screening electrostatic repulsive interactions through the decrease of the Debye screening length) falls upon the parameter only, being therefore unaffected. In such a simple limit, the Milner–Roux virial coefficient should be a monotonously increasing function of , since van der Waals attractions between GO sheets would be less and less counterbalanced by electrostatic repulsions Milner1992 , as classically described for colloidal particles in the DLVO theory ninham1999 . The thermodynamic analysis of the unbinding transition then leads to a (schematic) phase diagram, displayed in the (, )-plane in fig. 8, following refs. Milner1992 ; Nallet2017 .
The general features of the phase diagram are in qualitative agreement with available observations. As long as the salt concentration is low enough, interactions between GO sheets are essentially repulsive, should remain “small” (possibly negative) and the system is homogeneous–blank region in fig. 8. In this case, for any given , cannot depend on and obtains according to eq. (2) as . However, when increases above a threshold concentration , van der Waals attractions start being dominant in the sense that the virial coefficient becomes larger than the swelling limit line drawn in fig. 8. For the same given overall composition , the swollen stack of GO sheets phase-separates, part of the volume being filled with pure solvent (), a more concentrated GO–solvent system with occupying the remaining volume–left- and right-end of dashed binodals in fig. 8. Since remains equal to in the swollen stack, the observed stacking period starts decreasing. Because the swelling limit line in fig. 8 increases with , the phase separation phenomenon occurs earlier (i.e. for a lower salt content) if the lamellar stack is initially more dilute.
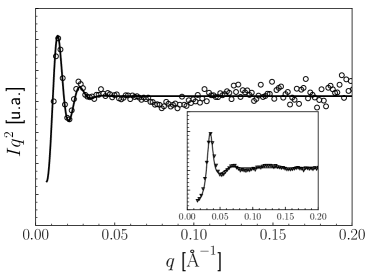
To proceed further in quantitative terms, it would be desirable to directly measure the properties controlling the swelling behaviour in GO stacks, viz. the bending modulus of the GO sheet and the sheet–sheet interaction potential or, at least, the Milner–Roux virial coefficient Milner1992 , in particular as a function of . As an intermediate step before reaching this ultimate goal, we propose below a method (based upon a model description of the small-angle x-ray–or neutron–diffractograms) for estimating the Caillé exponent . This parameter was originally introduced for describing elastic fluctuations in smectic A liquid crystals Caille1972 ; Gunther1980 ; Gennes1993 and is related to both smectic layer flexibility and interactions. It also proved useful in interpreting characteristic features of diffractograms of lyotropic lamellar Lα phases see, e.g., Safinya1986 ; artNallet93 ; Zhang1994 ; Bougis2015 , as well as of GO stacks XuGao2011_2 .
The intensity of the radiation scattered by unoriented (“powder”) lamellar samples can be shown to a good approximation to be proportional to the product of two main terms bookKratkyPorod1949 ; artNallet93
| (6) |
where and are, respectively, the form and structure factors, accounting for the scattering along their normal by isolated flat “particles” and, along the stacking axis, by a 1D periodic structure. In eq. (6), is the magnitude of the scattering wave vector and is a normalising constant that depends on “particle”–solvent contrast, composition, etc. The term accounts at large enough wave vectors for the powder average bookKratkyPorod1949 , and can also be considered as the “particle” in-plane form factor artNallet93 .
With the further simplification of considering the GO sheets as zero-thickness “particles”, the form factor no longer depends on and remains equal to 1, an acceptable approximation in the investigated SAXS range. On the other hand, the structure factor is conveniently expressed as results from the following equations (7) and (8)
| (7) |
| (8) |
where is the number of correlated GO sheets in the lamellar stack, the period of the structure, the Gaussian width of the resolution (or FWHM), and the value of Euler’s constant artNallet93 . Note that owing to the logarithmic term in eq. (8), characteristic of the anomalous fluctuation properties in one-dimensional systems Caille1972 ; Gunther1980 ; Gennes1993 , the structure factor given in eq. (7) differs essentially from the results relevant for the so-called disorders of the first or second kinds, or para-crystalline theory–see, e.g., Shibayama1986 ; Zhang1994 .
The model, though being somehow equivocal because the resolution of our experiment is limited, the distinction between (small) and (large) roles therefore becoming less clear-cut in some cases, has nevertheless been used to tentatively describe the diffractograms for some rather dilute samples (without adding salt), with GO mass fractions %, %, % and % (volume fractions respectively %, %, % and %). Figure 9 displays two results, and fitting parameters are given in table 1.
| Parameter | ||||
|---|---|---|---|---|
| [nm] | 42.7 | 23.8 | 17.4 | 10.2 |
| 0.39 | 0.75 | 0.65 | 0.93 | |
| 20 | 10 | 10 | 7 |
A fair description of the small-angle scattering features is obtained when using the proposed model, with nevertheless obvious shortcomings for scattering wave vectors in the range Å-1 that may result from the crudeness of our assumption as regards the GO sheet form factor. In particular, the dangling oxygen-rich groups present in GO sheets may increase locally the sheet thickness, therefore contributing to out-of-plane features of the form factor not accounted for in our simplified description.
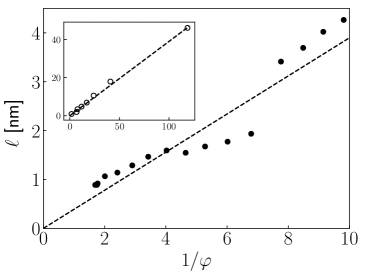
From the fitted values of the Caillé exponent , the smectic compression modulus of the lamellar structure made of stacked GO sheets may be estimated. With
| (9) |
from ref. Caille1972 , and using for the smectic splay modulus the relation Helfrich1978 , we get
| (10) |
or for % (respectively, for %) in units if, as proposed in ref. Poulin2016 , the value of the GO sheet bending modulus is actually equal to . Such values for the smectic compression modulus , significantly larger than predicted in the Helfrich model, namely Helfrich1978 ; Safinya1986 (or in units), are quite reasonable in the presence of dominantly repulsive interactions between GO sheets. Indeed, from Milner-Roux analysis of the “unbinding” transition Milner1992 , the smectic compression modulus should be expressed as Bougis2015
| (11) |
which, from eq. (10) with and values as given in table 1, yields roughly the same estimate for the virial coefficient for the two GO concentrations, with a negative sign as expected for overall repulsive interactions.
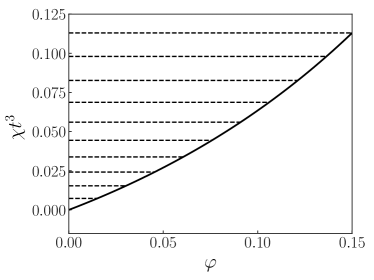
The structural phase transition that occurs in the vicinity of nm is actually also amenable, qualitatively at least, to an interpretation in terms of Milner-Roux arguments. As shown in fig. 10,
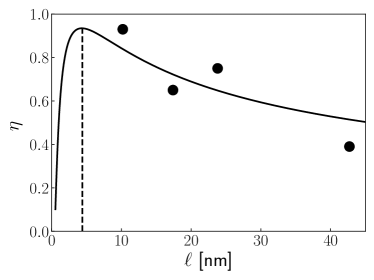
the Caillé exponent is expected to strongly increase when the lamellar stack of GO sheets is dehydrated, until a characteristic period is reached beyond which decreases to very small values. As larger values are associated to (lamellar) Bragg peaks with lesser peak intensities and broader tails, the quasi-disappearance of the first and second order Bragg peaks in a given dilution range (see fig. 5) may thus be understood, even though the predicted value, namely 5.4 nm, clearly differs from its experimental counterpart. However, since the Milner-Roux description of the unbinding transition is a mean-field, perturbative theory, we believe that such a discrepancy should not be too seriously deplored for such concentration ranges where direct interactions between GO sheets are definitely strong.
4 Conclusion
A procedure to concentrate aqueous GO dispersions to significant dryness, with the benefit of avoiding the formation of aggregates has been implemented. The lamellar stacks of GO sheets obtained in an extended concentration range, from ca. 2 % to 72 %, can be reversibly swollen or dehydrated. The simple one-dimensional dilution law is largely obeyed over all the investigated hydration range, even though conspicuous discrepancies have been revealed by small-angle x-ray scattering studies that may indicate the occurrence of an underlying, as yet unidentified, structural phase transition.
The swelling behaviour of the aqueous GO dispersions can be interpreted, similarly to many lyotropic lamellar Lα phases in amphiphilic systems, in terms of an entropic “force” arising from the confinement of undulation fluctuations (also known as Helfrich undulation interactions) acting together, or competing with, direct forces, respectively electrostatic repulsions and van der Waals attractions. The so-called “unbinding transition” mechanism appears here to be mainly driven by the ionic strength of the aqueous medium swelling the GO sheets, as indirectly suggested by the quantitative analysis of the small-angle x-ray diffractograms in terms of a parameter, the Caillé exponent , that combines the bending and compression moduli characterising the elastic properties of lamellar phases. The analysis confirms the recently proposed “super-flexible” nature of GO sheets Poulin2016 .
Acknowledgements.
We thank Philippe Poulin, Cécile Zakri and Wilfrid Neri for fruitful discussions. We also thank Conselho Nacional de Desenvolvimento Científico e Tecnológico (CNPq - Brazil) for providing support to Rafael Leite Rubim through the program “Ciência sem Fronteiras” (processo CNPq nº 250085/2013-5). Figures have been drawn with the 2D graphics package Matplotlib Hunter20075 Author contribution statement
L.N., and F.N. conceived and planned the research. R.L.R. conceived and implemented the drying procedure. R.L.R., M.A.B., T.M., and K.B. contributed to sample preparation and carried out the experiments. All authors provided critical feedback and helped shape the research, analysis and manuscript. All the authors have read and approved the final manuscript.
References
- [1] William S. Hummers and Richard E. Offeman. Preparation of graphitic oxide. Journal of the American Chemical Society, 80(6):1339–1339, 1958.
- [2] Sasha Stankovich, Dmitriy A. Dikin, Richard D. Piner, Kevin A. Kohlhaas, Alfred Kleinhammes, Yuanyuan Jia, Yue Wu, SonBinh T. Nguyen, and Rodney S. Ruoff. Synthesis of graphene-based nanosheets via chemical reduction of exfoliated graphite oxide. Carbon, 45(7):1558–1565, June 2007.
- [3] Natnael Behabtu, Jay R. Lomeda, Micah J. Green, Amanda L. Higginbotham, Alexander Sinitskii, Dmitry V. Kosynkin, Dmitri Tsentalovich, A. Nicholas G. Parra-Vasquez, Judith Schmidt, Ellina Kesselman, Yachin Cohen, Yeshayahu Talmon, James M. Tour, and Matteo Pasquali. Spontaneous high-concentration dispersions and liquid crystals of graphene. Nature Nanotechnology, 5:406–411, 2010.
- [4] Ji Eun Kim, Tae Hee Han, Sun Hwa Lee, Ju Young Kim, Chi Won Ahn, Je Moon Yun, and Sang Ouk Kim. Graphene oxide liquid crystals. Angewandte Chemie International Edition, 50(13):3043–3047, March 2011.
- [5] Hari Krishna Bisoyi and Sandeep Kumar. Carbon-based liquid crystals: art and science. Liquid Crystals, 38(11-12):1427–1449, November 2011.
- [6] Zhen Xu and Chao Gao. Graphene chiral liquid crystals and macroscopic assembled fibres. Nature Communications, 2:571, December 2011.
- [7] Rickard Frost, Gustav Edman Jönsson, Dinko Chakarov, Sofia Svedhem, and Bengt Kasemo. Graphene oxide and lipid membranes: Interactions and nanocomposite structures. NANO Letters, 12:3356–3362, June 2012.
- [8] Jaemyung Kim, Laura J. Cote, and Jiaxing Huang. Two dimensional soft material: New faces of graphene oxide. Accounts of Chemical Research, 45(8):1356–1364, June 2012.
- [9] Zhen Xu and Chao Gao. Aqueous liquid crystals of graphene oxide. ACS Nano, 5(4):2908–2915, March 2011.
- [10] Seyed Hamed Aboutalebi, Mohsen Moazzami Gudarzi, Qing Bin Zheng, and Jang-Kyo Kim. Spontaneous formation of liquid crystals in ultralarge graphene oxide dispersions. Advanced Functional Materials, 21(15):2978–2988, August 2011.
- [11] Budhadipta Dan, Natnael Behabtu, Angel Martinez, Julian S. Evans, Dmitry V. Kosynkin, James M. Tour, Matteo Pasquali, and Ivan I. Smalyukh. Liquid crystals of aqueous, giant graphene oxide flakes. Soft Matter, 7(23):11154–11159, 2011.
- [12] Camilo Zamora-Ledezma, Nicolas Puech, Cécile Zakri, Eric Grelet, Simon E. Moulton, Gordon G. Wallace, Sanjeev Gambhir, Christophe Blanc, Eric Anglaret, and Philippe Poulin. Liquid crystallinity and dimensions of surfactant-stabilized sheets of reduced graphene oxide. The Journal of Physical Chemistry Letters, 3(17):2425–2430, 2012.
- [13] Jing Cao, Hua-Jie Yin, and Rui Song. Circular dichroism of graphene oxide: the chiral structure model. Frontiers of Materials Sciences, 7:83–90, 2013.
- [14] A. Di Mauro, R. Randazzo, S. F. Spano, G. Compagnini, M. Gaeta, L. D’Urso, R. Paolesse, G. Pomarico, C. Di Natale, V. Villari, N. Micali, M. E. Fragala, A. D’Urso, and R. Purrello. Vortexes tune the chirality of graphene oxide and its non-covalent hosts. Chem. Commun., 52:13094–13096, 2016.
- [15] Jean-Christophe P. Gabriel, Franck Camerel, Bruno J. Lemaire, Hervé Desvaux, Patrick Davidson, and Patrick Batail. Swollen liquid-crystalline lamellar phase based on extended solid-like sheets. Nature, 413:504–508, 2001.
- [16] Laurent J. Michot, Isabelle Bihannic, Solange Maddi, Sérgio S. Funari, Christophe Baravian, Pierre Levitz, and Patrick Davidson. Liquid-crystalline aqueous clay suspensions. Proceedings of the National Academy of Sciences, 103:16101–16104, 2006.
- [17] Dzina Kleshchanok, Peter Holmqvist, Janne-Mieke Meijer, and Henk N. W. Lekkerkerker. Lyotropic smectic B phase formed in suspensions of charged colloidal platelets. Journal of the American Chemical Society, 134:5985–5990, 2012.
- [18] Lars Onsager. The effect of shape on the interaction of colloidal particles. Annals of the New York Academy of Sciences, 51:627–659, May 1949.
- [19] Daan Frenkel and Rob Eppenga. Monte Carlo study of the isotropic–nematic transition in a fluid of thin hard disks. Physical Review Letters, 49:1089–1092, 1982.
- [20] Giorgio Cinacchi and Alessandro Tani. The isotropic–nematic phase transition in hard, slightly curved, lens-like particles. The Journal of Chemical Physics, 141:154901, 2014.
- [21] Giorgio Cinacchi and Alessandro Tani. Isotropic–nematic phase transition in hard platelets as described by a third-virial theory. The Journal of Physical Chemistry B, 119:5671–5676, 2015.
- [22] Felix M. van der Kooij and Henk N. W. Lekkerkerker. Formation of nematic liquid crystals in suspensions of hard colloidal platelets. The Journal of Physical Chemistry B, 102(40):7829–7832, 1998.
- [23] Martin A. Bates and Daan Frenkel. Nematic–isotropic transition in polydisperse systems of infinitely thin hard platelets. The Journal of Chemical Physics, 110(13):6553–6559, 1999.
- [24] Zhen Xu and Chao Gao. Graphene in macroscopic order: Liquid crystals and wet-spun fibers. Accounts of Chemical Research, 47(4):1267–1276, February 2014.
- [25] Fengxia Geng, Renzhi Ma, Akira Nakamura, Kosho Akatsuka, Yasuo Ebina, Yusuke Yamauchi, Nobuyoshi Miyamoto, Yoshitaka Tateyama, and Takayoshi Sasaki. Unusually stable 100-fold reversible and instantaneous swelling of inorganic layered materials. Nature Communications, 4:1632, 2013.
- [26] W. Helfrich. Steric interactions of fluid membranes in multilayer systems. Zeitschrift für Naturforschung, 33A:305–315, 1978.
- [27] Reinhard Lipowski and Stanislas Leibler. Unbinding transitions of interacting membranes. Physical Review Letters, 56:2541–2544, 1986.
- [28] S. T. Milner and D. Roux. Flory theory of the unbinding transition. Journal de Physique I France, 2:1741–1754, 1992.
- [29] Product Datasheet: Graphenea Graphene Oxide. https://cdn.shopify.com/s/files/1/0191/2296/files/Graphenea_GO_Datasheet_2016-10-03.pdf?8258700468234452297. Accessed: 2015-05-03.
- [30] W. Scholz and H.P. Boehm. Betrachtungen zur struktur des graphitoxids. Zeitschrift für anorganische und allgemeine Chemie, 369:327–340, 1969.
- [31] A. Lerf, A. Buchsteiner, J. Pieper, S. Schottl, I. Dekany, T. Szabo, and H.P. Boehm. Hydration behavior and dynamics of water molecules in graphite oxide. Journal of Physics and Chemistry of Solids, 67:1106–1110, 2006.
- [32] Stéphan Rouzière, J. David Núñez, Erwan Paineau, Ana M. Benito, Wolfgang K. Maser, and Pascale Launois. Intercalated water in multi-layered graphene oxide paper: an X-ray scattering study. Journal of Applied Crystallography, 50:876–884, 2017.
- [33] Heon Ham, Tran Van Khai, No-Hyung Park, Dae Sup So, Joon-Woo Lee, Han Gil Na, Yong Jung Kwon, Hong Yeon Cho, and Hyoun Woo Kim. Freeze-drying-induced changes in the properties of graphene oxides. Nanotechnology, 25:235601, 2014.
- [34] T.C. Huang, H. Toraya, T.N. Blanton, and Y. Wu. X-ray powder diffraction analysis of silver behenate, a possible low-angle diffraction standard. Journal of Applied Crystallography, 26:180–184, 1993.
- [35] Otto Kratky and Gunther Porod. Diffuse small-angle scattering of x-rays in colloid systems. Journal of Colloid Science, 4(1):35–70, 1949.
- [36] J. D. Bernal. The structure of graphite. Proceedings of the Royal Society of London A: Mathematical, Physical and Engineering Sciences, 106(740):749–773, 1924.
- [37] F. C. Larche, J. Appell, G. Porte, P. Bassereau, and J. Marignan. Extreme swelling of a lyotropic lamellar liquid crystal. Physical Review Letters, 56:1700–1703, 1986.
- [38] C. R. Safinya, D. Roux, G. S. Smith, S. K. Sinha, P. Dimon, N. A. Clark, and A. M. Bellocq. Steric interactions in a model multimembrane system: A synchrotron x-ray study. Physical Review Letters, 57:2718–2721, 1986.
- [39] Reinhard Strey, Reinhard Schomäcker, Didier Roux, Frédéric Nallet, and Ulf Olsson. Dilute lamellar and L3 phases in the binary water C12E5 system. Journal of the Chemical Society Faraday Transactions, 86:2253–2261, 1990.
- [40] Éric Freyssingeas, Didier Roux, and Frédéric Nallet. Quasi-elastic light scattering study of a highly swollen lamellar and “sponge” phase. Journal de Physique II France, 7:913–929, 1997.
- [41] Masateru M. M. Ito, Kohzo Ito, Mitsuhiro Shibayama, Kenji Sugiyama, and Hideaki Yokoyama. Phase behavior of block copolymers in selective supercritical solvent. Macromolecules, 48:3590–3597, 2015.
- [42] Yoshiaki Uchida, Takuma Nishizawa, Takeru Omiya, Yuichiro Hirota, and Norikazu Nishiyama. Nanosheet formation in hyperswollen lyotropic lamellar phases. Journal of the American Chemical Society, 138:1103–1105, 2016.
- [43] Philippe Poulin, Rouhollah Jalili, Wilfrid Neri, Frédéric Nallet, Thibaut Divoux, Annie Colin, Seyed Hamed Aboutalebi, Gordon Wallace, and Cécile Zakri. Superflexibility of graphene oxide. Proceedings of the National Academy of Sciences, 113:11088–11093, 2016.
- [44] K. Bougis, R. Leite Rubim, N. Ziane, J. Peyencet, A. Bentaleb, A. Février, C.L.P. Oliveira, E. Andreoli de Oliveira, L. Navailles, and F. Nallet. Stabilising lamellar stacks of lipid bilayers with soft confinement and steric effects. European Physical Journal E: Soft Matter, 38:78, 2015.
- [45] R. Leite Rubim, B.B. Gerbelli, K. Bougis, C.L. Pinto de Oliveira, L. Navailles, F. Nallet, and E. Andreoli de Oliveira. Water activity in lamellar stacks of lipid bilayers: “Hydration forces” revisited. European Physical Journal E: Soft Matter, 39:3, 2016.
- [46] Kévin Bougis. Fluctuations et interactions en situation de nano-confinement anisotrope. PhD thesis, université de Bordeaux - Universidade de São Paulo, 28 November 2016.
- [47] Massimo G. Noro and William M. Gelbart. Theory of lamellar–lamellar phase transitions in pure and mixed surfactant solutions. The Journal of Chemical Physics, 111:3733–3743, 1999.
- [48] Barry W. Ninham. On progress in forces since the DLVO theory. Advances in Colloid and Surface Science, 83:1–17, 1999.
- [49] Frédéric Nallet. Surfactant films in lyotropic lamellar (and related) phases: Fluctuations and interactions. Advances in Colloid and Interface Science, 247:363–373, 2017.
- [50] Alain Caillé. Remarques sur la diffusion des rayons X dans les smectiques A. Comptes rendus de l’Académie des sciences Paris, série B, 274:891–893, 1972.
- [51] Leon Gunther, Yosef Imry, and Joseph Lajzerowicz. X-ray scattering in smectic-A liquid crystals. Physical Review A, 22:1733–1740, 1980.
- [52] P.-G. de Gennes and J. Prost. The physics of liquid crystals Second edition. Clarendon Press Oxford, 1993.
- [53] Frédéric Nallet, René Laversanne, and Didier Roux. Modelling x-ray or neutron scattering spectra of lyotropic lamellar phases: Interplay between form and structure factors. Journal de Physique II, 3(4):487–502, 1993.
- [54] Ruitian Zhang, Robert M. Suter, and John F. Nagle. Theory of the structure factor of lipid bilayers. Physical Review E, 50:5047–5060, 1994.
- [55] Mitsuhiro Shibayama and Takeji Hashimoto. Small-angle x-ray scattering analyses of lamellar microdomains based on a model of one-dimensional paracrystal with uniaxial orientation. Macromolecules, 19:740–749, 1986.
- [56] J. D. Hunter. Matplotlib: A 2D graphics environment. Computing In Science & Engineering, 9(3):90–95, 2007.