proceeding of the SF2A 2017. 7 pages, 2 Fig
New insights on the origin of the High Velocity Peaks in the Galactic Bulge
Abstract
We provide new insight on the origin of the cold high-Vlos peaks (200 kms-1) in the Milky Way bulge discovered in the APOGEE commissioning data (Nidever et al. 2012). Here we show that such kinematic behaviour present in the field regions towards the Galactic bulge is not likely associated with orbits that build the boxy/peanut (B/P) bulge. To this purpose, a new set of test particle simulations of a kinematically cold stellar disk evolved in a 3D steady-state barred Milky Way galactic potential, has been analysed in detail. Especially bar particles trapped into the bar are identified through the orbital Jacobi energy , which allows us to identify the building blocks of the B/P feature and investigate their kinematic properties. Finally, we present preliminary results showing that the high-Vlos features observed towards the Milky Way bulge are a natural consequence of a large-scale midplane particle structure, which is unlikely associated with the Galactic bar.
keywords:
The Galaxy, bulge, disk, kinematics and dynamics, galaxies structure, numerical methods1 Introduction
The discovery by Nidever et al. (2012) of cold high-velocity peaks ( 200 km s-1) in the Apache Point Observatory Galactic Evolution Experiment (APOGEE) commissioning data across the Galactic bulge {4, 14} and {-2, 2} and confirmed by the High-Order Kinematic Moments by Zasowski et al. (2016), suggests that there may be a significant non-axisymmetric structure that dominates the bulge regions (e.g., Robin et al. 2012; Wegg & Gerhard 2013, for instance), which has turned the study and characterization of a B/P bulge (e.g., Portail et al. 2015; Simion et al. 2017, among others) into a very active research field. Most of models that attempt to explain the high-velocity peaks observed toward the Milky Way bulge suggest that these features are most likely bulge stars on bar orbits, i.e., orbits in 2:1 and/or higher order resonant family (see e.g., Aumer & Schönrich 2015; Molloy et al. 2015). Recently, alternative scenarios have been proposed that do not invoke any family of bar resonant orbits linked with the building blocks of the B/P feature. Additionally, it has been suggested that the high-velocity peaks may be the product of a kiloparsec-scale nuclear stellar disk in the Galactic bulge (Debattista et al. 2015). Also, the recent study by Li et al. (2014) suggests that these kinematics features might be an artifact due to small number statistics. With these issues in mind, we expect this preliminary contribution will help improve the current understanding on the origin of the cold high-velocity peaks. In this work, we qualitatively analyzed a set of numerical simulations of a synthetic Milky Way Galaxy made up of the superposition of many composite stellar populations already described and analyzed in Fernández-Trincado (2017a). Using numerical simulations from Fernández-Trincado (2017a), we began a pilot project aimed to provide an alternative scenario for the origin of high-Vlos feature in the bulge to look for possible orbital energy imprints of the cold high-Vlos.
2 The Galactic Model
We use the galactic dynamic software GravPot16***https://fernandez-trincado.github.io/GravPot16/ in order to carry out a comprehensive orbital study of particles in the inner region of the Milky Way. For a more detailed discussion about GravPot16, we refer the readers to a forthcoming paper (Fernández-Trincado et al. in preparation). Here we summarize the backbone of GravPot16. Using the new version of the Besançon Galaxy Model, in good agreement with many observations, we computed a semi-analytical steady-state 3D gravitational potential of the Milky Way, observationally and dynamically constrained. The model is primarily made up of the superposition of several composite stellar components, where the density profiles in cylindrical coordinates, (R, Z), are the same as those proposed in Robin et al. (2003, 2012, 2014), i.e., a B/P bulge, a Hernquist stellar halo, seven stellar Einasto thin disks with spherical symmetry in the inner regions, two stellar sech2 thick disks, a gaseous exponential disk, and a spherical structure associated with the dark matter halo. A new formulation for the global potential, (R, Z), of this Milky Way density model, (R, Z), will be described in detail in a forthcoming paper (Fernández-Trincado, et al. in preparation). (R, Z) has been rescaled to the Sun’s galactocentric distance. The Sun is located at 8.0 kpc, and the local rotation velocity is assumed to be km s-1, given by Sofue (2015). Here, we briefly describe the bar’s structural parameters, such as recommended by Fernández-Trincado (2017a) from dynamical constraints using the BRAVA data set (Kunder et al. 2012): We assume a total mass for the bar of 1.11010 M⊙, an angle of 20 degrees for the present-day orientation of the major axis of the bar and an angular velocity, km s-1 kpc-1, consistent with the recent estimate of Portail et al. (2015), and a cut-off radius kpc (e.g., Robin et al. 2012). Additionally, it should be noted that the non-axisymmetric configuration of our dynamic model has been extensively employed to predict stellar orbits (see Fernández-Trincado et al. 2016, 2017), and/or orbital parameters for a large set of APOGEE-TGAS sources (see Abolfathi et al. 2017; Tang et al. 2017). For a more detailed discussion, we refer the readers to a forthcoming paper (Anders et al. 2017b, a).

3 Test particle simulations
First, we ran controled particle simulations to mimic one of the cold stellar thin disk described in the Besan¸con population synthesis model (disk in the age range 7 to 10 Gyr; see e.g., Robin et al. 2003). To this purpose we use the GravPot16 code in its axisymmetric and non-axisymmetric configuration. We adopt a similar strategy as described in Romero-Gómez et al. (2015) and Martinez-Medina et al. (2016). The test particles are initially involved in a steady axisymmetric potential model over long integration time (in this work we adopt a integration time of 10 Gyr) to ensure that the initial disk particle distribution reaches a state of relaxation within the background potential. Then, the boxy bar structure grows adiabatically into the simulations during a period of time of 2 Gyr. Once the bar potential is introduced into the system, we increase the integration time during a period of time long enough ( Gyr) to avoid transient effects. The initial conditions for the particle velocities are assigned using the Besançon population synthesis model disc kinematics fitted to RAVE and TGAS data (see e.g., Robin et al. 2017). It is important to note that our initial conditions are based on locally self-consistent recipes, but it is not guaranteed to be fully self-consistent globally, and will thus be slightly relaxed before turning on the non-axisymmetric potential (e.g., Fernández-Trincado 2017a).
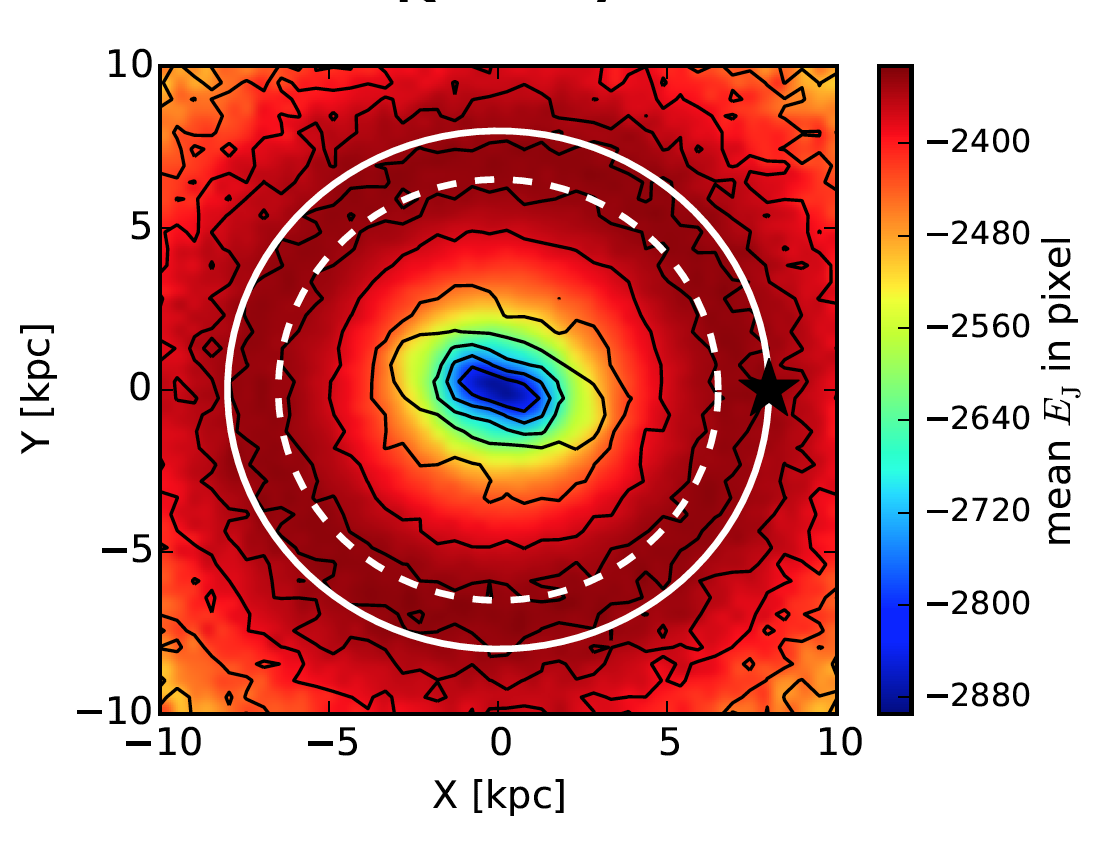
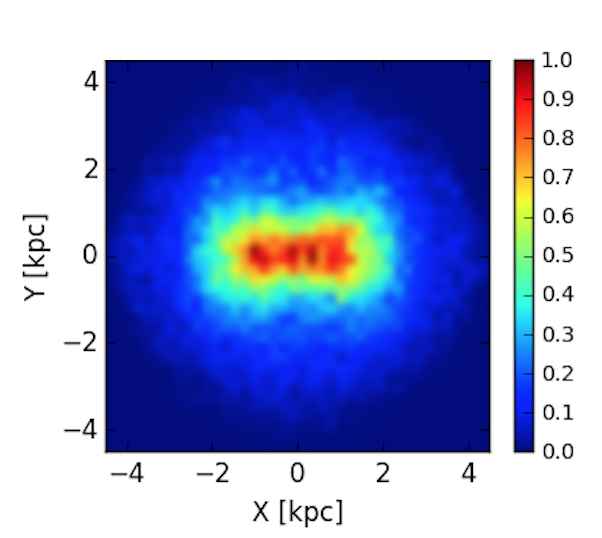
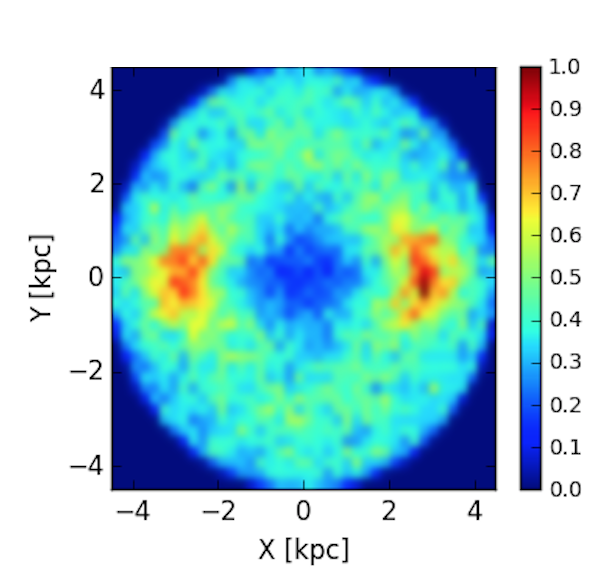
Secondly, after 15 Gyr integration time in the above potential we record the Jacobi energy per unit mass, †††The Jacobi energy is then given by . Where and are the GravPot16 axisymmetric and non-axisymmetric potential components, respectively., in the bar frame for all particles in a box of 3.5 kpc 2.5 kpc 2 kpc, which is thought to have high chance to contain orbits trapped into the bar structure as illustrated in Fig. 1 and Fig. 2 (first and second column). With the Jacobi energy distribution in the box above mentioned we determined the boundary between bar-trapped particles () and not-bar-trapped particles () by identifying the trough in the Jacobi energy distribution ( -2.7105 km2 s-2). The results are briefly described in §4.
4 Results and Concluding Remarks
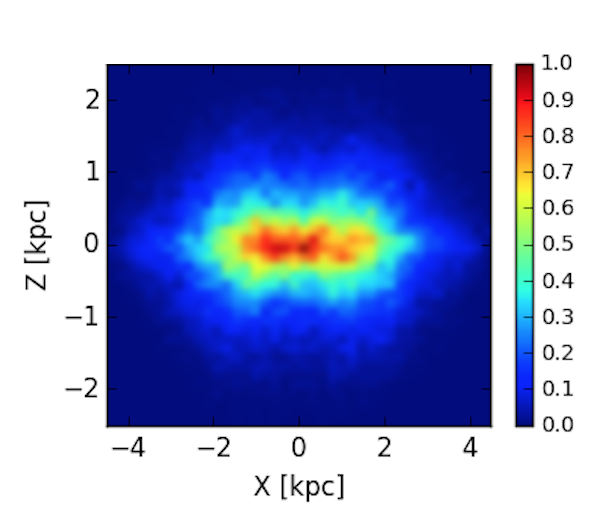
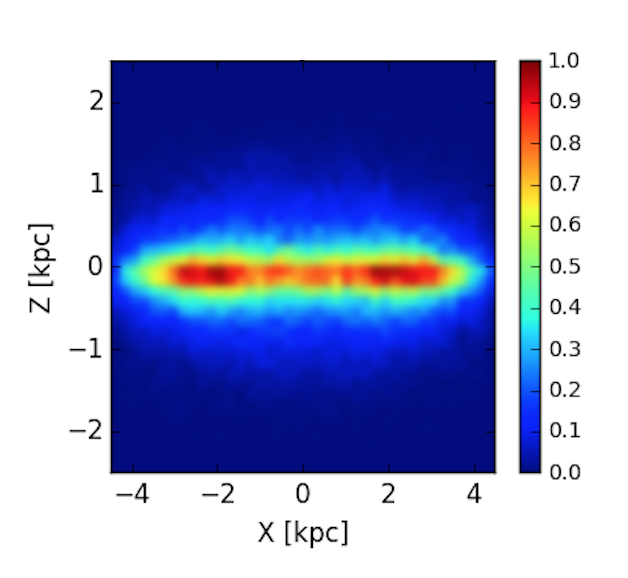
Figure 3 plots the Kernel Density Estimate (KDE) smoothed distributions for the bar-trapped particles (first column). In particular we note that the B/P feature is carried largely by particles having a Jacobi energy . In our numerical simulations, all the building blocks of the B/P bulge structure are composite of different orbits existing at energies smaller than the boundary energy, , in particular diverse resonant orbits (i.e., family of tube orbits; : banana orbits, etc) which generate a strong peanut shape at shorter radii on the side-on projection (column 1, row 2 in the same figure). This Galactic B/P structure accounts for 34% of the particles of the bulge (within kpc) (e.g., Fernández-Trincado 2017a). Figure 3 also plots the KDE smoothed distributions for the not-bar-trapped particles (second column), which do not show the B/P shape. The not-bar-trapped particles, those orbits existing at energies larger than the boundary energy, () in this model consist mostly of low eccentricity orbits, which dominate the mid-plane (see column 2 and 3 in Figure 2) and accounts for 66% of the particles of the bulge.
4.1 An alternative explanation for the kinematics feature at high
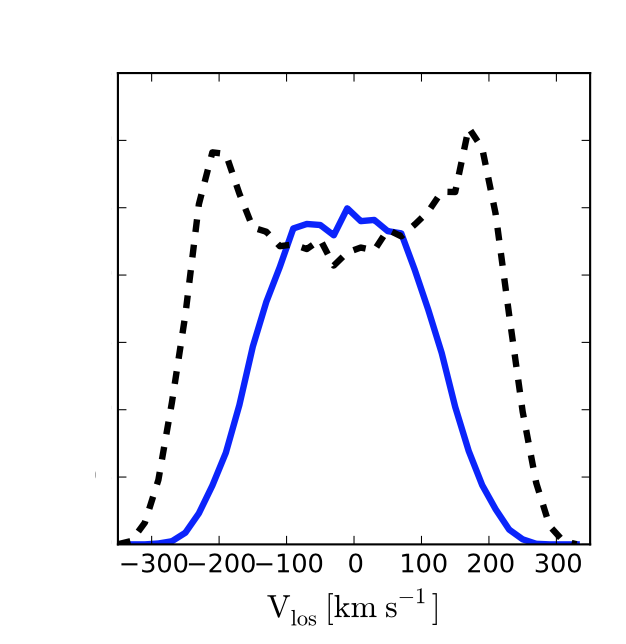
It is important to note that here we provide the kinematic predictions for orbits existing at energies smaller or greater than the boundary energy. Detailed azimuthal projections were already analyzed in Fernández-Trincado (2017a) confirming the presence of the cold high-Vlos peaks extending to Galactic longitude 10 degree, which are absent a few kiloparsecs off the mid-plane, indicating that orbits with Jacobi energy (a mid-plane hosting more particles at ) responsible for the feature do not extend this far off-plane, as also shown in second column in Figure 3. Figure 4 plots the predicted line-of-sight velocity distributions (LOSVDs –here called Vlos) in the Galacto-centric restframe. At the Vlos distribution has a single peak dominated by bar-trapped-particles, hosting more particles at 150 km s-1. There are also few particles that have high Vlos ( 200 km s-1) and are likely associated with the high-velocity tail of the resonant bar-supporting 2:1 orbits (see Molloy et al. 2015). At the Vlos have developed two peaks, with particles moving at significantly larger velocities ( km s-1) in the mid-plane, dominated by not-bar-trapped particles, but remain well below the circular velocity of the galaxy. These two high velocity peaks are more prominent than the low-Vlos peak developed by bar-trapped particles.
4.2 Conclusion
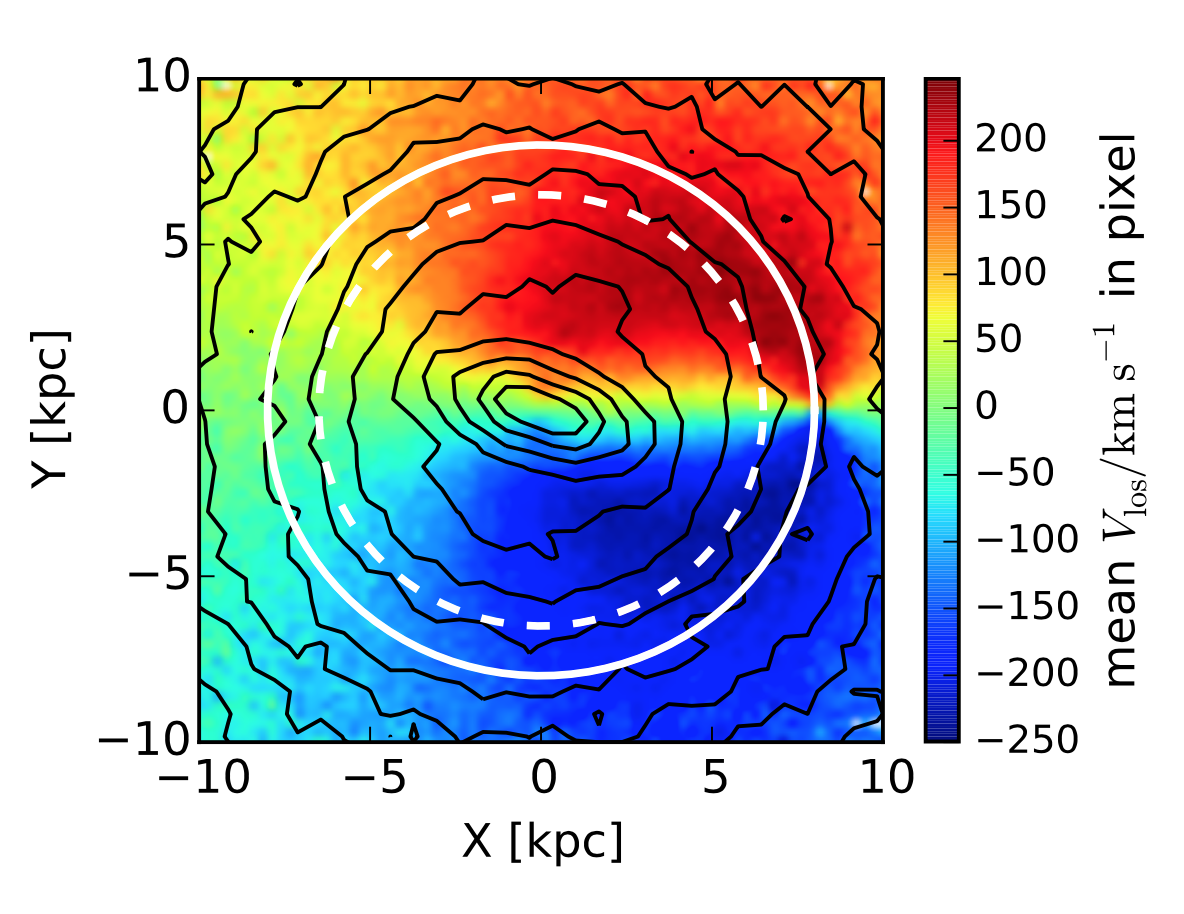
We have made an attempt to explain the presence of the cold high velocity peaks in the bulge. It is important to note, that we account for the composite nature of the bulge in our simulations. The dependence of Vlos with and has not been shown in the present work, but extensively studied by Fernández-Trincado (2017a). The right panel of Figure 4 shows color-coded maps of the average , , for the entire sample of our simulated cold stellar thin disk in Galactic coordinates. In a similar manner as in Debattista et al. (2015) our numerical approach is capable of producing the peak velocities at orbit tangent points with the characteristic winged pattern of the velocity fields.
Lastly, we conclude that the most natural interpretation of the high velocity features towards the Galactic bulge is that they are likely not dominated by orbits at that build the B/P bulge, but may be a consequence of families of orbits at and low orbital eccentricities in the mid-plane that do not support the bar structure. Our Milky Way potential model fine-tuned to observations is able to explain the velocity distributions in most APOGEE fields in the bulge, without invoking the presence of any nuclear disk in the inner 1 kpc as pointed out in Debattista et al. (2015). The advantage of our numerical approach is that the test particles have evolved in a realistic Milky Way potential inheriting the information on both density and kinematics, and the particles in statistical equilibrium with the potential imposed (e.g., Romero-Gómez et al. 2015; Martinez-Medina et al. 2016; Fernández-Trincado 2017a). It should be noticed that we find very similar distributions to those in APOGEE, without any adjustment parameters, but without applying the observation selection function. Hence we shall verify this point in the near future.
The high precision of the Gaia mission will provide the 6D phase space needed to confirm our orbital interpretations and to compute the orbital Jacobi energy beyond 5 kpc from the Sun.
Acknowledgements.
We thank Merce Romero Gómez, Fran¸coise Combes and Famaey Benoit for comments on an earlier version of this paper. J.G.F-T gratefully acknowledges partial financial support from the SF2A in order to attend the SF2A-2017 meeting held in Paris in July 2017, and the Chilean BASAL Centro de Excelencia en Astrofísica y Tecnologías Afines (CATA) grant PFB- 06/2007. We also acknowledge the support of the UTINAM Institute of the Université de Franche-Comté, Région de Franche-Comté and Institut des Sciences de l’Univers (INSU) for providing HPC resources on the Cluster Supercomputer Mésocentre de calcul de Franche-Comté. E.M, A.P.V and B.P acknowledge support from UNAM/PAPIIT grant IN105916 and IN114114. Funding for the GravPot16 software has been provided by the Centre national d’études spatiale (CNES) through grant 0101973 and UTINAM Institute of the Université de Franche-Comte, supported by the Region de Franche-Comte and Institut des Sciences de l’Univers (INSU). The GravPot16 Web site is at https://fernandez-trincado.github.io/GravPot16/.References
- Abolfathi et al. (2017) Abolfathi, B., Aguado, D. S., Aguilar, G., et al. 2017, ArXiv e-prints
- Anders et al. (2017a) Anders, F., Queiroz, A. B., Chiappini, C., et al. 2017a, in preparation
- Anders et al. (2017b) Anders, F., Queiroz, A. B., Chiappini, C., et al. 2017b, in IAU Symposium, Vol. 334, Rediscovering our Galaxy, ed. C. Chiappini, I. Minchev, E. Starkenburg, & M. Valentini
- Aumer & Schönrich (2015) Aumer, M. & Schönrich, R. 2015, MNRAS, 454, 3166
- Debattista et al. (2015) Debattista, V. P., Ness, M., Earp, S. W. F., & Cole, D. R. 2015, ApJ, 812, L16
- Fernández-Trincado et al. (2017) Fernández-Trincado, J. G., Zamora, O., Garcia-Hernandez, D. A., et al. 2017b, ArXiv e-prints
- Fernández-Trincado (2017a) Fernández-Trincado, J. G. 2017a, Université Bourgogne Franche-Comté Phd Thesis, 1, 174
- Fernández-Trincado et al. (2016) Fernández-Trincado, J. G., Robin, A. C., Moreno, E., et al. 2016, ApJ, 833, 132
- Kunder et al. (2012) Kunder, A., Koch, A., Rich, R. M., et al. 2012, AJ, 143, 57
- Li et al. (2014) Li, Z.-Y., Shen, J., Rich, R. M., Kunder, A., & Mao, S. 2014, ApJ, 785, L17
- Martinez-Medina et al. (2016) Martinez-Medina, L. A., Pichardo, B., Moreno, E., Peimbert, A., & Velazquez, H. 2016, ApJ, 817, L3
- Molloy et al. (2015) Molloy, M., Smith, M. C., Evans, N. W., & Shen, J. 2015, ApJ, 812, 146
- Nidever et al. (2012) Nidever, D. L., Zasowski, G., Majewski, S. R., et al. 2012, ApJ, 755, L25
- Pérez-Villegas et al. (2017) Pérez-Villegas, A., Portail, M., Wegg, C., & Gerhard, O. 2017, ApJ, 840, L2
- Pichardo et al. (2004) Pichardo, B., Martos, M., & Moreno, E. 2004, ApJ, 609, 144
- Portail et al. (2015) Portail, M., Wegg, C., Gerhard, O., & Martinez-Valpuesta, I. 2015, MNRAS, 448, 713
- Robin et al. (2017) Robin, A. C., Bienaymé, O., Fernández-Trincado, J. G., & Reylé, C. 2017, ArXiv e-prints
- Robin et al. (2012) Robin, A. C., Marshall, D. J., Schultheis, M., & Reylé, C. 2012, A&A, 538, A106
- Robin et al. (2003) Robin, A. C., Reylé, C., Derrière, S., & Picaud, S. 2003, A&A, 409, 523
- Robin et al. (2014) Robin, A. C., Reylé, C., Fliri, J., et al. 2014, A&A, 569, A13
- Romero-Gómez et al. (2015) Romero-Gómez, M., Figueras, F., Antoja, T., Abedi, H., & Aguilar, L. 2015, MNRAS, 447, 218
- Simion et al. (2017) Simion, I. T., Belokurov, V., Irwin, M., et al. 2017, ArXiv e-prints
- Sofue (2015) Sofue, Y. 2015, PASJ, 67, 75
- Tang et al. (2017) Tang, B., Fernández-Trincado, J. G., Geisler, D., et al. 2017, submitted, 1, 1
- Wegg & Gerhard (2013) Wegg, C. & Gerhard, O. 2013, MNRAS, 435, 1874
- Zasowski et al. (2016) Zasowski, G., Ness, M. K., García Pérez, A. E., et al. 2016, ApJ, 832, 132