Stress granule formation via ATP depletion-triggered phase separation
Abstract
Stress granules (SG) are droplets of proteins and RNA that form in the cell cytoplasm during stress conditions. We consider minimal models of stress granule formation based on the mechanism of phase separation regulated by ATP-driven chemical reactions. Motivated by experimental observations, we identify a minimal model of SG formation triggered by ATP depletion. Our analysis indicates that ATP is continuously hydrolysed to deter SG formation under normal conditions, and we provide specific predictions that can be tested experimentally.
1 Introduction
In order to function, a biological cell has to organise its interior contents into compartments that can dynamically evolve depending on the environment and moment in the cell cycle. For example, cytoplasmic stress granules (SG) form when the cell is under stress [1] and P granules localise to one side of the embryo of C. elegans prior to the first cell division [2, 3, 4]. Both SG and P granules belong to the class of ribonucleoprotein (RNP) granules. RNP granules consist of RNA and proteins and lack a surrounding membrane. Recent experiments provided strong evidence that the intriguing mechanism behind their formation and dynamical regulation, in the absence of a membrane, is based on the physical phenomenon of phase separation [5, 6]. Phase separation refers to the spontaneous partitioning of a system into compartments of distinct macroscopic properties, such as the condensation of water vapour into droplets when fog forms. Phase separation under equilibrium condition is a well-understood phenomenon [7], however the phase separation in the cytoplasm can be driven out of equilibrium by a number of effects that include activity of motor proteins shuttling along the cytoskeleton [8], and chemical reactions affecting the phase-separating behaviour of RNP granule constituents [9, 10, 11, 12, 13].
In this paper, we apply the theoretical formalism developed in [13] to investigate minimal models of SG regulation based on non-equilibrium, chemical reaction-controlled phase separation. SG are a particularly dynamic type of RNP granules as they form quickly, in the order of 10 min, when the cell is under stress (e.g., heat shock, chemical stress, osmotic shock, etc.), and also dissolve away rapidly when the stress is removed [14, 15]. The cell’s reaction to external stresses by forming SG is important for its survival [16, 1]. Although specific functions of SG remain unclear, they are thought to be involved in protecting messenger-RNA by recruiting them into SG away from harmful conditions [17, 18, 19]. In addition, SG malfunction is associated with several degenerative diseases such as amyotrophic lateral sclerosis and multisystem proteinopathy [20].
1.1 Experimental observations
Experimental studies have shown that SG assemble in response to multiple types of stress situations [21, 22, 24], and several pathways for SG formation have been identified. The most established is the ATP-dependent phosphorylation of the translation initiation factor eIF2 causing the arrest of RNA translation [16]. RNA is subsequently released from polysomes and aggregate with various proteins to form SG. There exist also other pathways that are independent of eIF2 phosphorylation [23], such as energy starvation [24]. Indeed, while various stress conditions causing SG assembly also cause a depletion of the cytoplasmic energy stores [21, 25, 26], energy starvation alone has been shown to trigger SG formation [24]. Here, we will focus exclusively on how changes in the energy level, and specifically the ATP concentration, can regulate SG formation. In other words, we will make the assumption that the ATP concentration directly triggers SG formation through ATP-dependent biochemical reactions.
In addition to this central premise, we will use two other pieces of biological observations to guide our modelling: First, during normal conditions, i.e. without imposed stress, the ATP concentration is at the normal level and SG are absent, or at least are so small that they are undetectable microscopically. Second, when external stress is imposed, ATP can fall by 50% [21, 26], in a time scale similar to that of SG formation [21, 25, 26], and SG assemble with sizes of the order of a micrometer [16]. We will therefore impose the following two constraints on our modelling: 1) a fall in the ATP level leads to the growth of SG, and 2) the response to the ATP the level is switch-like, in the sense that a relatively mild change in the ATP level can lead to a very large change in SG size.
We now set out to construct minimal models that are compatible with these salient experimental findings on SG regulation.
2 Minimal models
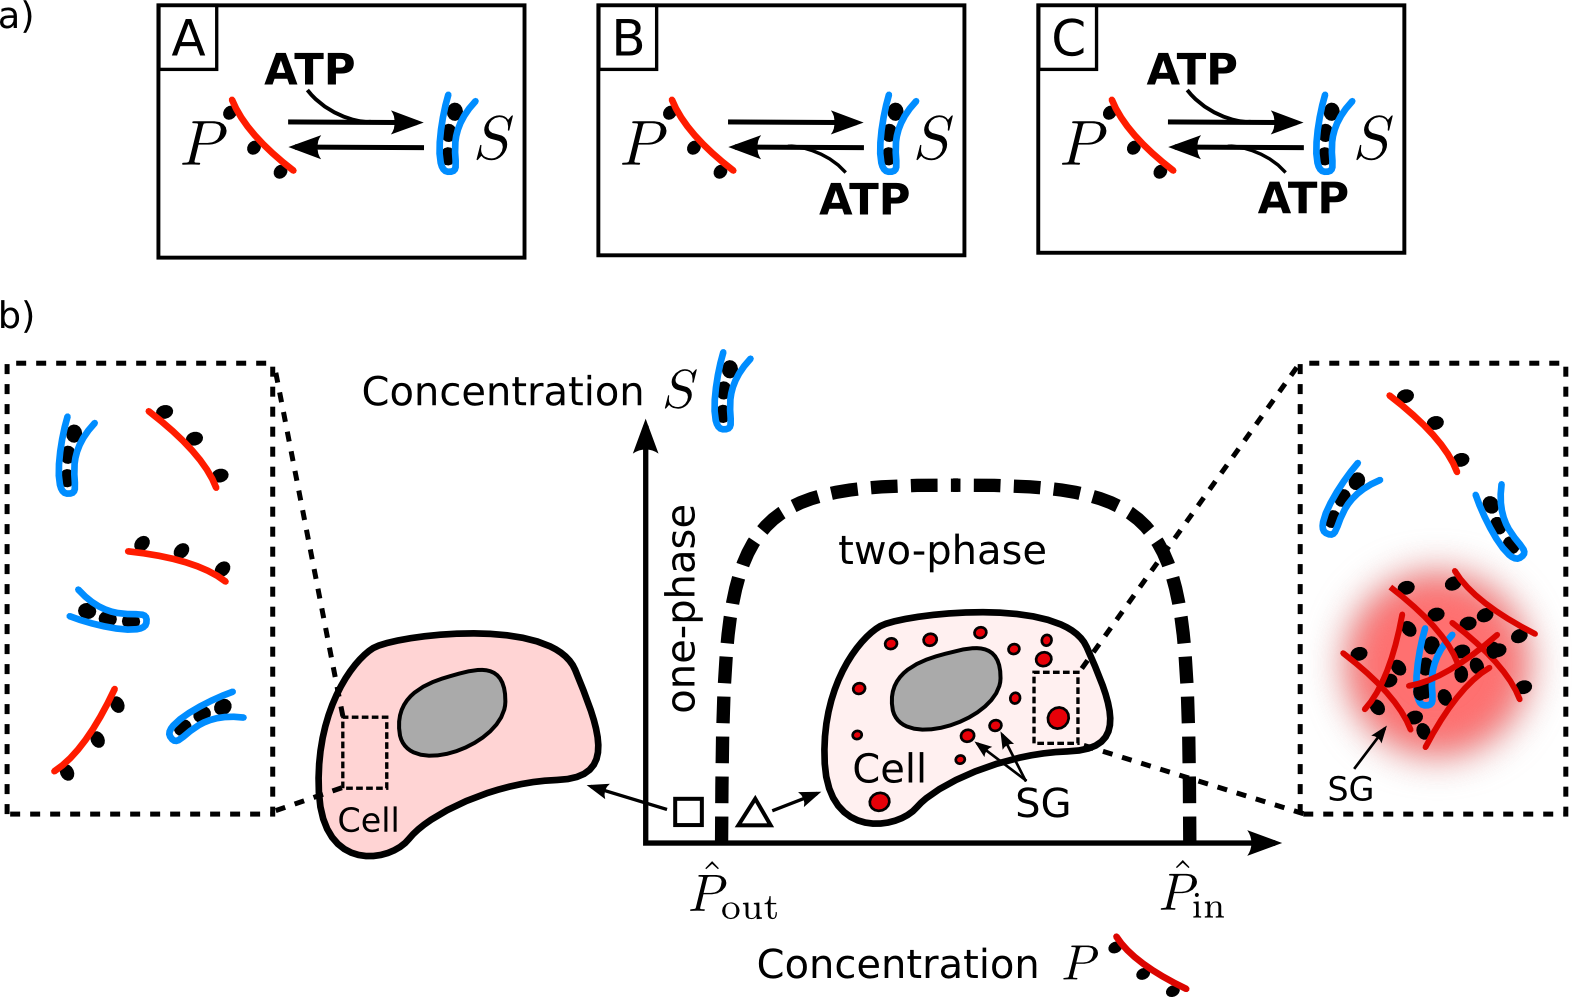
We first describe a set of minimal models of SG regulation based on the principle of phase separation controlled by ATP-driven chemical reactions. A similar reaction scheme has recently been employed to study centrosomes [9], and the associated physics has started to be explored in [10, 13]. We consider the cell cytoplasm as a ternary mixture of molecules: the phase-separating form of the SG constituent molecules (), the soluble form of the same molecules (), and the remaining molecules in the cytoplasm (). Note that the constituents of SG consist of many distinct proteins and mRNA [1]. Therefore, and are meant to represent the average behaviour of the set of proteins and mRNA responsible for SG formation via phase separation [27]. The same applies to the component , which represents the average behaviour of the cytoplasmic molecules not involved in SG formation. To control phase separation, we further assume that and can be inter-converted by chemical reactions that are potentially ATP-driven:
| (1) |
where denote the forward and backward reaction rate constants. In the biological context these reactions can be protein post-transcriptional modifications. For example the phase behaviour (phase-separated or homogeneous) of intrinsically disordered proteins, a class of proteins that lack a well defined secondary structure, can be controlled via their phosphorylation/dephosphorylation [28, 29]. In our minimal description, we assume that there is no cooperativity in the chemical reactions, i.e. do not depend on the concentrations of the molecular components. However, the rates can be influenced by the ATP concentration, denoted by , in a linear manner. With these simplifications, we can categorise the distinct schemes into three models: A, B, and C (Fig. 1(a)). In model A, ATP promotes the conversion from the phase-separating state to the soluble state . In model B, ATP promotes the reverse reaction, and in model C, both reactions are driven by ATP. Specifically, we have:
| (2) | |||||
| (3) | |||||
| (4) |
with being constants, and where refers to the model under consideration. The absence of a constant term in the ATP-driven reaction rates implies that these reactions cannot occur spontaneously (without ATP). This is justified by the fact that the free energy barrier for ATP-driven reaction is typically high, rendering spontaneous reactions negligible [30].
3 Steady-state of a multi-droplet system
Given the three minimal models depicted in Fig. 1(a), we now aim to determine which one of them is the most compatible with experimental observations. To do so, we will first elucidate the salient features of the mechanism of chemical reaction-driven phase separation by considering a single phase-separated droplet of radius co-existing with the dilute medium.
We assume that both inside and outside SG, and undergo the chemical reactions described by Eqs (2)-(4), and free diffusion with the same diffusion coefficient . This approximation is supported by experimental observations that show that SG are not inert, highly packed molecular aggregates, but porous [31] and dynamic, with SG constituents rapidly shuttling in and out [32, 33]. Then, denoting the concentrations of and by the same symbols, they obey the reaction-diffusion equations:
| (5a) | ||||
| (5b) | ||||
where and the subscripts “in” and “out” denote the concentration profiles inside and outside the droplet.
In addition to the dynamical equations, we need to supply the boundary conditions. To this end, we assume further that the system is close to equilibrium to the extent that local thermal equilibrium applies around the droplet interfacial region, which means that
| (6) | |||||
| (7) | |||||
| (8) |
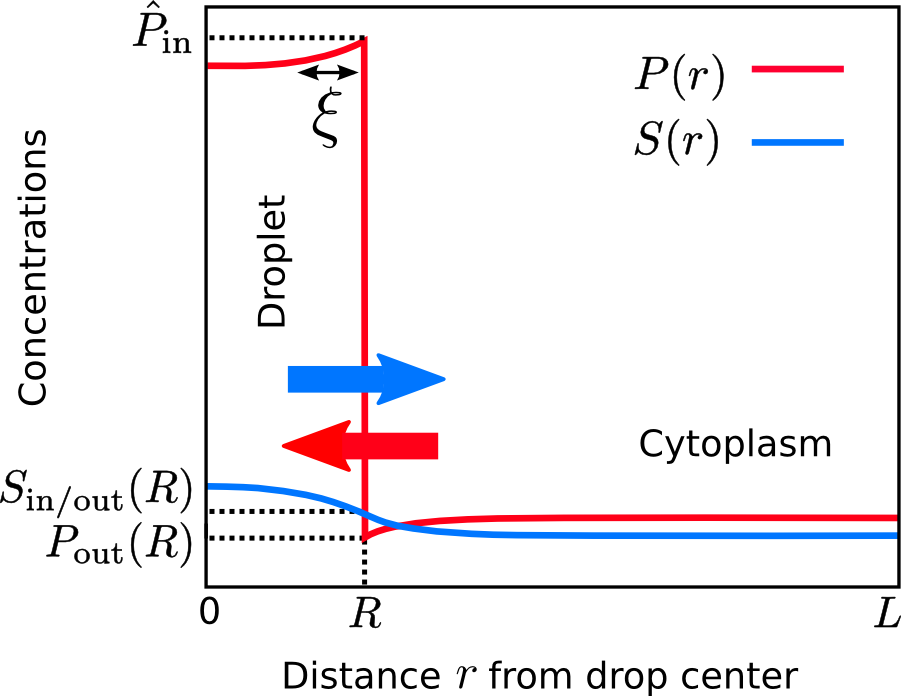
where we have assumed spherical symmetry with the centre of the droplet being the origin of our coordinate system. In the equations above, with being an infinitesimal constant. In other words, denotes the position just outside the droplet and denotes the position just inside the droplet. are the equilibrium coexistence concentrations given by the phase boundary (see Fig. 1(b)), and Eq. (7) is the Gibbs-Thomson relation with being the capillary length. The concentration just outside droplets therefore increases as the droplet radius decreases, which is a consequence of the Laplace pressure [7]. In addition, we assume that is inert to phase separation so that its concentration profile is continuous at the interface, hence Eq. (8). The boundary conditions above are further complemented by the no-flux boundary conditions:
| (9) |
where is the system size and is the distance from the droplet’s centre.
Another crucial approximation we will employ is the quasi-static assumption as done in the Lifshitz-Slyozov theory for equilibrium phase separation [36], which assumes that the time scale at which concentration profiles reach a steady-state is much faster than the time scale at which a droplet radius changes by a non-negligible amount. With this separation of time scale, we only need to solve for the steady-state solutions of Eqs (5) in order to study the droplet’s dynamics in the system.
Setting the left hand sides of Eqs (5) to zero, the generic solutions for , assuming spherical symmetry, are of the form [13]
| (10) |
where
| (11) |
which corresponds to the length scale of the concentration gradients, and are independent of but model-parameter dependent. Specifically, depend on and as well as the overall combined concentration of both phase-separating () and soluble () forms of the molecules. Note that Eqs (6)–(9) together with the total mass conservation seem to suggest that there are 8 conditions to be satisfied, however, by summing the two equations in Eq. (5), we see that the total protein concentration profile () in both the dilute and condensed phases have to be flat. As a result, two of the conditions in Eq. (9) are redundant. Therefore, we have only six conditions to be satisfied, hence the six parameters in Eq. (10). Furthermore, the concentration profiles of can be written as and .
At the steady-state, are determined by the boundary conditions and the molecule number conservation. Eq. (10) indicates that chemical reactions affect the concentration profiles and introduce a new length scale () into the problem (Fig. 2).
At thermal equilibrium (), a finite, phase-separating system in the nucleation and growth regime (which is the regime relevant to our biological context) can only be in two steady-states: either the system is well-mixed (i.e., no granules) or a single granule enriched in co-exists with the surrounding cytoplasm that is dilute in [7]. Furthermore, due to surface tension, there exists a critical radius below which droplets are no longer thermodynamically stable (Eq. (30) in A). The critical radius can be estimated as a trade off between the surface energy () that penalises having two phases and the bulk free energy in the droplet () that promotes droplet formation. As a result, in the early stage of phase separation when the mixture is homogeneous, droplets larger than need to be nucleated. A quantitative analysis of nucleation is beyond the scope of this paper and we will assume that droplets are spontaneously nucleated when the system is inside the equilibrium phase boundary (Fig. 1(b)), potentially due to heterogeneous nucleation involving proteins or RNA as seeding platforms [34, 35]. Once multiple droplets are nucleated, droplets first grow by incorporation of phase-separating molecules that diffuse from the cytoplasm to SG. This process, known as diffusion-limited growth [7], stops when the cytoplasmic concentration of is depleted and reaches the saturation concentration . The resulting multi-droplet system is always unstable and coarsen by Ostwald ripening [36] – the mechanism by which large droplets grow while small droplets dissolve – and/or coalescence of droplets upon encountering via diffusion [37]. Since the diffusion of protein complexes in the cytoplasm is strongly suppressed [38], we will ignore droplet diffusion and coalescence completely here and focus on Ostwald ripening. The phenomenon of Ostwald ripening is caused by 1) the Gibbs-Thomson effect that dictates that the solute concentration () outside a large droplet is smaller than that outside a small droplet (Eq. (7)); and 2) the dynamics of the solute in the dilute medium is well described by diffusion (Eq. (5a) with ). These two effects combined lead to diffusive fluxes of solute from small droplets to large droplets and thus eventually a single droplet survives in a finite system [36].
Surprisingly, Ostwald ripening can be suppressed when non-equilibrium chemical reactions are present () [39, 10, 13]. The physical reason lies in the new diffusive fluxes set up by the chemical reactions (Fig. 2). For instance, is highly concentrated inside the droplets, and gets converted to continuously in the interior. At the steady-state, the depletion of inside the droplet has to be balanced by the influx of from the outside medium. Intuitively, we expect that the depletion of inside a droplet to scale like the droplet volume (), and the influx of through its droplet boundary to scale like the surface area (). Taken together, we can see that as increases, the depletion rate of a droplet will eventually surpass the influx of molecules from the medium and thus the growth will stop at a steady radius. As a result, multiple droplets of around the same size can co-exists in the system. We note that the above argument, although qualitatively correct, ignore pre-factors that also depend on the droplet radius , which means that the quantitative calculation is more involved. Indeed, the influx of actually scales like instead of [13].
3.1 Theoretical results summary
We now briefly summarize results from Ref. [13] for the stability of our multi-droplet system at steady-state. The overall concentration of and in the whole system, denoted by and respectively, are controlled solely by the chemical reaction rates:
| (12) |
where we recall that is the overall concentration of SG constituent molecules, whether phase-separating or soluble. In particular, depends on the chemical reaction rate constants , the ATP concentration as well as the model under consideration (A, B or C, Eqs (2)–(4)). The qualitative behavior of the system can be categorized into regimes based on the magnitude of the droplet radius relative to the gradient length scale (Eq. (11)).
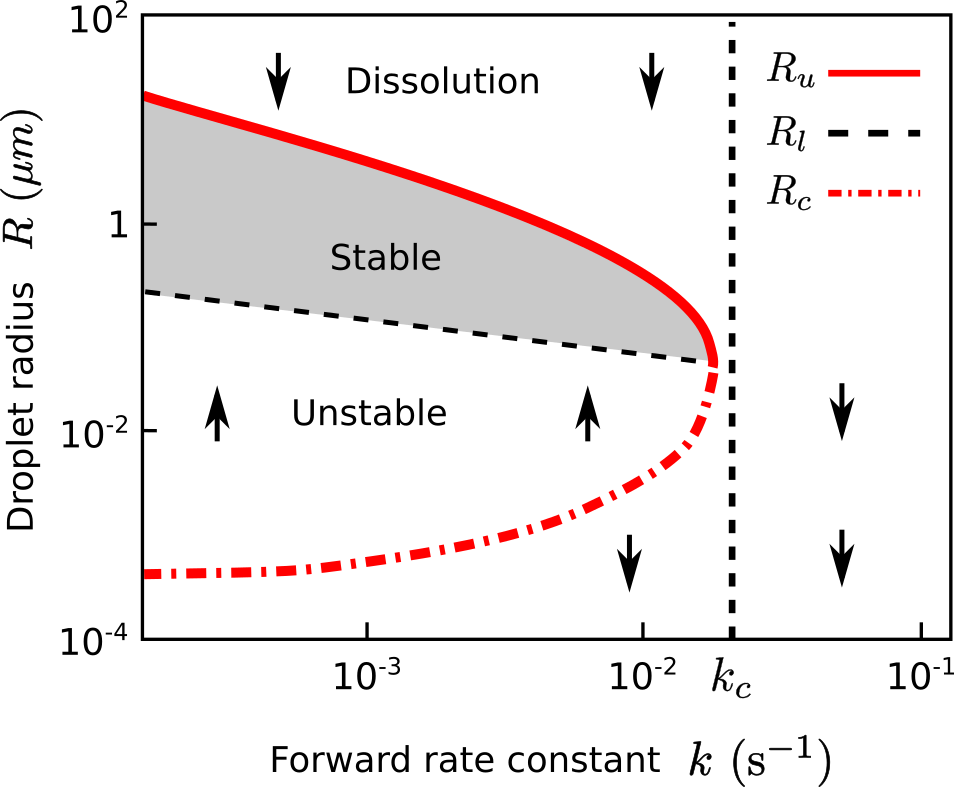
In the small droplet regime (), the stability diagram of a monodisperse multi-droplet system, obtained from [13], is shown in Fig. 3 for varying droplet radius , forward rate constant , and at fixed backward rate constant . The droplet number density is variable in this figure, and depends on the nucleation process and potentially the coarsening kinetics. Droplet stability depends on the droplet radius relative to the critical radii [13]:
| (13) |
Droplets whose radius is smaller than the nucleus radius (red irregular dashed line in Fig. 3) are thermodynamically unstable and dissolve. For (black dashed line) the system is unstable against Ostwald ripening and the average droplet radius increases with time (upward arrows). Hence, for , the system behave qualitatively like an equilibrium system (without chemical reactions). On the contrary for (continuous red line, grey region), a mono-disperse system is stable against Ostwald ripening, and for droplets shrink (downward arrows). The forward rate constant is bounded by the critical values :
| (14) |
If all droplets dissolve due to the high conversion rate of phase-separating states into soluble states (Eq. (1)). If droplet radii may be comparable or larger than . Therefore the system enters the large droplet regime where the relations in Eq. (13) do not apply and Ostwald ripening may not be arrested. The interested reader is referred to [13] for a detailed analysis of this regime.
We will now employ the formalism discussed to study the behaviour of the three minimal models introduced in Sec. 2.
4 Model selection
4.1 Model B
We will start with model B. In this model, ATP drives the to conversion (i.e., and , Eq. (3)). As such, a reduction in ATP will naturally suppress this conversion and thus lead to a decrease in and restrain phase separation. Therefore, depleting ATP cannot promote SG formation. As a result, we can eliminate this model since it contradicts our first biological constraint (Sec. 1.1).
4.2 Model C
In model C, ATP drives both conversions (i.e., and , Eq. (4)). As a result, the overall concentrations and are independent of (Eq. (12)). However controls the multi-droplet stability as we shall see. We can distinguish qualitatively distinct regimes for model C depending on the relative magnitude of and the parameters
| (15) |
4.2.1 regime.
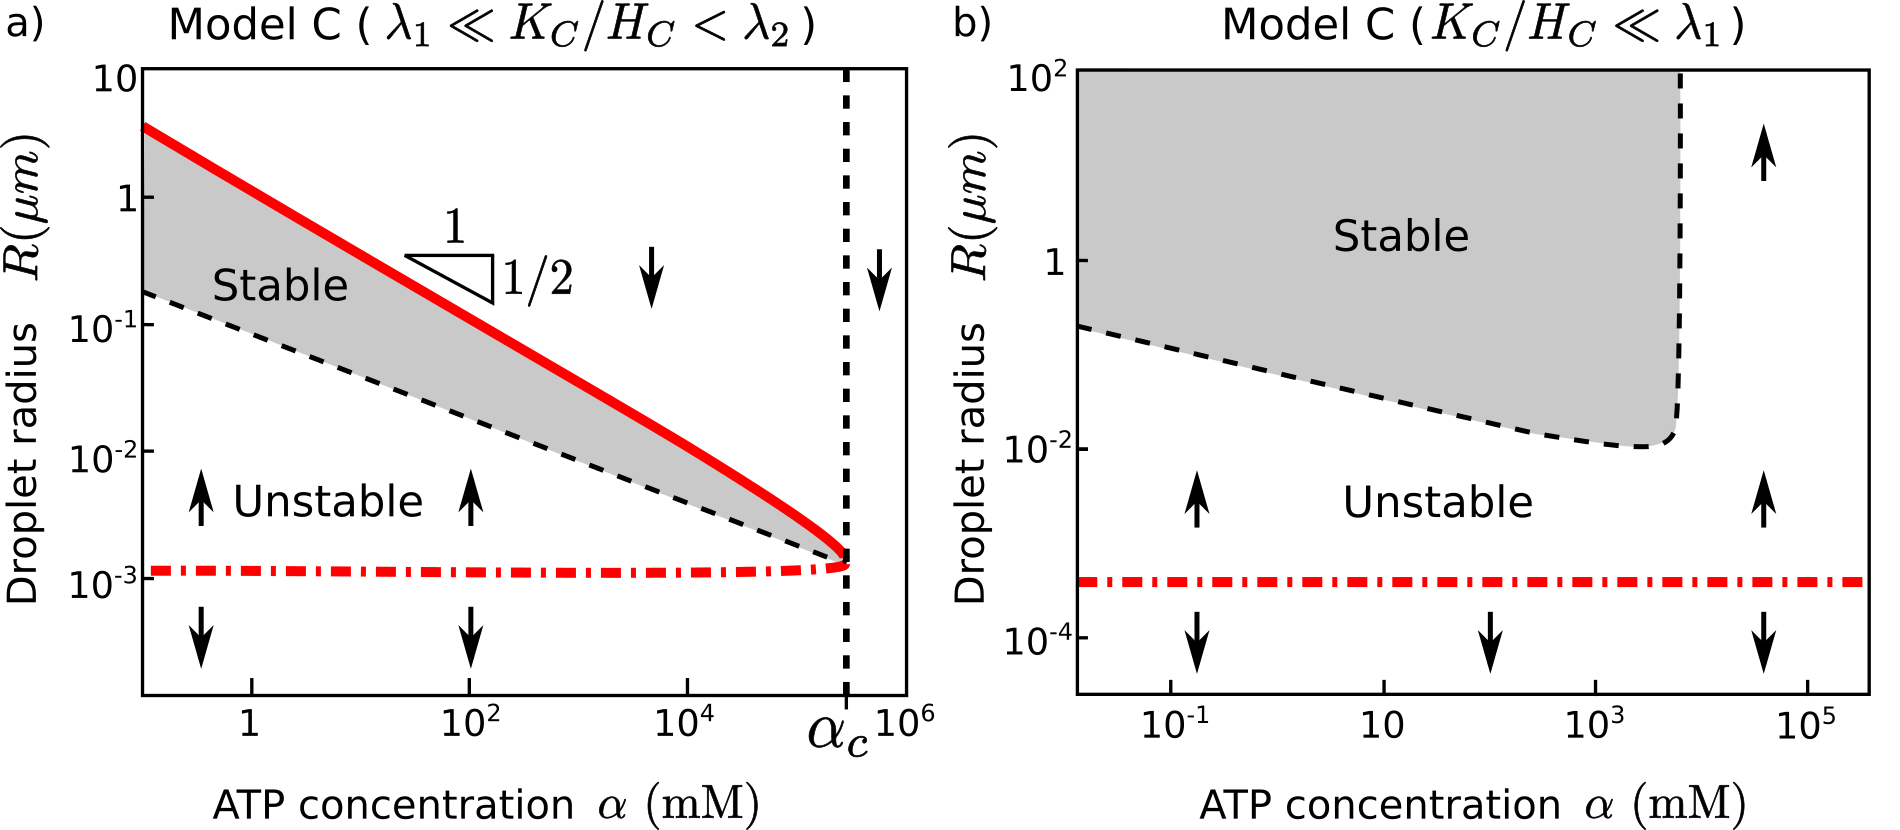
4.2.2 regime (Fig. 4(a)).
In this regime, using Eqs (4), (14) and (15) leads to , so droplets can form in the small droplet regime. The multi-droplet stability is described by Eq. Eq. (4) and (13). As shown in Fig. 4(a), droplets tend to shrink as the ATP concentration increases, and droplets dissolve below the nucleus radius (Eq. (13), red irregular dashed line). Systems with droplets larger than are unstable against Ostwald ripening leading to an increase of the average droplet size (upward arrows). Above the critical radius (black slanted dashed line) there is a region where monodisperse systems are stable (grey area) and this region is bounded by the maximal radius (red continuous line) such that droplets larger than shrink (downward arrows). Specifically, has the following form (Eqs (4), (12) and (13)):
| (16) |
and we therefore find the scaling form:
| (17) |
Namely, a fall of increases the size of stable SG, thus satisfying our first constraint discussed in Sect. 1.1. However, the scaling of the maximal droplet radius with the ATP concentration is sub-linear. For instance, to decrease the maximal SG radius by two-fold, a four-fold increase in the ATP concentration is required. Therefore, depletion of ATP according to the scaling relation in Eq. (17) alone cannot account for the switch-like behaviour, which is our second biological constraint.
However, we cannot yet rule out this model because of another intriguing feature of this type of non-equilibrium phase-separating systems. When is greater than a critical value , even though the overall concentrations and remain constant, one can still eliminate droplets completely by quenching the stable radii below the nucleus radius () (Eq. (13)). An estimate of an upper bound of can be given by the smallest granule observed, which we take to be of the order 100 nm [16]. As we demonstrate in A.1, the scaling law (Eq. (17)) remains valid until so we can use it to estimate the maximal SG size that would form upon varying by a factor of two in the vicinity of . As a conservative estimate, if we assume that the tip of the phase boundary where (Fig. 4(a)) corresponds to the ATP concentration in normal conditions, and that the corresponding droplet size is , then a reduction of 50% of can only lead to a maximal SG radius of around according to the upper bound law . This radius is too small compared to experimental observations (Sec. 1.1) and we thus rule out model C in this regime.
4.2.3 regime (Fig. 4(b)).
In this regime, we find from Eqs (4), (14) and (15) that , therefore droplets may be larger than the gradient length scale (Sec. 3.1). As shown in Fig. 4(b), the ATP concentration also controls the droplet stability but droplets have unbounded radii. In addition, irrespective of , an existing droplet emulsion either remains stable (grey region), or droplets coarsen via Ostwald ripening (upward arrows), i.e., droplets do not dissolve away. Since one cannot control droplet assembly and dissolution based on the magnitude of we can eliminate model C in this regime as well.
In summary, we have shown that model C does not provide the switch-like response compatible with our second biological constraint (Sec. 1.1). We can therefore rule out this particular model.
4.3 Model A
In model A only the forward reaction rate is amplified by an increase of the ATP concentration and the backward rate is constant (i.e., and , Eq. (2)). We can again distinguish two qualitatively distinct regimes, depending on the magnitude of relative to the parameter
| (18) |
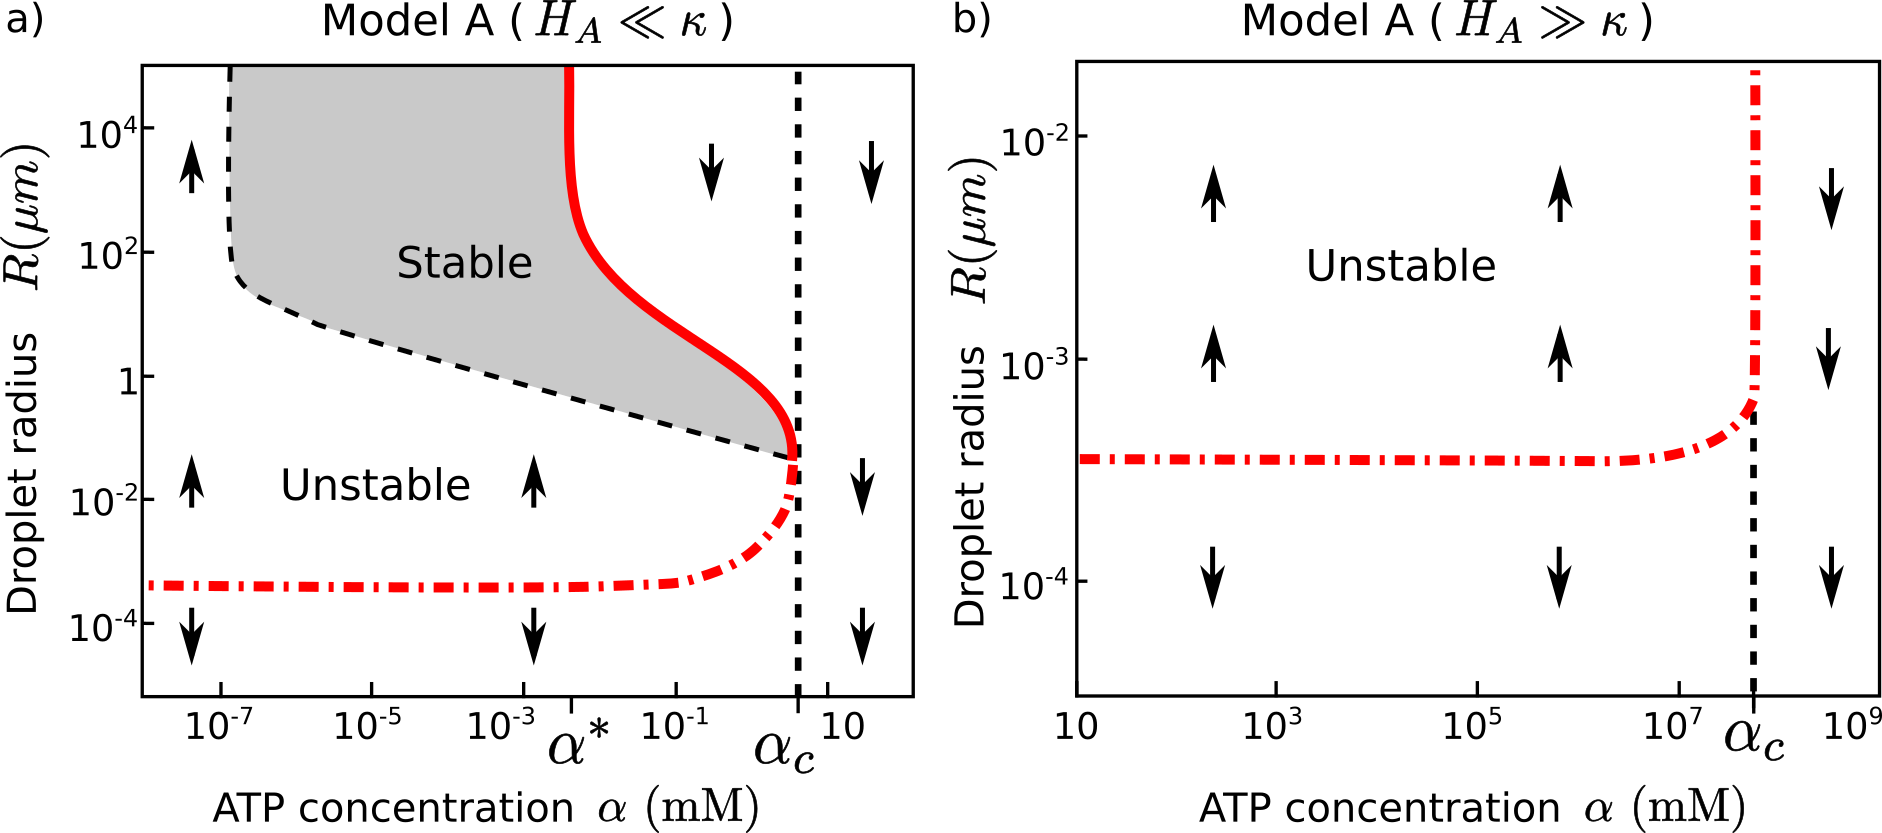
4.3.1 regime (Fig. 5(b)).
In this regime, it can be shown that the nucleus radius (Eq. (13)) is necessarily larger than the gradient length scale (Eq. (11)). Therefore, since stable droplets are always larger than the nucleus, all droplets are also larger than and the system is in the large droplet regime (Sec. 3.1). As shown in Fig. 5(b), Although there exists a critical ATP concentration beyond which all droplets dissolve (vertical dashed line), a multi-droplet system is always unstable and coarsen via Ostwald ripening (upward arrows). This is not a desirable feature for the formation of stable cytoplasmic organelles and we therefore discard model A in this regime.
4.3.2 regime (Fig. 5(a))
.
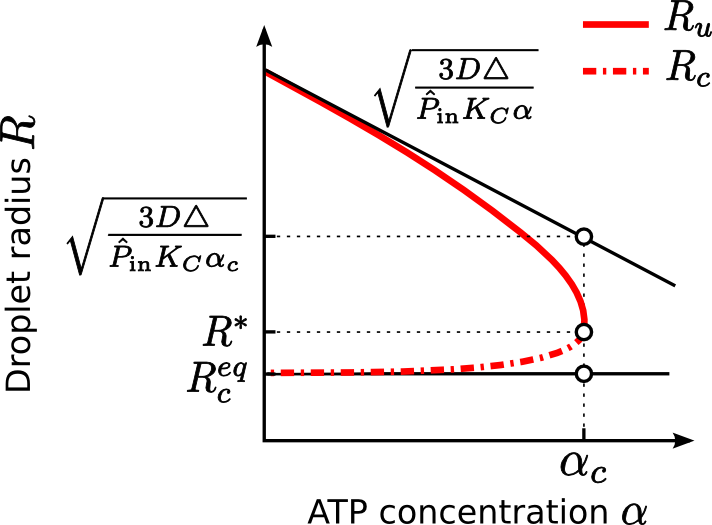
As can be seen on Fig. 5(a), two qualitatively distinct regions can be distinguished based on the ATP concentration . When is much smaller than the critical value (Eq. (15)), it can be seen from Eqs (2), (14) and (15) that . Hence large droplets may exist in the system (Sec. 3.1) and no upper-bound radius exists.
If on the contrary , then so the system is in the small droplet regime (Sec. 3.1). Therefore, the nucleus radius (red irregular dashed curve), the instability-stability transition radius (black dashed curve) and the maximal droplet radius (continuous red curve) are well approximated in this region by Eq. (13). In particular, Using Eqs (2), (12) and (13), the expression of the maximal droplet radius is given by:
| (19) |
Similar to Model C with (Sec. 4.2.2), the maximal droplet radius decreases with the ATP concentration . A major difference however, is that the shrinkage is more pronounced due to the additional in the denominator of (Eq. (12)). This is due to the fact that increasing accelerates the conversion , but not the reverse reaction. This leads to a reduction of the overall concentration of phase separating-material in the system (Eq. (12)).
When is greater than the critical value (vertical dashed line), (Eq. (14)) and all droplets dissolve (). This is due to the system being driven outside the phase-separating region by the chemical reactions (, Fig. 1(b), ‘’ symbol). We find the expression of by solving :
| (20) |
As a result, in model A droplet dissolution can be achieved by depleting to the extent that the system crosses the equilibrium phase boundary. This suggests a stronger response than in model C which we quantify in A.2. In particular we show that the ratio for does not have to be of order as in model C but is a function of the system parameters and . Therefore in the regime of model A, droplets can be formed in a switch-like manner by a two-fold decrease of , satisfying both our biological constraints (Sec. 1.1).
In summary, we conclude that among the three minimal models introduced, model A in the regime is the best suited to describe the physics of ATP-triggered SG formation.
5 Model comparison to experimental observations
We are now left with a unique model, Model A with the backward rate constant such that (Eq. (18), Sec. 4.3.2). Using physiologically relevant parameters determined in B we now compare our model predictions to experimental observations on SG.
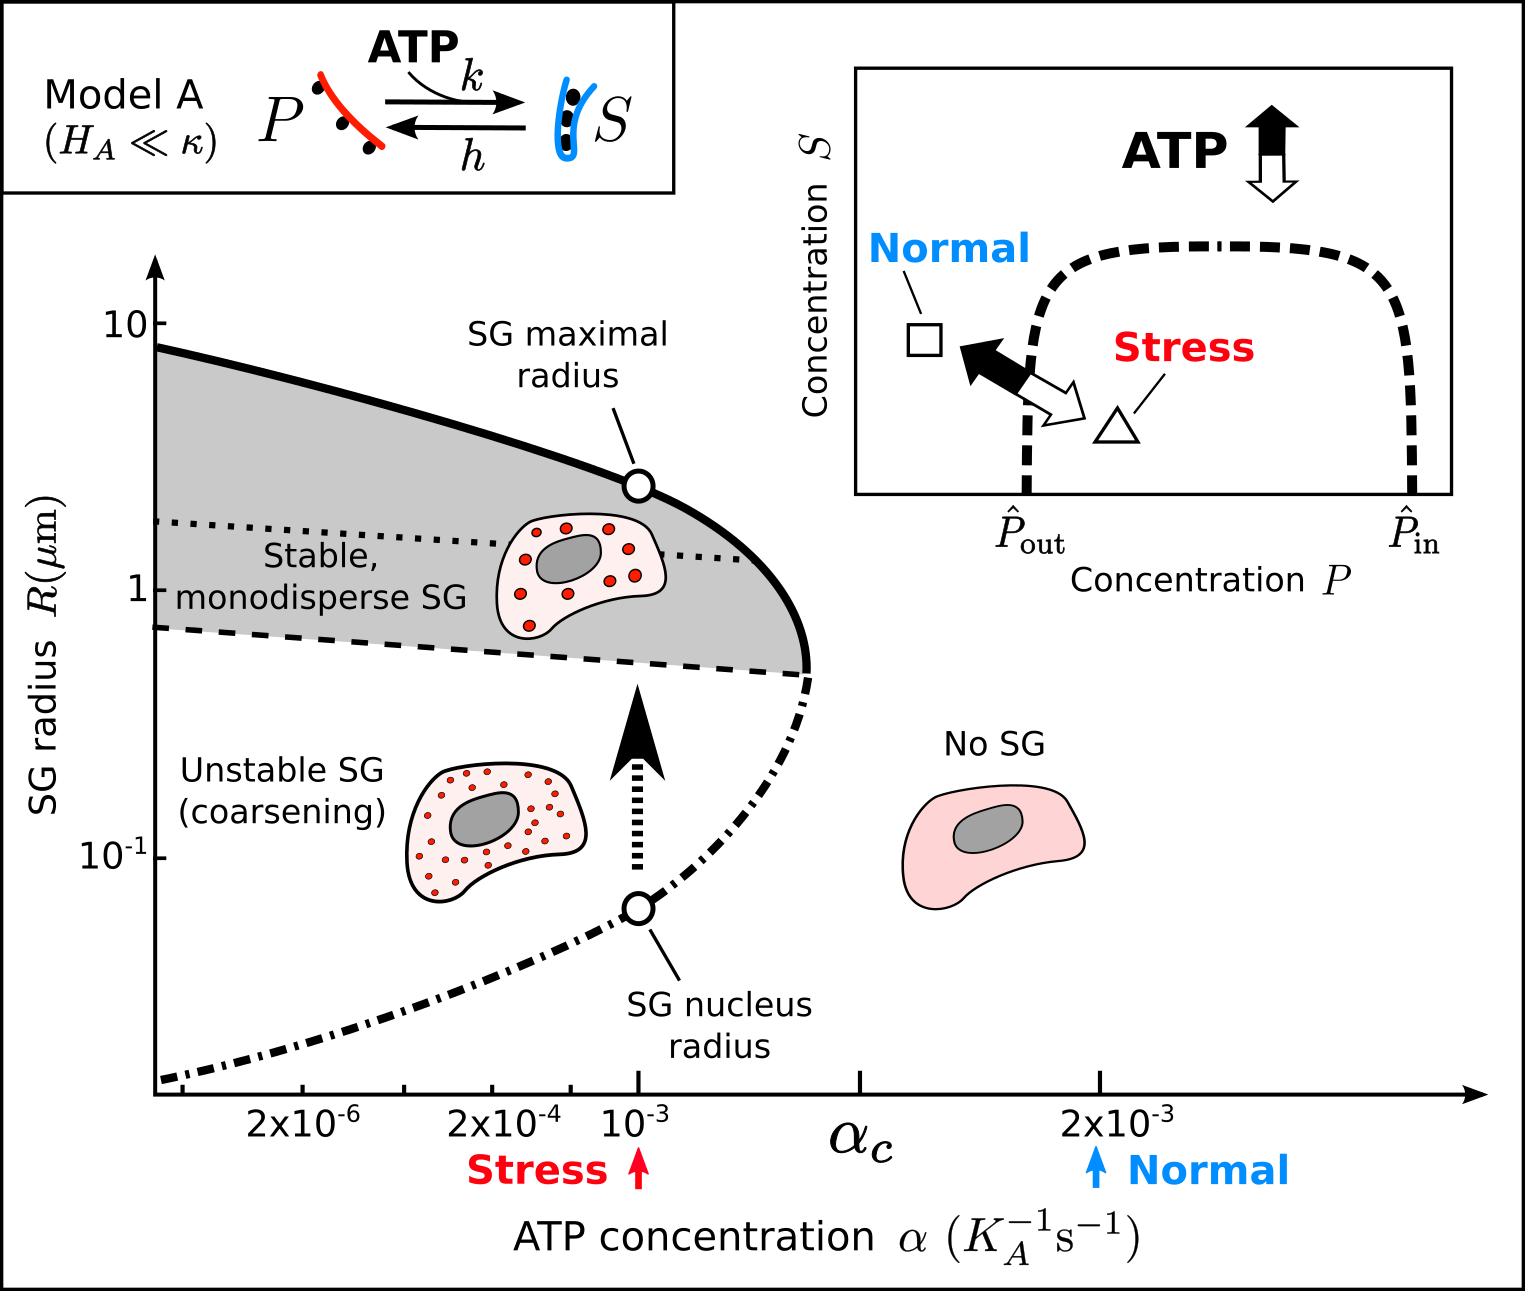
5.1 SG steady-state
We show in Fig. 6 the SG stability diagram for varying ATP concentration and droplet radius . In normal conditions is at its basal value (blue arrow) leading to a low overall concentration of phase-separating material. As a result, the system is outside the phase-separating region (, ‘’ in the insert figure) and no droplets can exist. During stress conditions, ATP decreases two-fold (red arrow) leading to an increase of , thus taking the system inside the phase-separating region (, ‘’). SG form via the nucleation of small droplets of radius . Nuclei then grow and/or coarsen (upward black arrow) leading to stable SG with much larger radii, between and (grey region), depending on the number of nucleated droplets. The relationship between the number of nucleation events and the radius of stable SG will be investigated in Sec. 5.3. We note that as ATP increases and crosses the dissolution point (Eq. (20)), the radius of the smallest stable droplet deceases from to . Therefore our model predicts that during normal conditions SG do not only shrink below detectable levels but fully dissolve.
We thus find that the two biological constraints that SG must form when the ATP concentration decreases by two-fold, and in a switch-like manner (Sec. 1.1), are both satisfied. Furthermore, the quantitative predictions for the stable SG radii are consistent with experimental observations. Therefore, model A reproduces salient experimental observations of SG formation and dissolution based on the ATP level.
5.2 Stability of SG shape
Chemical reactions may destabilize the spherical shape of large droplets, leading to deformation or division into smaller droplets. This phenomenon, studied in a binary mixture [43] (, and no cytoplasm), is caused by the gradient of the concentration being more pronounced near bulging regions, leading to a larger influx of molecules in these regions. Hence, bulging regions grow by accumulation of material , while depressed regions recede. This accentuates the shape deformation and can cause droplet division.
The concentration profiles in our ternary system (with cytoplasm), in the regime relevant for SG formation (, Sec. 4.3.2), are identical to the profiles in the binary case [13]. We can therefore extend the results from [43] to our system and determine the radius above which the droplet spherical shape becomes unstable:
| (21) |
Using the parameters determined in B we show in Fig. 6 (dotted line). If SG are sufficiently large and the ATP is sufficiently depleted, droplets may deform and/or divide. We note however that, to our knowledge, no experimental work reported significant SG deformation or division during the stress phase.
So far we have restricted our analysis to the steady-states and stability of SG and ignored the dynamics of SG formation, which we will now analyse.
5.3 SG growth and coarsening dynamics
Let us consider the small droplet regime, which is the relevant regime for SG formation (model A with , Sec. 4.3.2). As demonstrated in C, the dynamics of droplet growth far from the steady-state is identical to that in an equilibrium system, i.e. without chemical reactions but with the same amount of and . The dynamics of SG formation can therefore be approximated by the dynamics of a multi-droplet system in equilibrium conditions (Sec. 3), with the additional constraint that Ostwald ripening (OR) and diffusion-limited growth (DLG) are in such a way that they are arrested for droplet radii larger than and , respectively (Eq. (13)). We ignore for simplicity the nucleus radius () and the effect of droplet deformation at large radii (Sec. 5.2). In the equilibrium regimes (DLG and OR), at large times and far from the DLG-OR transition, the dynamics of the average droplet radius is given by [44]:
| (22) |
with and . We neglect the deviation from these laws at the DLG-OR transition, and assume that the system switch from the DLG regime to the OR regime at a critical average droplet radius and time . The dynamics for is therefore obtained by using the function with the appropriate shift of the time variable so that . We obtain the following dynamics:
| (23) |
where is the solution of , and the upper-bounds to account for the stabilizing effect of the chemical reactions.
We now estimate the critical radius at the DLG-OR transition. In the DLG regime droplets grow by depleting the cytoplasm from phase-separating material . The droplet growth in this regime stops when the cytoplasmic concentration reaches the saturation concentration (Eq. (7) and Fig. 1). Since the total number of molecules is constant, is given by
| (24) |
where we used the strong phase separation approximation and where is the density number of nucleated droplets. is also equal to the droplet number density throughout the DLG regime since we have assumed that droplet coalescence does not occur in our system (Sec. 3).
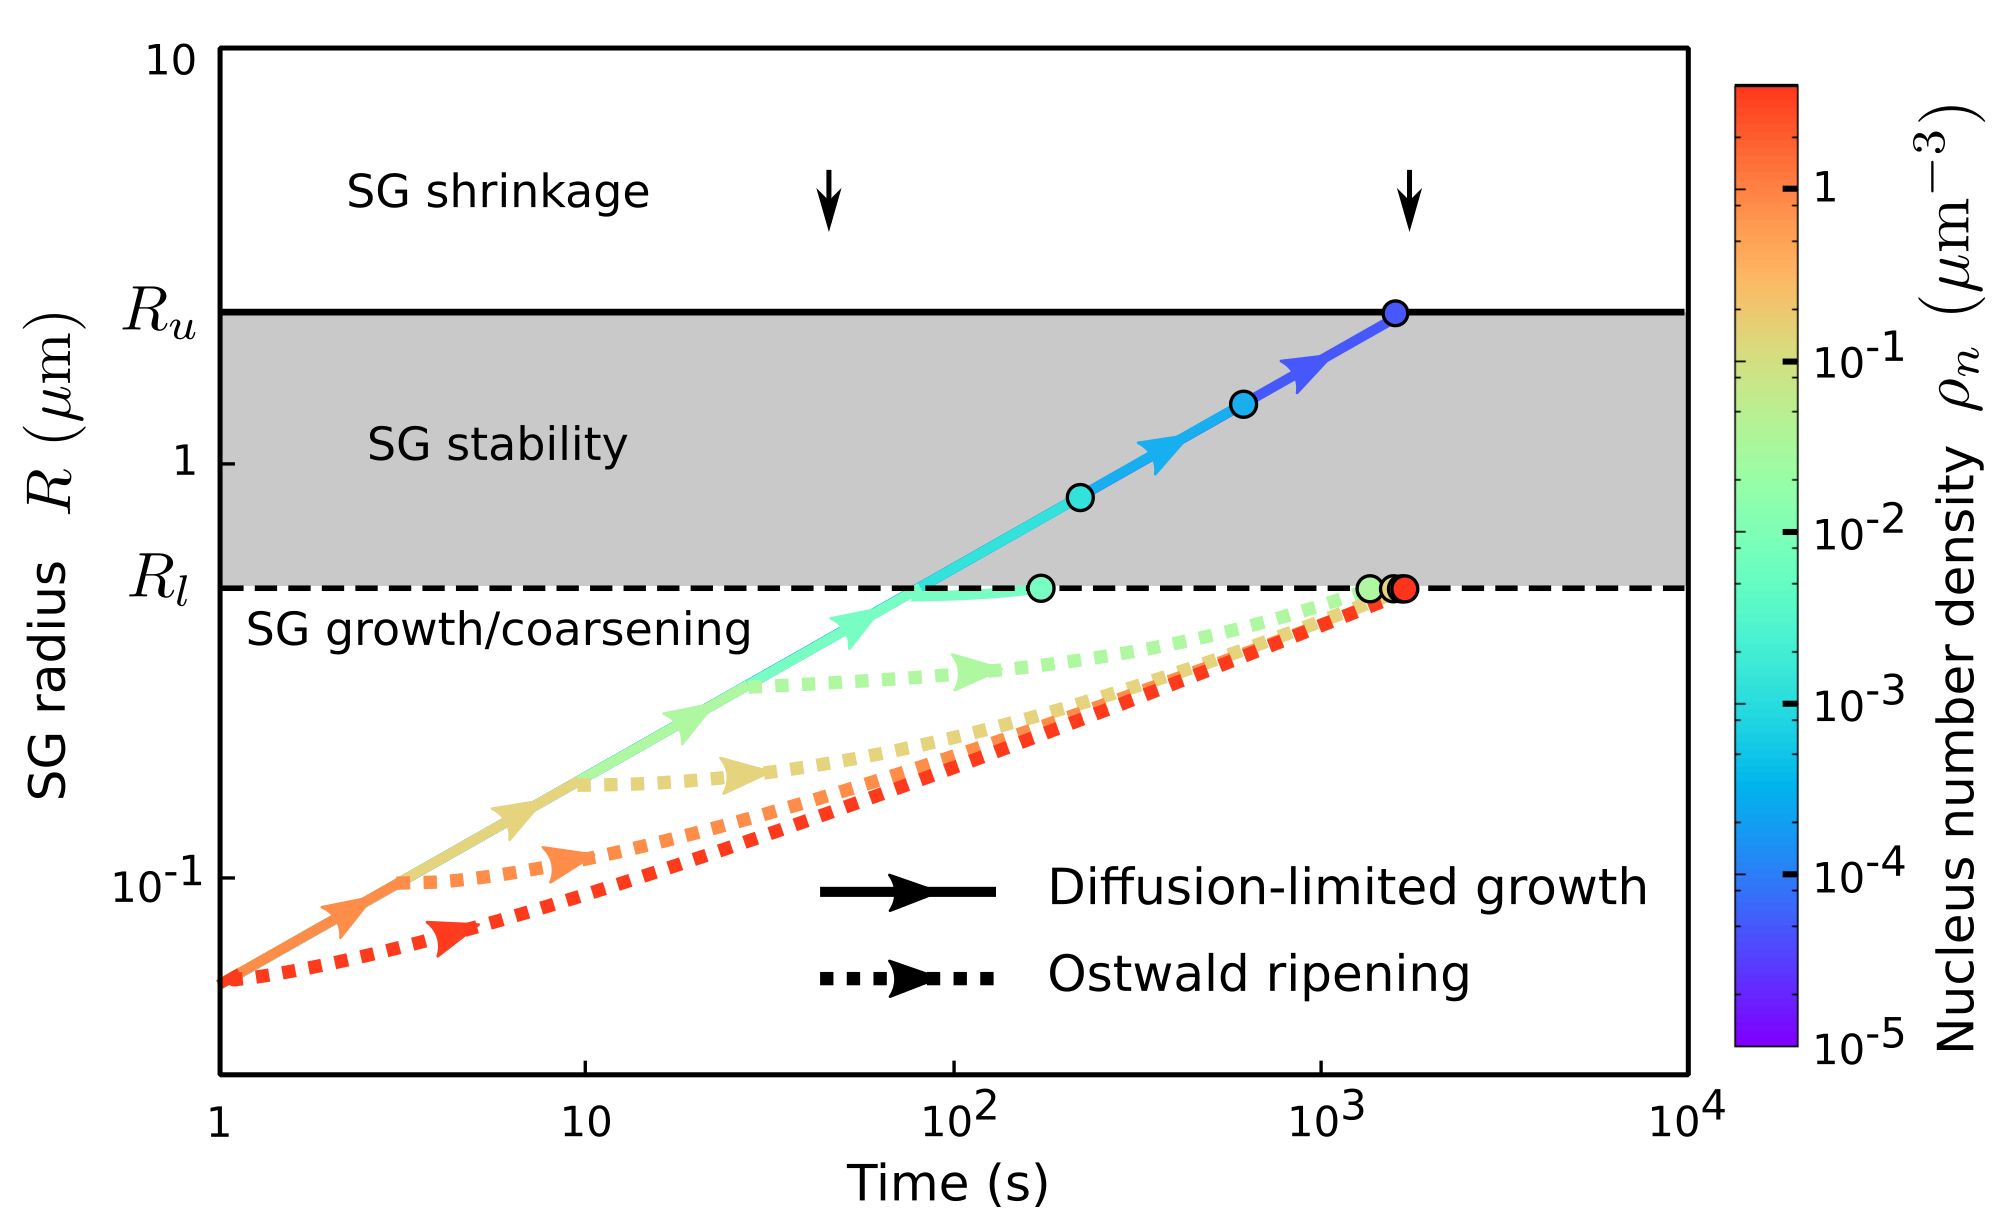
As shown in Fig. 7 for the parameters determined in B, the SG formation dynamics and the steady-state radius (coloured circles) depend on the nucleus number density . For large , droplets grow first by DLG (solid coloured lines), then coarsen by OR (dotted coloured curves). The steady-state is reached when droplet radii are equal to (vertical dashed line), above which OR is arrested. For smaller , SG radius increases by DLG until (vertical solid line) where OR is not active (grey region). Therefore the system is in a stable steady-state after the DLG. For even smaller the DLG continues until droplet radii are equal to (vertical continuous line), which is the maximal radius attainable. In this case, stable SG radii are equal to and are independent on the number of SG in the system. The critical nucleus number density below which droplets grow exclusively by DLG is the solution of (Eq. (13)):
| (25) |
Using the physiologically relevant parameters estimated in B we find .
The time needed for nuclei growing exclusively in the DLG regime () to reach the radii and are approximatively and , respectively. For nuclei growing exclusively in the OR regime (), the time needed to reach the radius is approximatively . Therefore growth by DLG and OR are both consistent with SG formation times scales.
6 Summary & Discussion
Starting from experimental observations of SG formation in the cell cytoplasm, we have formulated three minimal models based on chemical reaction-controlled phase separation to account for the appearance of SG upon ATP depletion. Applying the formalism developed in [13], we compared the models based on their qualitative features to salient experimental observations.
We eliminated model B because it does not predict SG growth when ATP concentration falls. Model C was discarded because although SG grow during ATP depletion, the response is not switch-like. Finally, we found that model A, where ATP drives only the conversion, can satisfy both biological constraints. However, we have ruled out the (Eq. (18)) regime in model A because droplets cannot be stable as they always coarsen via Ostwald ripening. Using physiological parameters (B), we elucidated a particular scenario of our model, and showed that model A reproduces salient experimental observations of SG formation and dissolution based on the ATP level. Finally we analysed the SG formation dynamics and quantified the duration of growth and coarsening, depending on the number of nucleated droplets.
A peculiar feature of model A is that under normal condition, ATP is continuously hydrolysed to keep SG from forming. Superficially, it may seem wasteful energetically. However, this is in fact not dissimilar to any insurance schemes that we are familiar with. For instance, we pay a car insurance premium every month so that when an accident occurs, the damage cost is covered. Similarly, in our model, ATP is used during normal condition so that, during stress, no additional ATP is required for SG formation. This perspective is particularly pertinent for SG regulation since the timing of environmental stresses can be unpredictable. Furthermore, due to physical constraints such as cell size, storage of ATP for a long period of time is difficult. It may therefore be desirable to have survival mechanisms, such as SG formation, that are spontaneous and do not require additional ATP consumption for the formation of SG.
Indeed, there is already experimental evidence suggesting that ATP can promote SG disassembly by ATP-dependent protein phosphorylation, via the activity of focal adhesion kinase (FAK) [45], Casein Kinase 2 [47] and dual specificity kinase DYRK3 [46]. On the other hand, while energy depletion often accompanies stress conditions [25, 26], SG formation [21] or cause SG formation [24], ATP may also be necessary to SG assembly in some situations [42] We note as well that there is substantial evidence that energy depletion-independent pathways may also exist, such as via the phosphorylation of eukaryotic initiation factor alpha (eIF2-alpha) [48]. Given all these evidence, the cell seems to have multiple mechanisms to ensure SG assembly and disassembly at stressful times [23] and our work may describe a particular pathway of SG regulation. Nevertheless, the virtue of our model is that it leads to specific predictions that can be tested experimentally, which we will now enumerate.
6.1 Predictions
Our model provides the following experimental predictions:
-
1.
Since the reaction is the one that requires the input of ATP, it is natural to relate the conversion to the ubiquitous ATP-driven phosphorylaton reaction. In other words, our model suggests that the soluble state of the SG assembling constituents corresponds to the phosphorylated form of these constituents.
-
2.
We predict the existence of a concentration gradient of the phase-separating constituent outside the SG, with the gradient length scale of the form
(26) Using biologically relevant parameters determined in B we find , which is relevant in the context of the cell.
- 3.
-
4.
Finally, if ATP is depleted beyond physiological conditions and SG are large enough (small droplet number density), we predict non-spherical SG or SG splitting due to shape instabilities (Sec. 5.2).
The first prediction may be tested by screening the purified constituents of SG in an in vitro setting. The second, third and fourth predictions can be tested using imaging techniques with well regulated ATP concentration either in vivo or in vitro.
Appendix A Largest SG to nucleus size ratio close to the droplet dissolution point
In model A for and model C for we have seen that there exists a critical ATP concentration beyond which no droplets can exist, and below which droplets can nucleate from a minimal radius and grow until they reach their stable radius that is upper bounded by . Therefore one can control droplet formation and dissolution via small variations of in the vicinity of (Figs 4(a) and 5(a)). From experimental observations we know that during stress vary by two-fold and , providing a constraint on our modelling (Sec. 1.1). Here we examine this constraint by quantifying the size ratio in the vicinity of .
We consider a single droplet of radius growing in a large system, such that the concentration far from the droplet is not affected by the presence of the droplet. Therefore the supersaturation in the cytoplasm is constant: . We seek the nucleus and maximal droplet radii and in this single-droplet system, which are identical to those in a multi-droplet system. When droplets are much smaller than the gradient length scale which is true in the regimes under consideration, the net flux of molecules at the droplet’s interface is composed of an influx from the medium and an out-flux due to the chemical conversion inside the droplet that depletes [13]:
| (28) |
where the supersaturation is set by the chemical reaction rates (Eq. (12)):
| (29) |
The droplet grows when and shrink otherwise. At equilibrium ( but is still defined by Eqs (2) or (4)) there is a unique fixed point radius ():
| (30) |
is unstable () and is the nucleus radius at equilibrium (): smaller droplets dissolve while larger droplets grow.
When chemical reactions are switched on (), Eq. (28) admits two fixed points, shown in Fig. 8 for varying . For small we can neglect the reaction term () and find the unstable fixed point, or nucleus radius,
| (31) |
and for large we neglect the surface tension term () and find the stable fixed point.
| (32) |
Additionally there exist a critical rate above which no fixed points exist and for all meaning that all droplets dissolve.
We will now examine these results in model A and C, seeking for the ratio for .
A.1 Model C
In model C, and (Eq. (4)) so the ratio and are constant. Therefore and we recover Eq. (17). Since this scaling is sub-linear we saw that it cannot explain SG formation and dissolution upon small variations of . However when approaches the separation between and becomes small so the above approximations cease to be valid and a strong response regime exists: small variations of lead to strong variations of and ( in Fig. 8).
Qualitatively, it can be seen from Eq. (28) that since we omitted the term in the determination of we have overestimated , and since we neglected the term in the determination of we have underestimated . Therefore the exact value of is bounded from above by while the exact value of is bounded from below by (Eq. (30)). The ratio in the strong response regime is therefore also bounded (see Fig. 8):
| (33) |
At the two fixed points and intersect at the radius and since and are unstable and stable fixed points, respectively, we have
| (34) | |||||
| (35) |
and solving for gives
| (36) |
Using Eqs (4), (29) (33) and (36), we then find
| (37) |
In other words, the size of the stable droplets and nuclei are of the same order. This shows independently of the system parameters that the strong response regime in model C cannot account for the switch-like response observed experimentally.
A.2 Model A
We now concentrate on model A. Here the supersaturation is no more constant since only the backward rate is constant (i.e. , ):
| (38) |
Therefore there exist a critical ATP concentration above which and all droplets dissolve (, Eq. (32)). The expression of is found by solving :
| (39) |
We define and the ATP concentrations during normal and stress condition, respectively, in agreement with the biological constraint that ATP is depleted two-fold during stress conditions (Sec. 1.1). Moreover we assumed these concentrations to be equidistant from for simplicity. During normal conditions so no droplets can exist (). During stress condition and using Eqs (31),(32), (38) and (39), we find the size ratio during stress conditions:
| (40) |
Therefore we find that in model A and contrarily to model C, the size ratio between stable droplets and nuclei is function of the system parameters and can be arbitrarily large. This can potentially provide the switch-like response observed experimentally which we discuss quantitatively in Sec. 5.1 using physiologically relevant parameters.
Appendix B Determination of model parameters
Focusing on model with the backward reaction rate constant such that regime, we now combine theory and SG experimental observations to determine the model parameters. As was done in A, let us denote the ATP concentration during normal conditions, so that the ATP during stress condition is . For SG to form during stress and dissolve during normal conditions, we must have , where is the critical ATP concentration above which SG dissolve (Eq. (20) and Fig. 5(a)). For simplicity we assume that is in the middle of the interval, i.e . We thus find the expression of the ATP concentration during normal conditions from Eqs (12) and (20):
| (41) |
B.1 Fluorescence recovery after photobleaching (FRAP)
We employ fluorescence recovery after photobleaching (FRAP) experiments [49] to estimate the diffusion coefficient of SG proteins. In these experiments a specific protein is tagged with a fluorescent marker, so that the local concentration of protein-marker is correlated with the local intensity of the fluorescence emission. A photobleaching laser beam is used to eliminate the fluorescence in a small region. Over time, the intensity in this region recovers as the non-fluorescent protein-markers are gradually replaced by fluorescent protein-markers, due to diffusion or other transport mechanisms. Assuming free diffusion of the protein-marker, the diffusion coefficient is given by with the half-time of fluorescence intensity recovery and the radius of the bleached region [49].
We now consider FRAP results on TIA proteins. TIA proteins are key SG constituents, triggering SG formation when over-expressed, and inhibiting SG assembly when depleted [50]. Moreover TIA proteins harbor an intrinsically disordered domain, a class of protein domains that have raised recent interest for its ability to form phase-separated liquid droplets [51]. Hence, TIA protein is a prime candidate to explain SG formation based on phase separation.
FRAP experiments on TIA proteins show that the intensity of a bleached cytoplasmic region of radius recovers with a half-time [33]. This leads to the protein diffusion coefficient
| (42) |
Interestingly, the half-time recovery in experiments where a SG is bleached are roughly similar [33]. This indicates that SG proteins are highly mobile inside SG and supports our approximation of identical protein diffusion coefficients inside and outside SG (Eqs (5a) and (5b)). We note that such experiments are more complicated to interpret than cytoplasmic FRAP, because of the added parameters influencing the recovery time, such as the concentration ratio between SG and cytoplasm.
B.2 Robustness of the model against concentration fluctuations
The global protein concentration in a cell is subject to fluctuations [52]. This can result in an increase of the overall concentration of SG constituent molecules, and potentially trigger undesired SG formation during non-stress conditions. This is due to the subsequent increase of the overall concentration of phase-separating states (Eq. (12)), driving the system inside the phase-separating region (, Fig. 1). Let us define the concentration of SG constituents such that, during normal conditions (), is identical to its value during stress conditions (), thereby leading to undesired SG formation. In other words is the solution of (Eq. (12) and (2)). The ratio should be large enough to prevent SG formation in normal conditions. From the definition of and Eqs (12) and (41) we find:
| (43) |
The ratio is an increasing function of , and reaches a plateau for (continuous purple line in Fig. 9). Note that if the system does not phase separate, since in this case (Eq. (12), Fig. 1). If then and even small fluctuations of cause unwanted SG formation. This scenario is not physiological and we discard it. If on the contrary then . In this case, a two-fold increase of is necessary to bring to its stress value. This scenario is therefore robust against concentration fluctuations. This prediction is consistent with experimental observations showing that a three-fold increase of the concentration of a given SG protein triggers SG formation [53]. Therefore we must impose:
| (44) |
We will see in B.4 that is also maximally bounded.
B.3 Partitioning coefficient
We use experimental results on TIA partitioning coefficient, i.e. the concentration ratio between SG and cytoplasm, to constrain further the model parameters. The combined concentrations of inside and outside a SG of radius are given by and , respectively [13], and we recall that is the concentrations of states at the droplet interface (Eq. (8)). Note that the combined concentration of are homogeneous inside and outside, unlike the individual concentrations of and (Eq. (10) and Fig. 2). The partitioning coefficient is therefore given by
| (45) |
The value of depends on the model parameters and the number of droplets in the system, and is bounded as follows [13]:
| (46) |
This result with Eqs (41) and (44) leads to and . Experimental observations on the partitioning coefficient of TIA proteins is of order 10 [33], leading to the following constraint on the concentration parameters:
| (47) |
B.4 Size ratio between SG nuclei and mature SG
From experimental observations we know that mature SG are much larger than the SG nuclei (Eq. (13)) (Sec. 1.1). Since is the radius of the largest possible SG (Eq. (13)), the radius ratio between mature SG and nuclei is upper-bounded as follow:
| (48) |
Using the expression of obtained in A (Eq. (40)), and imposing the constraints from Eqs (41), (44), and (47) on the ratio , we find
| (49) |
In B.2 we have shown that must be true to ensure robustness of the model against concentration fluctuations. Here we see that cannot be arbitrarily large since would approach 0, as shown in Fig. 9 (green dashed line). In order to ensure both model robustness against concentration fluctuations and large radius ratio between mature SG and SG nuclei, we choose the following constraint (dotted vertical line in Fig. 9)
| (50) |
Note that since is also a function of other model parameters (), the value of could in principle be much larger than , as long as the other parameters are adequate. We will see however that using physiologically relevant parameters determined in this section, the predicted ratio is consistent with experimental observations. Therefore taking much larger than would lead to an unrealistically small ratio . This supports our choice in Eq. (50).
B.5 SG formation and dissolution time scales
In our model SG form and dissolve in response to changes of the overall concentration of the phase-separating states. To be consistent with experimental observations, the predicted time scales at which varies must be shorter than the SG formation and dissolution time scales. This imposes constraints on the reaction rate constants and (Eq. (LABEL:eq:NJP:dPdt)). Let us assume for simplicity that the variation of occurs at constant ATP concentration . With being the only time-dependent variable in Eq. (LABEL:eq:NJP:dPdt), we can solve and we find
| (51) |
with functions of the parameters . The time scale at which reaches chemical equilibrium is given by the inverse of . Since the ATP concentration varies only by a factor 2 between stress and normal conditions (Sec. 1.1), the increase and decrease of occur on a similar time scale , with the ATP concentration during normal conditions (Eq. (41)). This is consistent with the experimental observations that SG formation and dissolution times are within the same order of magnitude.
As a rough estimate, must be smaller than the SG formation/dissolution time. Taking this time scale to be 15 minutes we get . Since (from Eqs (41) and (44)) we obtain . Taking an unnecessary large value of would lead to an ATP consumption that is unnecessary high. We therefore choose a conservative value of , just large enough to ensure that the time scale of variation is fast enough:
| (52) |
We note that this rate constant is consistent with typical rates of protein phosphorylation [54, 55], which is the prototypical ATP-dependent reaction for protein post-transcriptional modification [30]. Using this result with Eqs (41) and (50) we find the backward reaction rate constant:
| (53) |
B.6 Nucleus radius
The capillary length can be estimated from the expected SG nucleus radius . The expression for is given by Eq. (13):
| (54) |
where we used the ATP concentration during stress: . Enforcing the constraints from Eq. (41) and (44) we find
| (55) |
The SG nucleus radius is necessarily smaller than the radius of the smallest detectable SG (). On the other hand, there exist indications that SG are nucleated via heterogeneous nucleation involving RNA as seeding platforms [34, 35]. This implies that SG must reach a critical size before they become thermodynamically stable. Therefore SG nuclei are larger than the dimension of a single protein, which is of the order of . We choose an intermediate value, , leading to an estimation of the capillary length:
| (56) |
B.7 Summary
We have used theory and SG experimental results to determine physiologically relevant model parameters, or parameter constraints, summarized by Eqs (42), (47), (50), (52), (53) and (56). Note that the concentration parameters , the ATP concentration , and the forward reaction constant have not been explicitly expressed. Yet, the radius of the SG nucleus, and the radii and that bound the stable region (Eq. (13)) are now explicitly determined from these relations.
Appendix C Equivalence between equilibrium and non-equilibrium regimes for the early droplet growth kinetics
We consider the small droplet regime (, Eq. (11), Sec. 3.1) and show that, far from the steady-state, the droplet growth dynamics is equivalent to that in an equilibrium system, i.e. without chemical reactions but with identical amounts of and .
C.1 Small droplet number density
Let us concentrate first on the situation where the droplet number density is small, so that the inter-droplet distance is much larger than the gradient length scale . The term in Eq. (10) must be zero to prevent diverging concentration far from droplets. Applying the boundary condition Eq. (7), we obtain the concentration profile of in the cytoplasm:
| (57) |
where is the cytoplasmic concentration of far from droplets, or far-field concentration, and is the supersaturation concentration. The influx of material from the cytoplasm at the droplet interface () is
| (58) |
where we have used the small droplet condition (). In this small droplet regime the concentration inside droplet is homogeneous (). Therefore the depletion rate of material inside droplets by the chemical conversion is given by
| (59) |
We can now write the total influx of at the droplet interface:
| (60) |
where the first term accounts for the influx from the cytoplasm (Eq. (58)) and the second term accounts for the chemical conversion of into inside droplets (Eq. (59)). At small droplet radius , the reaction term () in Eq. (60) is negligible compared to the diffusive term. The droplet growth dynamics can therefore be mapped onto the growth dynamics in an equilibrium system [36], where the supersaturation is controlled by the chemical reaction rates. At small enough droplet number density, since the largest possible droplet radius, (Eq. (13)), is independent of the system size, the presence of droplets does not affect the far-field concentration . Therefore is equal to (Eq. (12)), the overall concentration of in the system. The value of the supersaturation is therefore equal to that in equilibrium condition, in the diffusion limited growth regime () [44].
C.2 Small droplets number density
If the droplet number density is large so that the inter-droplet distance is small compared to , we can neglect the effect of the chemical reactions on the profiles and we recover the equilibrium profile [36]:
| (61) |
This result can be verified by expanding Eq. (10) for the small parameters and where is the inter-droplet distance, and by imposing the boundary conditions Eqs (6)-(9). Similarly as in C.1 the depletion rate of inside droplets is given by Eq. (59) and therefore the total influx of at the droplet interface is given by Eq. (60). Again, for small droplet radius the reaction term in 60 is negligible and the droplet growth dynamics can be mapped onto an equilibrium growth. Since the cytoplasmic profile is identical to that in an equilibrium system (Eq. (61)), the same must be true for . Therefore the droplet growth dynamics is identical to that at equilibrium condition, and if the number of droplet is large enough, is small and the system undergoes Ostwald ripening [44].
These equivalences between equilibrium and non-equilibrium regimes allow us to estimate SG growth dynamics far from the steady-state (Sec. 5.3).
References
References
- [1] Protter D S and Parker R 2016 Trends in Cell Biology 26 668–679
- [2] Updike D and Strome S 2010 Journal of andrology 31 53–60
- [3] Brangwynne C, Eckmann C, Courson D, Rybarska A, Hoege C, Gharakhani J, Jülicher F and Hyman A 2009 Science 324 1729–1732
- [4] Lee C F, Brangwynne C P, Gharakhani J, Hyman A A and Jülicher F 2013 Physical Review Letters 111 88101
- [5] Hyman A A, Weber C A and Jülicher F 2014 Annual review of cell and developmental biology 30 39–58
- [6] Brangwynne C P, Tompa P and Pappu R V 2015 Nature Physics 11 899–904
- [7] Bray A J 2002 Advances in Physics 51 481–587
- [8] Ivanov P A, Chudinova E M and Nadezhdina E S 2003 Experimental Cell Research 290 227–233
- [9] Zwicker D, Decker M, Jaensch S, Hyman A a and Jülicher F 2014 Proceedings of the National Academy of Sciences of the United States of America 111 E2636–45
- [10] Zwicker D, Hyman A A and Jülicher F 2015 Physical Review E - Statistical, Nonlinear, and Soft Matter Physics 92 1–12
- [11] Saha S, Weber C A, Nousch M, Adame-Arana O, Hoege C, Hein M Y, Osborne-Nishimura E, Mahamid J, Jahnel M, Jawerth L, Pozniakovski A, Eckmann C R, Jülicher F and Hyman A A 2016 Cell 166 1572–1584
- [12] Weber C A, Lee C F and Jülicher F 2017 New Journal of Physics 19 53021
- [13] Wurtz J D and Lee C F 2018 Physical Review Letters 120 078102
- [14] Wheeler J R, Matheny, T, Jain, S, Abrisch, R and Parker, R 2016 eLife 5 e18413
- [15] Ohshima D, Arimoto-Matsuzaki K, Tomida T, Takekawa M and Ichikawa K 2015 PLOS Computational Biology 11 e1004326
- [16] Anderson P and Kedersha N 2009 Current Biology 19 397–398
- [17] Aulas a, Caron G, Gkogkas C G, Mohamed N V, Destroismaisons L, Sonenberg N, Leclerc N, Parker J a and Vande Velde C 2015 The Journal of Cell Biology 209 73–84
- [18] Buchan J R and Parker R 2009 Molecular Cell 36 932–941
- [19] Kedersha N, Stoecklin G, Ayodele M, Yacono P, Lykke-Andersen J, Fritzler M J, Scheuner D, Kaufman R J, Golan D E and Anderson P 2005 The Journal of cell biology 169 871–84
- [20] Ramaswami M, Taylor J P and Parker R 2013 Cell 154 727–736
- [21] Hofmann S, Cherkasova V, Bankhead P, Bukau B and Stoecklin G 2012 Molecular Biology of the Cell 23 3786–3800
- [22] Kedersha N, Gupta M, Li W, Miller I and Anderson P 1999 The Journal of Cell Biology 147 1431–1441
- [23] Dang Y, Kedersha N, Low W K, Romo D, Gorospe M, Kaufman R, Anderson P and Liu J O 2006 Journal of Biological Chemistry 281 32870–32878
- [24] Kedersha N, Chen S, Gilks N, Li W, Miller I J, Stahl J and Anderson P 2002 Molecular biology of the cell 13 195–210
- [25] Lilly M B, Durant J R, Ng T C, Evanochko W T, Kumar N G, Elgavish G A, Glickson J D, Hiramoto R, Ghanta V and Katholi C R 1984 Cancer Research 44 633–638
- [26] Chang J, Knowlton a a, Xu F and Wasser J S 2001 American journal of physiology. Heart and circulatory physiology 280 H426–H433
- [27] Jacobs W M and Frenkel D 2017 Biophysical Journal 112 683–691
- [28] Bah A and Forman-Kay J D 2016 Journal of Biological Chemistry 291 6696–6705
- [29] Li P, Banjade S, Cheng H C, Kim S, Chen B, Guo L, Llaguno M, Hollingsworth J V, King D S, Banani S F, Russo P S, Jiang Q X, Nixon B T and Rosen M K 2012 Nature 483 336–40
- [30] Ardito F, Giuliani M, Perrone D, Troiano G and Lo Muzio L 2017 International Journal of Molecular Medicine 40 271–280
- [31] Souquere S, Mollet S, Kress M, Dautry F, Pierron G and Weil D 2009 Journal of cell science 122 3619–26
- [32] Kedersha N, Cho M R, Li W, Yacono P W, Chen S, Gilks N, Golan D E and Anderson P 2000 Journal of Cell Biology 151 1257–1268
- [33] Bley N, Lederer M, Pfalz B, Reinke C, Fuchs T, Glaß M, Birgit M and Stefan H 2017 Nucleic acids research 43 e26
- [34] Zhang H, Elbaum-Garfinkle S, Langdon E M, Taylor N, Occhipinti P, Bridges A A, Brangwynne C P and Gladfelter A S 2015 Molecular Cell 60 220–230
- [35] Altmeyer M, Neelsen K J, Teloni F, Pozdnyakova I, Pellegrino S, Grøfte M, Rask M B D, Streicher W, Jungmichel S, Nielsen M L and Lukas J 2015 Nature Communications 6 8088
- [36] Lifshitz I and Slyozov V 1961 Journal of Physics and Chemistry of Solids 19 35–50
- [37] Siggia E D 1979 Physical Review A 20 595–605
- [38] Weiss M, Elsner M, Kartberg F and Nilsson T 2004 Biophysical journal 87 3518–24
- [39] Glotzer S C, Marzio E A D and Muthukumar M 1995 Phys. Rev. Lett. 74 2034–2037
- [40] Nott T J, Petsalaki E, Farber P, Jervis D, Fussner E, Plochowietz A, Craggs T D, Bazett-Jones D P, Pawson T, Forman-Kay J D and Baldwin A J 2015 Molecular Cell 57 936–947
- [41] Shin Y, Berry J, Pannucci N, Haataja M P, Toettcher J E and Brangwynne C P 2017 Cell 168 159–171
- [42] Jain S, Wheeler J R, Walters R W, Agrawal A, Barsic A and Parker R 2016 Cell 164 487–498
- [43] Zwicker D, Seyboldt R, Weber C A, Hyman A A and Jülicher F 2016 Nature Physics 13 408–413
- [44] Lifshitz, E M and Pitaevskii, L P 1981 Physical Kinetics (Butterworth-Heinemann)
- [45] Tsai N P, Ho P C and Wei L N 2008 The EMBO journal 27 715–26
- [46] Wippich F, Bodenmiller B, Trajkovska M G, Wanka S, Aebersold R and Pelkmans L 2013 Cell 152 791–805
- [47] Reineke, L C, Tsai, W C, Jain, A, Kaelber, J T, Jung, S Y, Lloyd R E 2017 Molecular and cellular biology 37 e00596–16
- [48] McEwen E, Kedersha N, Song B, Scheuner D, Gilks N, Han A, Chen J J, Anderson P and Kaufman R J 2005 Journal of Biological Chemistry 280 16925–16933
- [49] Axelrod D, Koppel D E, Schlessinger J, Elson E and Webb W W 1976 Biophysical journal 16 1055–1069
- [50] Gilks N, Kedersha N, Ayodele M, Shen L, Stoecklin G, Dember L M and Anderson P 2004 Molecular Biology of the Cell 15 5383–5398
- [51] Uversky V N 2016 Advances in Colloid and Interface Science 239 97–114
- [52] Kærn M, Elston T C, Blake W J and Collins J J 2005 Nature Reviews Genetics 6 451–464
- [53] Reineke L C, Dougherty J D, Pierre P and Lloyd R E 2012 Molecular Biology of the Cell 23 3499–3510
- [54] Rose Z B and Dube S 1976 Journal of Biological Chemistry 251 4817–4822
- [55] Aoki K, Takahashi K, Kaizu K and Matsuda M 2013 Scientific Reports 3 1541