Carbon-enhanced metal-poor 3D model atmospheres
Abstract
We present our latest 3D model atmospheres for carbon-enhanced metal-poor (CEMP) stars computed with the CO5BOLD code. The stellar parameters are representative of hot turn-off objects ( K, , [Fe/H]=3). The main purpose of these models is to investigate the role of 3D effects on synthetic spectra of the CH G-band (4140-4400 Å), the CN BX-band (3870-3890 Å), and several UV OH transitions (3122-3128 Å). By comparison with the synthetic spectra from standard 1D model atmospheres (assuming local thermodynamic equilibrium, LTE), we derive 3D abundance corrections for carbon and oxygen of up to and dex, respectively.
keywords:
hydrodynamics, radiative transfer, line: formation, stars: chemically peculiar1 Introduction
C, N, O in extremely metal-poor stars. Molecular bands of CH, CN and NH are the only available indicators of the abundances of carbon and nitrogen in stars with a metallicity below [M/H]=. Oxygen can be measured in giant stars from the [OI] 630 nm line down to [M/H] . For turn-off and main sequence stars, only the OH lines are available to get access to the oxygen abundance at these low metallicities. For this reason, understanding the formation of the molecular bands in extremely metal-poor stars is crucial for deciphering the galactic chemical evolution of the key elements C, N, and O.
The role of photospheric convection. The photospheres of metal-poor stars are known to be affected by small-scale convective flows that give rise to horizontal temperature fluctuations (“stellar granulation”) and extra surface cooling, effects that cannot be captured by 1D hydrostatic radiative equilibrium model atmospheres. The strength of spectral lines forming in an inhomogeneous, metal-poor stellar atmosphere tends to be enhanced with respect to the prediction of standard 1D models. Spectroscopic analyses based on realistic 3D atmospheres therefore generally yield lower chemical abundances.
2 3D model atmospheres
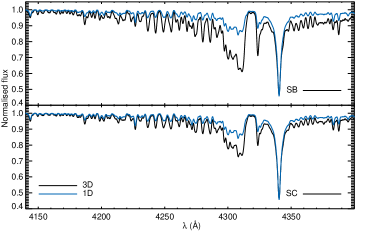
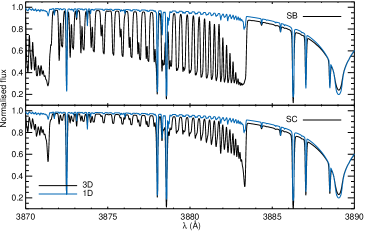
For this study, we carried out 3D numerical simulations of convection in a metal-poor stellar atmosphere with K, , and metallicity [M/H]=, assuming three different sets of C, N, O abundances, as consistently reflected in the 14 bin opacity tables. Models B and C are carbon-enhanced by a factor but with different C/O ratio, while model A has a “normal” metal-poor composition ([/Fe]=). Details are given in Table 2.
| Model | Model abundances | Synthesis | Comment | |||||
|---|---|---|---|---|---|---|---|---|
| ID | (C) | (N) | (O) | C/O | ID | G-band | OH-band | |
| A | 5.39 | 4.78 | 6.06 | 0.21 | SAB | inconsistent | ||
| SAC | inconsistent | |||||||
| \hdashline B | 7.39 | 6.78 | 6.06 | 21.4 | SB | consistent | ||
| C | 7.39 | 6.78 | 7.66 | 0.54 | SC | consistent | ||
Notes: SAB and SAB indicate that the atmospheric structure of model A was used together with (inconsistent) abundances B and C, respectively, for the spectrum synthesis.
3 Results
Given identical chemical composition, synthetic spectra of the molecular bands based on 3D metal-poor model atmospheres are found to be significantly stronger than the corresponding 1D spectra (see Fig. 1), as previously pointed out by [Bonifacio et al. (2013)]. By fitting the 3D synthetic G-band spectra with 1D spectra, varying the carbon abundance A(C) at fixed C/O ratio, we derive 3D LTE abundance corrections for carbon: A(C)A(C)1D. The abundance corrections for oxygen are obtained by fitting the 3D OH features with 1D spectra of different A(O). The results are summarized in the right part of Table 2. Inconsistencies in the chemistry (in particular C/O) between model atmosphere and line formation calculations (cases SAB, SAC) can lead to significant errors. Further details can be found in [Gallagher et al. (2016), Gallagher et al. (2017), Gallagher et al. (2016, 2017)].
4 Implications
We found substantial 3D effects on the formation of molecular bands in a typical CEMP star, implying downward abundance corrections for carbon and oxygen with respect to 1D results by up to dex for the CH G-band and dex for the OH band. Corrections for the CN-band could be even larger (work in progress). The influence of non-LTE effects and the existence of a stellar chromosphere may potentially change this conclusion.
References
- [Bonifacio et al. (2013)] Bonifacio, P., Caffau, E., Ludwig, H.-G., et al. 2013, MemSAIt Suppl., 24, 138
- [Gallagher et al. (2016)] Gallagher, A. J., Caffau, E., Bonifacio, P., et al. 2016, A&A, 593, A48
- [Gallagher et al. (2017)] Gallagher, A. J., Caffau, E., Bonifacio, P., et al. 2017, A&A, 598, L10