NIMROD calculations of energetic particle driven toroidal Alfvén eigenmodes
Abstract
Toroidal Alfvén eigenmodes (TAEs) are gap modes induced by the toroidicity of tokamak plasmas in absence of continuum damping. They can be excited by energetic particles (EPs) when the EP drive exceeds other dampings. A TAE benchmark case, which was proposed by the International Tokamak Physics Activity (ITPA) group, is studied in this work. Numerical calculations of linear growth of TAEs driven by EPs in a circular-shaped, large aspect ratio tokamak have been performed using the Hybrid Kinetic-MHD (HK-MHD) model implemented in the NIMROD code. This HK-MHD model couples a particle-in-cell (PIC) representation of EPs with the 3D MHD representation of the bulk plasma through moment closure for the momentum conservation equation. Both the excitation of TAEs and their transition to energetic particle modes (EPMs) have been observed. The influence of EP density, temperature, density gradient and position of the maximum relative density gradient, on the frequency and the growth rate of TAEs are obtained, which are consistent with those from eigen-analysis calculations and gyrokinetic simulations for an initial Maxwellian distribution of EPs. The relative pressure gradient of EP at the radial location of TAE gap, which represents the drive strength of EPs, can strongly affect the growth rate of TAEs. When the density and temperature of EP distribution are above certain threshold, the transition from TAE to EPM occurs and the mode structure changes.
I Introduction
Eigenmodes of Alfvén Waves can be excited by energetic particles (EPs) generated from neutral beam injection or other heating processes in tokamaksRosenbluth and Rutherford (1975); Wong (1999); Sharapov et al. (2013); Chen and Zonca (2016), as well as fusion produced alpha particles. In burning plasma devicesZonca et al. (2006) like ITERFasoli et al. (2007), the drive of EPs will become very strong because the velocity of alpha particle is close to be Alfvénic. In regions without strong continuum dampingBerk et al. (1991); Rosenbluth et al. (1992), Toroidal Alfvén Eigenmodes (TAEs) can be easily excitedBerk et al. (1993). Meanwhile, the destabilized TAEs can induce the transport of EPs and degrade the confinement of burning plasmas. The interaction between TAEs and EPs in tokamak plasmas, especially the burning plasmas, has been a topic of primary interest in fusion research.
Linear theory of TAEs has been developed for various circumstancesChen and Zonca (2016), including largeChen (1994); Fu and Dam (1989a) and smallFu and Dam (1989b) aspect ratios, idealRosenbluth et al. (1992) and nonidealCandy and Rosenbluth (1993, 1994) MHD models, low-Cheng and Chance (1986); Gorelenkov et al. (1999) and hign- modesRosenbluth et al. (1992), etc. Here, is the toroidal mode number. Cheng et al Cheng and Chance (1986) solve the linear ideal MHD equations to study the low- shear Alfvén spectra in axisymmetric plasmas and find that toroidicity can break up the continuous spectra and form an continuum gap, within which an AE can be excited. Fu et al Fu and Dam (1989a) consider kinetic effects of alpha particle and electron on TAEs in circular flux surface tokamak using the linear drift kinetic equation coupled with ideal MHD equations. They find that the low- TAEs can be destablized by alpha particles. Rosenbluth et al Rosenbluth and Rutherford (1975) point out that the shear Alfvén wave can be destablized by energetic ion and develop asymptotic formulasRosenbluth et al. (1992) to calculate the continuum damping rate for high- TAE in a low-bata, large-aspect-ratio, circular tokamak. Chen Chen (1994) studied the high- TAE and KBM (Kinetic Ballooning Mode) using the ballooning mode representation of the eigenmode equation in large-aspect-ratio circular tokamak. With the nonperturbative EPs, both gap modes (TAE and KBM) and EP continuum mode (EPM) are found from the dispersion relation. Berk et al Berk et al. (1993) and Candy et al Candy and Rosenbluth (1993, 1994) extend the TAE study to nonideal MHD regimes (finite ion Larmor radius, electron inertia, and collisions) for arbitrary mode numbers in large-aspect-ratio circular tokamaks.
The linear properties of shear Alfvén waves (SAWs), such as the excitation of TAEs, are relatively well understoodChen and Zonca (2016) and the methods for identifying SAWs in experimentFasoli et al. (2000) are well developed. The competition between the energetic particle drive and different dampingsBerk et al. (1992); Zonca and Chen (1992); Fu et al. (2005); Lauber et al. (2005), as well as the redistribution of EPs in phase space and the transport of EPs in real space, can cause complex behaviors of Alfvén eigenmodesAppel et al. (1995). More efforts are to be devoted to numerical simulations in order to understand the nonlinear effects of SAWs on bulk plasmas and the transport of energetic particles, especially the large-amplitude collective instabilities leading to energetic particle redistributions in real and phase spacesFasoli et al. (2007).
To investigate the global and nonlinear features of TAEs driven by EPs, various numerical calculations and simulations have been performedFu et al. (2005); Lauber et al. (2007); Todo et al. (2012); Briguglio et al. (2007); Nishimura et al. (2007); Mishchenko et al. (2008); Nishimura (2009). FuFu et al. (2005) investigates the kinetic damping of TAE in JET using reduced kinetic equations and finds the continuum damping important in the edge plasma. LIGKA is a linear gyrokinetic code developed by Lauber et alLauber et al. (2007) to study the EP effect on MHD stability, as well as the drive and damping of TAEs. Todo et alTodo et al. (2012) develop and use MEGA to study TAE bursts in the plasma regimes of the TFTR tokamak. Using HMGC code, Briguglio et alBriguglio et al. (2007) study the large-amplitude, bursting Alfvén modes in JT-60U, especially the dynamics of EP in phase space. In addition, global gyrokinetic PIC codes, GTC and GYGLES, have been applied to the study of TAEsNishimura et al. (2007); Mishchenko et al. (2008). Besides those simulations in large aspect ratio and low tokamak plasmas using reduced MHD models, other codes, such as M3D Park et al. (1999) and NIMROD Sovinec et al. (2004), have been developed to study EP physics in realistic tokamak configurations based on full MHD modelsKim et al. (2004); Lang et al. (2010).
In this paper, we report on the kinetic MHD simulations of SAWs driven by fast particles in a tokamak using the hybrid kinetic-MHD (HK-MHD) model in the NIMROD codeKim et al. (2004). The kinetic effects of fast minority ions are included in the HK-MHD model through the addition of fast particle pressure to the momentum conservation equation, which is computed using a particle-in-cell (PIC) algorithm on a quadrilateral finite element gridKim et al. (2004); Kim and the NIMROD Team (2008); Brennan et al. (2012); Takahashi et al. (2009). In preparation for studying the nonlinear EP driven SAWs in realistic tokamak plasmas, we perform the linear calculations using NIMROD as the first step. This work contributes to the TAE benchmark activity proposed by the ITPA Energetic Particle Topical GroupMishchenko et al. (2009). Both the excitation of TAEs and their transition to energetic particle modes (EPMs) have been obtained. The dependence of frequency and growth rate of TAEs on temperature and density of energetic particles are consistent with the calculations from the eigenvalue code NOVA-KKönies et al. (2012), as well as the gyrokinetic code GYGLESMishchenko et al. (2009). We also find that it is the relative EP pressure gradient at the radial location of TAE gap, which represents the drive strength of EPs, that strongly affects the growth rate of TAEs. From the calcultions, the conditions for the transition of TAE to EPM are further identified.
The rest of paper is organized as follows. In Section II, we describe the HK-MHD model used in NIMROD calculations. We introduce the setup of calculations, as well as the Alfvén continuum and the energetic particles density profiles in Section III. In Section IV, the different effects of EPs on TAEs, including the temperature, density, density gradient and position of maximum drive strength effects, are studied. The summary and discussion are given in the final section.
II The simulation model
The hybrid kinetic-MHD model implemented in the NIMROD code is used in our simulations. The background plasma and energetic ions are modeled using MHD equations and drift kinetic equations, respectivelyKim et al. (2004); Kim and the NIMROD Team (2008). The resistive two-fluid MHD equations are solved as an initial-boundary value problem that is decretized on a mesh of finite elements in the poloidal plane and with a finite Fourier series in the toroidal directionSovinec et al. (2003, 2004). In this work, we use the ideal MHD equations
| (1) | ||||
| (2) | ||||
| (3) | ||||
| (4) | ||||
| (5) | ||||
| (6) |
where subscripts denote bulk plasma and fast particles, is fluid element density and velocity for the bulk plasma, neglecting the contribution of fast particles, is the pressure of entire plasma, is the pressure of bulk plasma, is the pressure tensor of fast particles, and is ratio of specific heats. Other notations are all conventional.
In HK-MHD model, it is assumed that the density of fast species is much lower than that of bulk plasmas but the fast species pressure is on the order of the bulk plasma pressure, i.e. and , and is the ratio of thermal energy to magnetic energy. In this approximation, we neglect the contribution of energetic particles to the center of mass velocity. If we take the center of the mass velocity of energetic ions to be zero, in the momentum equation [Eq. (2)] can be calculated from the distribution function and the velocity of energetic ions,
| (7) |
where , and are the mass, the spatial coordinate vector and the velocity of fast ions.
The PIC method is used to solve the drift kinetic equation of energetic particles. In the limit of strong magnetic field, the drift kinetic approximation reduces the 6D phase space to 4D with one adiabatic invariant (i.e. the first adiabatic invariant ). If we substitute into Eq. (7), where and are the equilibrium and the perturbed distribution function of fast particles, respectively, then can be calculated as following
| (8) |
| (9) |
where and are the equilibrium and the perturbed fast particle pressure tensor, respectively. The condition for the force balance in equilibrium is given by
| (10) |
where the assumption is that the anisotropic components of fast particle pressure tensor in equilibrium are zero and the tensor is reduced to a scalar . Note that the steady state fields satisfy a scalar pressure force balance, which is based on the assumption that the form of equilibrium energetic particle distribution is isotropic in velocity space. With the solution for , we can calculate the pressure tensor. In the drift-kinetic approximation, the CGL-like pressure tensor can be used, , where , . In the implementation, is the unit tensor, and .
III The simulation setup
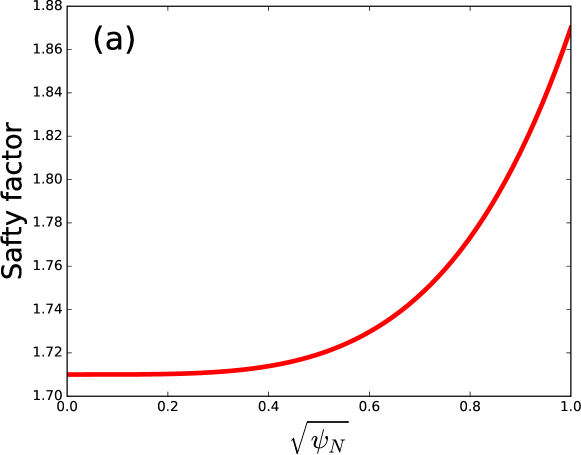
In the ITPA benchmark case, circular cross section tokamak with the major radius m and the minor radius m is consideredKönies et al. (2012); Mishchenko et al. (2009). The radial profile of safety factor is (Fig. 1 (a)), where is the radial coordinate for flux surface. The background number densities of hydrogen ions and electrons are assumed satisfy quasi-neutral condition.
The uniform radial profiles for both density and temperature of background plasma are used, where the ion density is , electron and ion temperatures are . The background plasma . The normalized poloidal flux function , where is the value of poloidal flux at boundary . Energetic particle distribution in velocity space is Maxwellian
| (11) |
where , and are the mass, the velocity and the temperature of fast ions.
III.1 Alfvén continuum
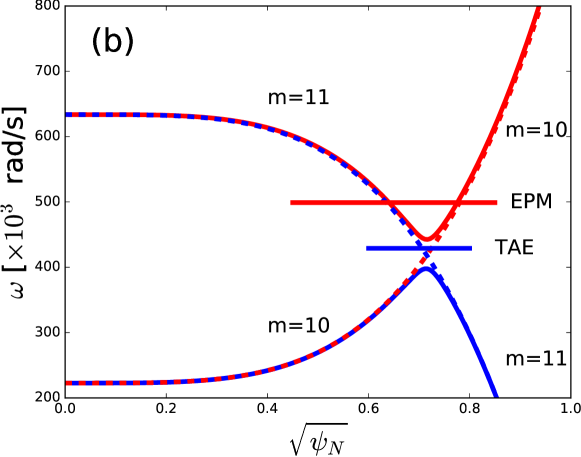
As shown in Fig. 1 (b), the ideal MHD SAWs continuum can be obtained from the following dispersion relationFu and Dam (1989a), which is valid for the low plasmas in the large aspect ratio limit,
| (12) |
where is the parallel wavenumber, is the major radius, is the minor radius, is the safety factor, is Alfvén velocity, , is the normalized radius, is the toroidal mode number and is the poloidal mode number. For , toroidicity induces coupling of and modes, and a TAE gap is formed in the SAW spectrum at (or ).
III.2 Energetic particle density profile
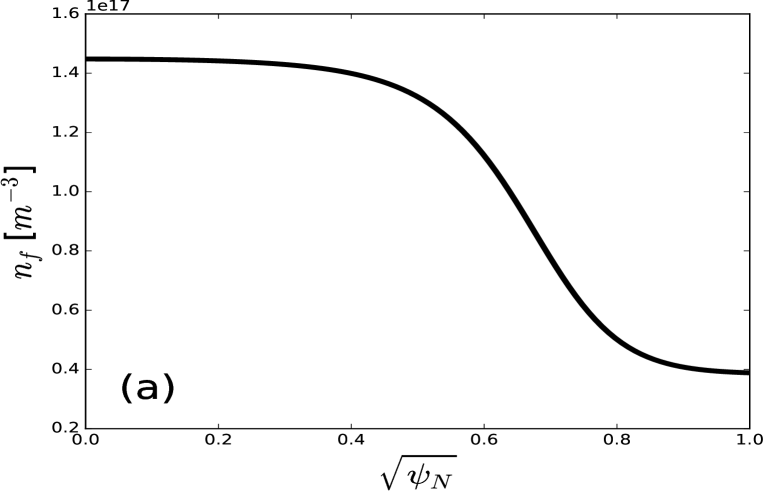
The fast particle temperature is uniform in space and the fast particle density is given by
| (13) |
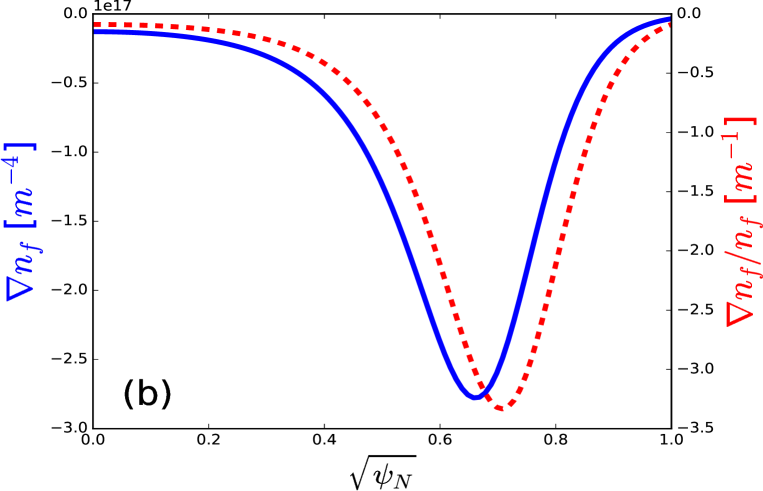
where is the fast ion density at . The position of the maximal relative gradient is chosen to be , the profile width and the profile length . As shown in Fig. 2, with density parameter =, the energetic particle density drops from core to boundary. The maximum density gradient is located around the radial position =0.44 (or =0.66) and the maximum relative gradient is located at the radial position =0.5 (or =0.707) where the TAE gap is formed (Fig. 1 (b)).
IV NIMROD simulation results
IV.1 Effects of energetic particle temperature
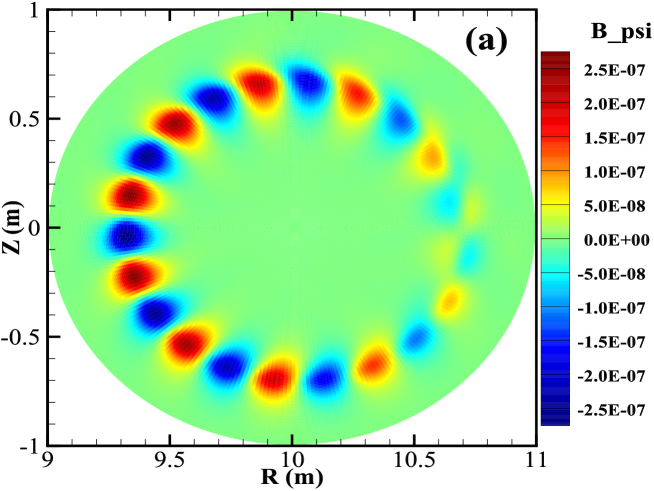
The contour plot of radial magnetic field in Fig. 3 (a) shows a typical TAE pattern for the base case with energetic particle density = and temperature =400 keV. One can see that this structure corresponds to the coupling of and mode. The frequency () and radial location () are located within the continuum gap predicted by the theory, as indicated in Fig. 1 (b).
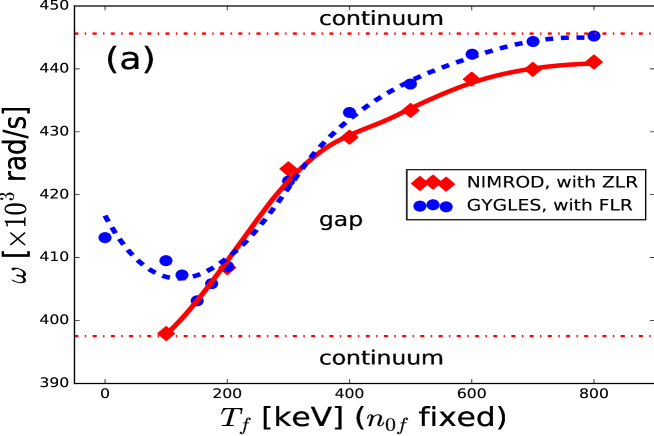
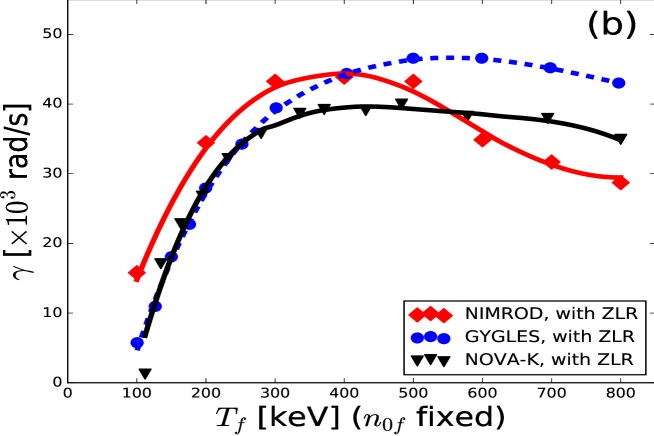
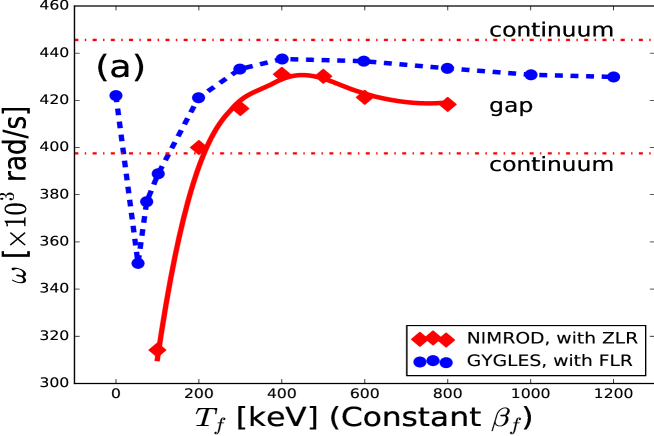
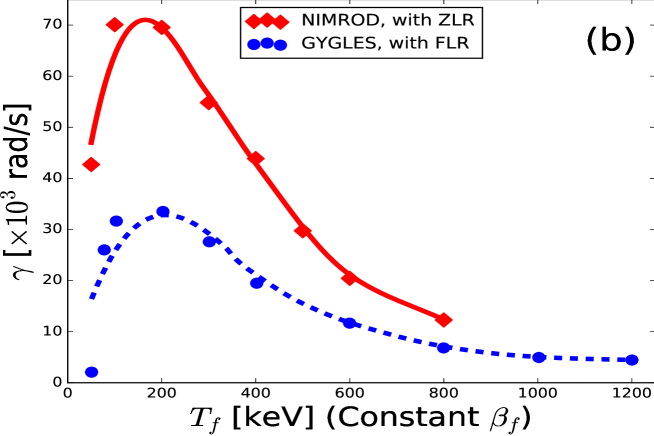
We vary the temperature of energetic particle from 100 keV to 800 keV with fixed density (), and calculate the frequency and growth rate of the excited unstable TAE (Fig. 4). The frequency is found to increases with temperature, whereas the growth rate increases first and then decreases. The frequencies are located in the TAE gap for all cases (Fig. 4 (a)), suggesting the TAE nature of the excited modes. From the GYGLES simulation results including the FLR (Finite-Larmor-Radius) effects, the TAE frequency first decreases and then increases with temperature, which is slightly different from our finding when the temperature of EPs is very low. When the EP temperature is higher, the variations of the frequency from two codes are similar to each other. The growth rate from NIMROD simulations are consistent with the results from NOVA-KKönies et al. (2012) and GYGLESMishchenko et al. (2009) (Fig. 4 (b)). The dependence of growth rate on EP temperature can be understood from the interaction between energetic particles and TAE. There is a resonant velocity of energetic particle at which the strongest interaction occurs between particles and wave because of the match between the EP and the wave phase velocities. For a fixed density of energetic particles, when the thermal velocity of EPs approaches the resonant velocity from below, the interaction becomes stronger, thus the growth rate increases. This corresponds to the initial increase of temperature of energetic particles, which is equivalent to the increase in EP pressure because of the fixed EP density. When the EP temperature hence EP pressure further increases, the thermal velocity of EPs surpasses the resonant velocity and resonant interaction becomes weaker, which leads to the decrease in growth rate. For this reason, the growth rate first increases and then decreases with the EP pressure, as shown in simulation results (Fig. 4 (b)).
We further investigate the effect of EP temperature with the EP pressure hence fixed. For the base case, the EP density and temperature , , and the background plasma . Keeping constant, it can be found that in Fig. 5, with the increase in EP temperature, the frequency increases first and then decreases. When the temperature is relatively small and the density is relatively big, the mode frequency is below the gap and it is EPM. As the temperature increases and the density decreases, the frequency increases to be located in the gap and the mode change from EPM to TAE. That is, there is a threshold () for EP density, above which EPM can be excited even though the EP temperature is relativly small. Except when the EP temperature is close to zero, the variations of frequencies from NIMROD and GYGLES simulations are similar. The growth rate increases first and then decreases, and around it reaches to the maximum. The dispersion relation in tokamak with inhomogeneous magnetic field can be approximated as which shows shear Alfvén waves with a radial extent are dispersive due to different phase velocities. Considering the magnetic curvature, the dispersion relation can be revised to , where is the ion magnetic drift velocity Rosenbluth and Rutherford (1975). The drift velocity term reduces effectively the eigenmode frequency so that the EP particles are able to resonate at the speed . As the Alfvén velocity () at the radial location of the gap () is , the corresponding resonant temperature of energetic particle is which is consistent with the location of maximum growth rate.
IV.2 Effects of energetic particle density
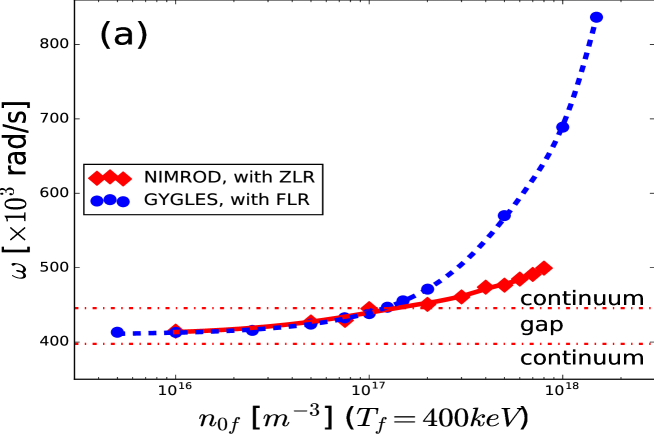
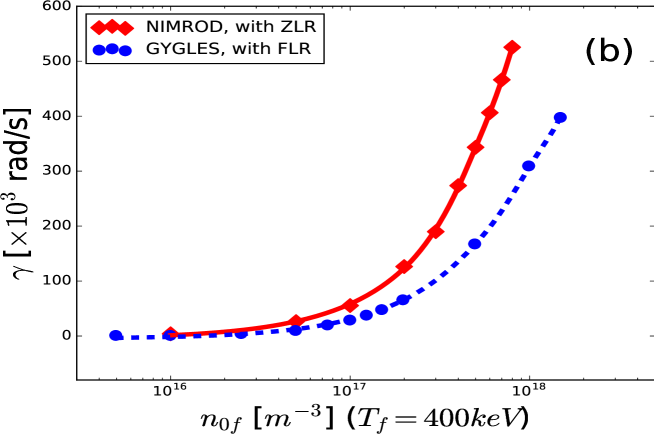
As shown in Fig. 6, for the fixed temperature of energetic particle, both the frequency and the growth rate increase with density. Comparing the simulation results from the NIMROD code with ZLR effect and the GYGLES code with FLR effects, one finds that the FLR effect only weakly enhances the frequency and suppresses the growth rate of EP-driven TAE. When the density is relatively small, the frequency is located in the TAE gap, but when the density increases to a certain value (), the frequency becomes higher above the upper value of gap so that TAE will transform into EPM. For the energetic particle density and the temperature , the ratio of energetic particles to bulk plasma is 0.1. As the EP density increases to , approaches . This is the threshold value of energetic particle density above which the TAE-EPM transition occurs. If the energetic particle density continues to increase, the mode frequency increases further beyond the gap to an even larger value. That suggests that EPM can be excited when the energetic particle becomes larger than the bulk plasma .
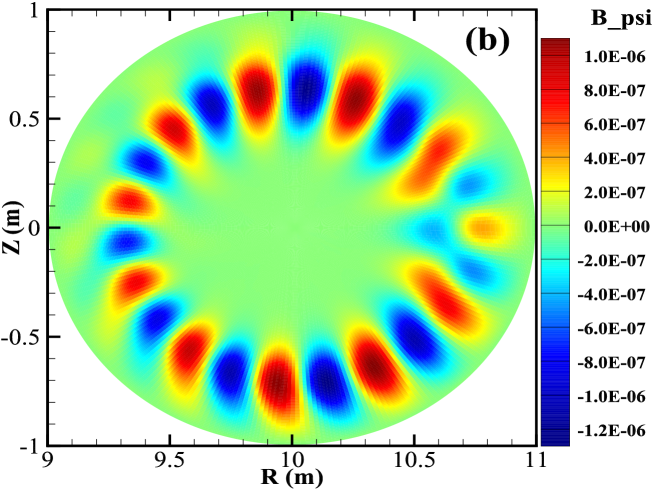
The TAE-EPM transition can be also observed from the changes in the dominant mode structure in poloidal plane (Fig. 3). When the EP density is , the TAE is located at a relatively narrow region around =0.707 between =0.6 and =0.8 (Fig. 3 (a)). When the EP density increases to , the EPM mode structure expands to a wider region around =0.707 from =0.45 to =0.85 (Fig. 3 (b)).
IV.3 Effects of energetic particle density gradient
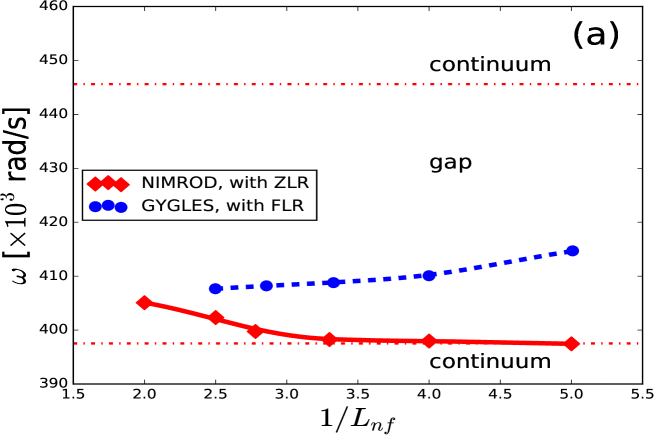
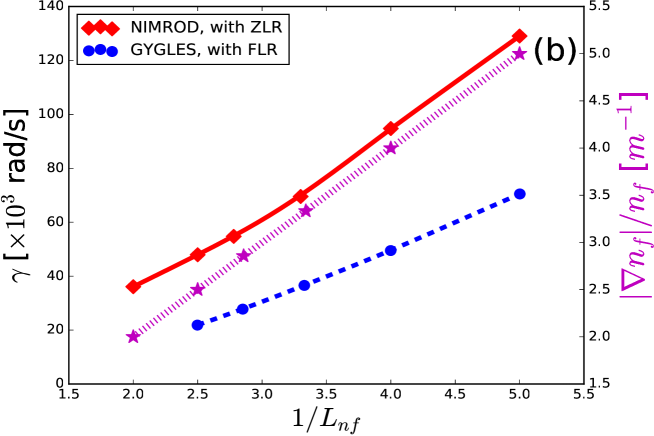
In order to investigate the effect of energetic particle density gradient, we vary the parameter used to specify the EP density profile in Eq. (13). In the base case, EP density parameter = and temperature =200 KeV are selected where the growth rate is relatively large (Fig. 5). Simulations indicate that the growth rate is nearly proportional to the absolute value of relative density gradient at the location of TAE gap (Fig. 7 (b)). The frequency first decreases and then increases with density gradient and it remains located within the TAE gap for most cases (Fig. 7 (a)). Meanwhile, the growth rate increases monotonically. In contrast, the increase of energetic particle density gradient does not affect the dominant mode feature, even as the mode nature transits from TAE towards EPM.
IV.4 Radial location of maximum EP drive
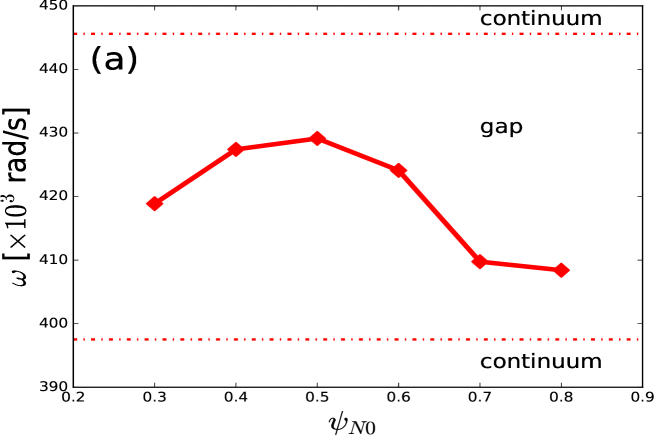
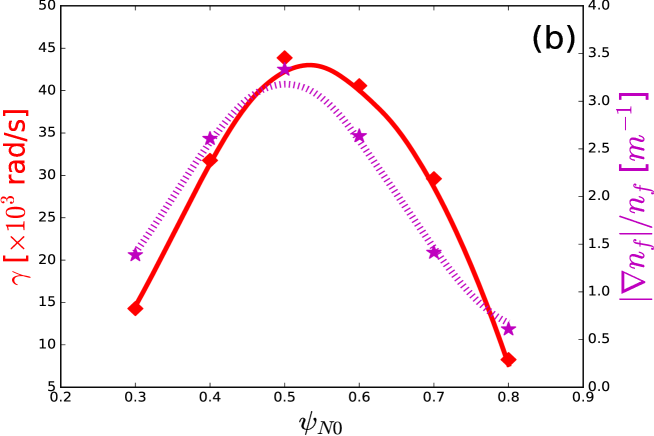
The strength of energetic particle drive depends on the radial location of the maximum relative pressure gradientWang et al. (2013). In order to investigate the effect of energetic particle density gradient, we vary the parameter in the EP density profile function in Eq. (13), which represents the location of the maximum relative pressure gradient. EP density parameter = and temperature =400 KeV are fixed. Both the frequency and the growth rate first increase and then decrease with , and they reach the maximums at (Fig. 8). One can see that the absolute value of relative density gradient at the location of TAE gap has a positive correlation to the growth rate and reaches the maximum value at too (Fig. 8 (b)). For the case , the maximum relative density gradient collocates with the location where the and modes interact to form the TAE gap. That is, for the uniform temperature, when the radial location of the maximum relative density and the TAE gap overlap with each other, the EP drive becomes maximal. This result is consistent with the conclusion from previous GTC simulation studies on the DIII-D tokamakWang et al. (2013), that the TAE appears in the radial location where the relative pressure gradient of EPs is the strongest.
V Summary and discussion
NIMROD simulations of the SAWs excitied by energetic particles in a circularly shaped tokamak have been presented. The dependence of both the frequency and the growth rate on the energetic particle parameters are studied, and the NIMROD results are consistent with those from NOVA-K Könies et al. (2012) and GYGLES Mishchenko et al. (2009). When the value of energetic particles (i.e. ) becomes larger than that of bulk plasma (i.e. ), or when EP density exceeds a certain threshold with a relatively lower temperature, the TAEs can transit to EPMs. For the resonant thermal velocity () of energetic particles, the interaction between SAWs and EPs is the strongest. The density gradient at the radial location of TAE gap can strongly affect the growth rate of TAE, though not its frequency. The EP drive becomes the strongest when the maximum relative pressure gradient of EP is located at the radial position of TAE gap.
So far, the FLR effect is not considered in our simulation. In the future, the FLR and FOW (Finite-Orbit-Width) effects can be included and examined. In addition, for tokamak experiments, the strong interaction of EPs with background plasma may better be modeled with the slowing-down distribution function. To study EP driven TAEs and EPMs in realistic tokamak experiments, the slowing-down distribution function or the distributions obtained directly from experiments for EPs will be considered in our future simulation work.
Acknowledgements.
This work was supported by National Magnetic Confinement Fusion Science Program of China under Grant Nos. 2014GB124002 and 2015GB101004, the National Natural Science Foundation of China grant No. 11205194, U.S. Department of Energy Grant Nos. DE-FG02-86ER53218 and DE-FC02-08ER54975, and the 100 Talent Program of the Chinese Academy of Sciences. This research used the computing resources from the Supercomputing Center of University of Science and Technology of China, and the National Energy Research Scientific Computing Center, a DOE Office of Science User Facility supported by the Office of Science of the U.S. Department of Energy under Contract No. 13DE-AC02-05CH11231.References
- Rosenbluth and Rutherford (1975) M. N. Rosenbluth and P. H. Rutherford, Physical Review Letters 34, 1428 (1975).
- Wong (1999) K. L. Wong, Plasma Physics and Controlled Fusion 41, R1 (1999).
- Sharapov et al. (2013) S. E. Sharapov, B. Alper, H. L. Berk, D. N. Borba, B. N. Breizman, C. D. Challis, I. G. J. Classen, E. M. Edlund, J. Eriksson, A. Fasoli, et al., Nuclear Fusion 53, 104022 (2013).
- Chen and Zonca (2016) L. Chen and F. Zonca, Reviews of Modern Physics 88, 015008 (2016).
- Zonca et al. (2006) F. Zonca, S. Briguglio, L. Chen, G. Fogaccia, T. S. Hahm, A. V. Milovanov, and G. Vlad, Plasma Physics and Controlled Fusion 48, 1165 (2006).
- Fasoli et al. (2007) A. Fasoli, C. Gormenzano, H. L. Berk, B. Breizman, S. Briguglio, D. S. Darrow, N. Gorelenkov, W. W. Heidbrink, A. Jaun, S. V. Konovalov, et al., Nuclear Fusion 47, 264 (2007).
- Berk et al. (1991) H. L. Berk, J. W. V. Dam, Z. Guo, and D. M. Lindberg, Physics of Fluids B 4, 1806 (1991).
- Rosenbluth et al. (1992) M. N. Rosenbluth, H. L. Berk, J. W. V. Dam, and D. M. Lindberg, Physics of Fluids B 4, 2189 (1992).
- Berk et al. (1993) H. L. Berk, R. R. Mett, and D. M. Lindberg, Physics of Fluids B 5, 3969 (1993).
- Chen (1994) L. Chen, Physics of Plasmas 311, 1519 (1994).
- Fu and Dam (1989a) G. Y. Fu and J. W. V. Dam, Physics of Fluids B 1, 1949 (1989a).
- Fu and Dam (1989b) G. Y. Fu and J. W. V. Dam, Physics of Fluids B 1, 2404 (1989b).
- Candy and Rosenbluth (1993) J. Candy and M. N. Rosenbluth, Plasma Physics and Controlled Fusion 35, 957 (1993).
- Candy and Rosenbluth (1994) J. Candy and M. N. Rosenbluth, Physics of Plasmas 1, 356 (1994).
- Cheng and Chance (1986) C. Z. Cheng and M. S. Chance, Physics of Fluids 29, 3695 (1986).
- Gorelenkov et al. (1999) N. N. Gorelenkov, C. Z. Cheng, and G. Y. Fu, Physics of Plasmas 6, 2802 (1999).
- Fasoli et al. (2000) A. Fasoli, D. Borba, B. Breizman, C. Gormezano, R. F. Heeter, A. Juan, M. Mantsinen, S. Sharapov, and D. Testa, Physics of Plasmas 7, 1816 (2000).
- Berk et al. (1992) H. L. Berk, J. W. Van Dam, Z. Guo, and D. M. Lindberg, Physics of Fluids B 4, 1806 (1992).
- Zonca and Chen (1992) F. Zonca and L. Chen, Physical Review Letters 68, 592 (1992).
- Fu et al. (2005) G. Y. Fu, H. L. Berk, and A. Pletzer, Physics of Plasmas 12, 082505 (2005).
- Lauber et al. (2005) P. Lauber, S. Gunter, S. D. Pinches, and J. E. Contributors, Physics of Plasmas 12, 21 (2005).
- Appel et al. (1995) L. C. Appel, H. L. Berk, D. Borba, B. N. Breizman, T. C. Hender, G. T. A. Huysmans, W. Kerner, M. S. Pekker, S. D. Pinches, and S. E. Sharapov, Nuclear Fusion 35, 1697 (1995).
- Lauber et al. (2007) P. Lauber, S. Gunter, A. Könies, and S. D. Pinches, Journal of Computational Physics 226, 447 (2007).
- Todo et al. (2012) Y. Todo, H. L. Berk, and B. N. Breizman, Nuclear Fusion 52, 033003 (2012).
- Briguglio et al. (2007) S. Briguglio, G. Fogaccia, G. Vlad, F. Zonca, K. Shinohara, M. Ishikawa, and M. Takechi, Physics of Plasmas 14, 7 (2007).
- Nishimura et al. (2007) Y. Nishimura, Z. Lin, and W. X. Wang, Physics of Plasmas 14, 361 (2007).
- Mishchenko et al. (2008) A. Mishchenko, R. Hatzky, and A. Könies, Physics of Plasmas 15, 112106 (2008).
- Nishimura (2009) Y. Nishimura, Physics of Plasmas 16, 030702 (2009).
- Park et al. (1999) W. Park, E. V. Belova, G. Y. Fu, X. Z. Tang, H. R. Strauss, and L. E. Sugiyama, Physics of Plasmas 6, 1796 (1999).
- Sovinec et al. (2004) C. R. Sovinec, A. H. Glasser, T. A. Gianakon, D. C. Barnes, R. A. Nebel, S. E. Kruger, D. D. Schnack, S. J. Plimpton, A. Tarditi, M. S. Chu, et al., Journal of Computational Physics 195, 355 (2004).
- Kim et al. (2004) C. C. Kim, C. R. Sovinec, S. E. Parker, and the NIMROD Team, Computer Physics Communications 164, 448 (2004).
- Lang et al. (2010) J. Lang, G.-Y. Fu, and Y. Chen, Physics of Plasmas 17, 042309 (2010).
- Kim and the NIMROD Team (2008) C. C. Kim and the NIMROD Team, Physics of Plasmas 15, 072507 (2008).
- Brennan et al. (2012) D. P. Brennan, C. C. Kim, and R. J. La Haye, Nuclear Fusion 52, 033004 (2012).
- Takahashi et al. (2009) R. Takahashi, D. P. Brennan, and C. C. Kim, Physical Review Letters 102, 135001 (2009).
- Mishchenko et al. (2009) A. Mishchenko, A. Könies, and R. Hatzky, Physics of Plasmas 16, 082105 (2009).
- Könies et al. (2012) A. Könies, T. Feher, P. Lauber, A. Mishchenko, R. Kleiber, M. Borchardt, S. Briguglio, G. Vlad, N. Gorelenkov, M. Isaev, et al., Benchmark of gyrokinetic, kinetic MHD and gyrofluid codes for the linear calculation of fast particle driven TAE dynamics, Tech. Rep. (2012).
- Sovinec et al. (2003) C. R. Sovinec, T. Gianakon, E. Held, S. Kruger, D. Schnack, and N. Team, Physics of Plasmas 10, 1727 (2003).
- Wang et al. (2013) Z. Wang, Z. Lin, I. Holod, W. W. Heidbrink, B. Tobias, M. Van Zeeland, and M. E. Austin, Physical Review Letters 111, 145003 (2013).