No evidence of circumstellar gas surrounding Type Ia Supernova SN 2017cbv
Abstract
Nearby type Ia supernovae (SNe Ia), such as SN 2017cbv, are useful events to address the question of what the elusive progenitor systems of the explosions are. Hosseinzadeh et al. (2017a) suggested that the early blue excess of the lightcurve of SN 2017cbv could be due to the supernova ejecta interacting with a nondegenerate companion star. Some SN Ia progenitor models suggest the existence of circumstellar (CS) environments in which strong outflows create low density cavities of different radii. Matter deposited at the edges of the cavities, should be at distances at which photoionisation due to early ultraviolet (UV) radiation of SNe Ia causes detectable changes to the observable Na I D and Ca II H&K absorption lines. To study possible narrow absorption lines from such material, we obtained a time-series of high-resolution spectra of SN 2017cbv at phases between and days with respect to -band maximum, covering the time at which photoionisation is predicted to occur. Both narrow Na I D and Ca II H&K are detected in all spectra, with no measurable changes between the epochs. We use photoionisation models to rule out the presence of Na I and Ca II gas clouds along the line-of-sight of SN 2017cbv between – cm and Ca II within – cm, respectively. Assuming typical abundances, the mass of a homogenous spherical CS gas shell with radius must be limited to M☉. The bounds point to progenitor models that deposit little gas in their CS environment.
1 Introduction
Type Ia supernovae (SNe Ia) are of great importance to modern cosmology, because they are standardisable candles (see e.g. Goobar & Leibundgut, 2011, for a review). Although thousands of SNe Ia have been observed, the physics of the progenitor system leading to the explosions is not fully understood. There are two prevalent progenitor models for SNe Ia, both of which have some observational support. The models involve the thermonuclear explosion of a carbon-oxygen (C/O) white dwarf (WD) in a binary system with another star, which it merges with or accretes mass from. If the companion star is another WD, the system is referred to as a double degenerate (DD, Iben & Tutukov, 1984; Webbink, 1984), and if it is a main sequence or giant star, a single degenerate progenitor (SD, Whelan & Iben, 1973). More complicated systems, such as common envelope (or symbiotic) binaries (Dilday et al., 2012), and colliding WDs have also been proposed (Dong et al., 2015).
The circumstellar (CS) environment of SNe Ia should hold clues to the progenitor systems. SD progenitors for instance are believed to have strong outflows, which excavate low density cavities into the surrounding interstellar medium (ISM) and deposit matter at the edges (Badenes et al., 2007). Similarly, DD Helium+C/O binary systems should create cavities with smaller radii (Shen et al., 2013). On much smaller scales, tidal effects in DD progenitors can deposit matter into the CS medium (Raskin & Kasen, 2013).
Strong upper limits on outflowing matter have been set with radio (Chomiuk et al., 2016; Kundu et al., 2017) and X-ray (Margutti et al., 2014) observations of individual SNe Ia. Furthermore, the lack of thermal emission in mid- and far-infrared wavelengths, has set strong limits on the presence of CS dust (Johansson et al., 2013, 2017). Nevertheless, observations such as predominately blueshifted profiles of narrow Na I D absorption lines point to outflowing material along the lines-of-sight (LOS) (Sternberg et al., 2011; Maguire et al., 2013). However, the blueshifted profiles and frequently observed large Na I column densities (Phillips et al., 2013) could also be explained by desorption from ISM dust grains, when they are exposed to the radiation of SNe Ia (Soker, 2014).
Along with a recent method, which follows variable reddening of SNe Ia (Bulla et al., 2018), variations in narrow absorption line profiles can be used to locate gas close to SNe Ia. Before maximum brightness, photoionisation should lead to a decrease of characteristic absorption lines (Borkowski et al., 2009). At later phases recombination of the same gas could lead to the increase in the same absorption lines. Variations due to photoionisation can be used to determine the distance of the gas from a supernova. However, geometric effects (Patat et al., 2010) and changing levels of foreground light (Maeda et al., 2016) can also lead to similar variations.
A small number of SNe Ia with variable absorption lines have been observed to date:
- •
-
•
SN 2007le (Simon et al., 2009) showed an increasing Na I D component.
-
•
SN 2011fe (Patat et al., 2013) showed slight variations, consistent with geometric effects.
-
•
PTF11kx (Dilday et al., 2012), a peculiar supernova which showed many variable absorption features and is believed to have had a symbiotic progenitor.
-
•
SN 2013gh (Ferretti et al., 2016) had a varying Na I D component consistent with photoionisation.
- •
A larger sample of 14 SNe Ia with multi-epoch high-resolution spectra (Sternberg et al., 2014), did not reveal further examples of varying absorption lines. However, almost all existing time-series are taken at too late phases to probe for photoionisation of CS gas (see Ferretti et al., 2016).
Because of its low redshift, early discovery and a LOS seemingly clear of an ISM, the recently discovered SN 2017cbv (Hosseinzadeh et al., 2017a) presents a good opportunity to search for photoionisation of CS gases. Below we present the high-resolution spectra we obtained (Section 2), in which we identify narrow Na I D and Ca II H&K absorption features and search for variations in them (Section 3). Using a simple photoionisation model, we then set limits on the presence of CS gases (Section 4). Finally, we compare our observations to the findings of Hosseinzadeh et al. (2017a) and conclude (Section 5 & 6).
2 Observations
| MJD | UT Date | Exp. time | Set-up | Epoch | S/N† | H2O column | ||
| (s) | (days) | (mm) | ||||||
| 57826.3 | Mar. | 14.3 | 1.0” DIC1 390+580 | -14.8 | 62,000 | 110 | ||
| 57831.2 | Mar. | 19.2 | 0.8” DIC1 390+580 | -9.9 | 66,000 | 150 | ||
| 57846.1 | Apr. | 03.1 | 0.8” DIC1 390+580 | 5.0 | 52,000 | 210 | ||
| 57923.2 | Jun. | 19.2 | 0.8” DIC1 390+580 | 82.1 | 56,000 | 110 | ||
| 57924.0 | Jun. | 20.0 | 0.8” DIC1 390+580 | 82.9 | 63,000 | |||
| †around Å | ||||||||
SN 2017cbv was discovered on March 10 UT (MJD 57822.14) by the Distance Less Than 40 Mpc (DLT40) supernova survey (Tartaglia et al., 2017) and subsequently classified as a young SN Ia (Hosseinzadeh et al., 2017b). The supernova is located in the outskirts of NGC 5643 at z (Koribalski et al., 2004), at (J2000), a LOS with galactic extinction mag (Schlafly & Finkbeiner, 2011). Lightcurve analysis by Hosseinzadeh et al. (2017a) determined that SN 2017cbv peaked at MJD 57841.07 in -band with mag.
Because SN 2017cbv was a good candidate to search for CS gas, we triggered our ESO TOOs 098.A-0783(A) and 098.A-0783(B) (P.I. Amanullah) to obtain spectra with the Ultraviolet and Visual Echelle Spectrograph (UVES; Dekker et al., 2000) on UT2 at the Very Large Telescope (VLT). We reduced the spectra using the REFLEX (ESOREX) reduction pipeline provided by ESO (Modigliani et al., 2010) and used the telluric line correction software Molecfit (Smette et al., 2015; Kausch et al., 2015) where necessary. The obtained spectra are summarised in Table 1.
The first UVES spectrum was taken on MJD 57826.3, 4.2 days after discovery, at an epoch of days before -band maximum. Two follow-up spectra were obtained bracketing maximum light to cover the time frame at which changes due to photoionisation could be expected. Finally, two late spectra were taken on back-to-back nights to cover phases during which late-time absorption line variations have been observed in the past (e.g. SN 2006X, Patat et al., 2007). In the following, the two last spectra are treated as one epoch, since SNe Ia only evolve slowly at late phases and an improved signal-to-noise ratio (SN) is achieved by coadding them.
3 Narrow absorption features
We searched all spectra for narrow absorption features in the rest frame of NGC 5643. While Ca II H&K lines were immediately apparent in all spectra, Na I D absorption was only revealed after applying telluric line corrections. We searched for, but did not detect CH and CH or any diffuse interstellar bands (DIBs) such as those identified in Sollerman et al. (2005). The frequently studied DIBs at 5780 and 5797 fall in between the spectral arms of the UVES spectra and K I lies outside the range of the instrument with the chosen set up.
Around z , many telluric lines can make the identification of Na I D difficult. In fact the telluric features in the first two epochs are more prominent than Na I D. In Table 1 the H2O column determined from telluric line fitting is shown for reference. The Na I D features could be identified because,
-
•
several features remained after telluric line correction at the redshift of NGC 5643,
-
•
they appeared as doublets with the separation and line ratios characteristic of Na I D,
-
•
they did not shift with the telluric lines between epochs,
-
•
and they appeared to have the same rest frame velocity as the deepest features of Ca II H&K.
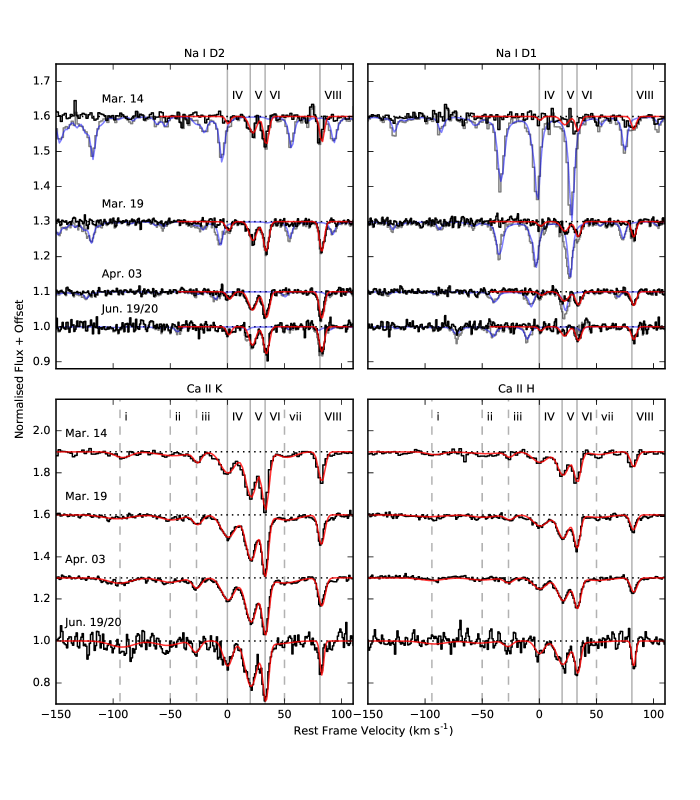
The detected absorption lines are plotted in Figure 1 after normalising the continua and correcting for telluric features.
We visually compared the profiles of each epoch for differences. In the first epoch a small peak appears in next to the most redshifted feature in Na I D2 (labeled VIII in Figure 1). Notably, there is no feature at the corresponding wavelength in Na I D1 and several comparable outliers can be identified in the continuum of this spectrum. For this reason we ignore the peak in the further analysis. No other significant differences could be visually identified between the epochs.
To search for absorption line variations, we measured the pixel-for-pixel equivalent widths () of each epoch. Where possible, we measured of individual features or, if the lines are blended, across groups of features. In neither case significant trends could be identified. The average total values measured are , , and mÅ.
We further fit Voigt profiles to the features using VPFIT111http://www.ast.cam.ac.uk/~rfc/vpfit.html, whereby we fit the profiles of each doublet of the same absorber simultaneously (Na I D1 with D2 and Ca II H with K). To establish the best over all profile, we initially fit all epochs simultaneously. The Ca II H&K profiles can be fit well by eight individual components, while four of those match the profile of Na I D. In Table 2, the Voigt profile parameters, redshift , column density , and Doppler widths , of the simultaneous fits are presented, whereby the features are labeled the same way as in Figure 1.
The most prominent features IV–VI and VIII have close enough redshifts in both Na I D and Ca II H&K to correspond to the same gas clouds along the LOS to SN 2017cbv. Interestingly, of these features appear to be significantly larger than . This suggests either that there are more unresolved features in Ca II H&K, or Ca II is depleted in the colder regions of these gas clouds. The ratios of these features are also shown in Table 2.
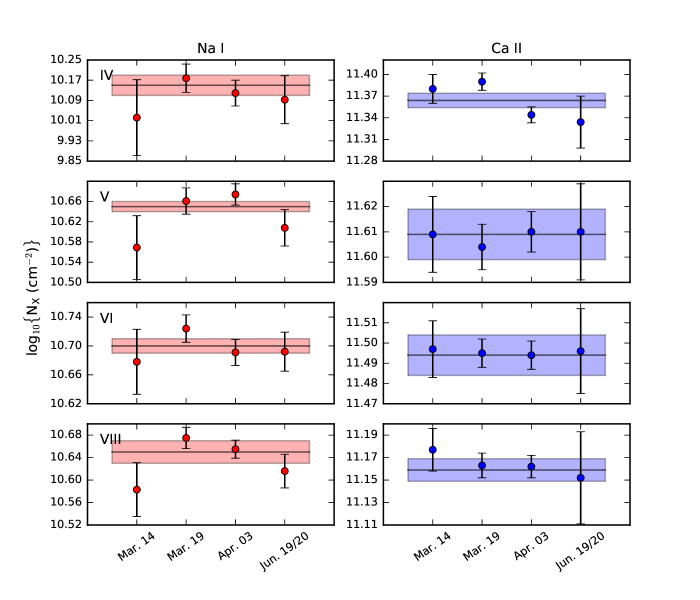
To search for time dependence, we fit the Voigt profiles to each epoch individually. The profiles are plotted in red over the spectra in Figure 1. We studied and of each feature without finding any significant trends. In Figure 2 it can be seen that of the most prominent features are consistent with the values determined from the simultaneous fits of all epochs.
| Feature | ||||||||||||
| (km s-1) | (cm-2) | (km s-1) | (cm-2) | (km s-1) | ||||||||
| i | -94 | – | – | – | 0.003684(2) | 10.92 | 0.03 | 14.1 | 1.0 | – | ||
| ii | -50 | – | – | – | 0.003834(3) | 10.85 | 0.03 | 12.3 | 1.2 | – | ||
| iii | -27 | – | – | – | 0.003911(1) | 10.83 | 0.02 | 4.6 | 0.5 | – | ||
| IV | 1 | 0.004005(1) | 10.15 | 0.03 | 1.7 | 0.7 | 0.004002(1) | 11.37 | 0.01 | 7.8 | 0.2 | 17.4 |
| V | 21 | 0.004074(1) | 10.66 | 0.01 | 3.5 | 0.3 | 0.004070(1) | 11.60 | 0.01 | 5.9 | 0.1 | 8.9 |
| VI | 33 | 0.004114(1) | 10.72 | 0.01 | 1.5 | 0.3 | 0.004112(1) | 11.50 | 0.01 | 2.4 | 0.1 | 6.2 |
| vii | 50 | – | – | – | 0.004168(4) | 10.98 | 0.04 | 15.1 | 1.5 | – | ||
| VIII | 82 | 0.004277(1) | 10.67 | 0.02 | 0.7 | 0.4 | 0.004276(1) | 11.16 | 0.01 | 2.3 | 0.2 | 3.2 |
| † inferred from with respect to | ||||||||||||
4 Photoionisation
We use a photoionisation model described in Borkowski et al. (2009), in which we assume a homogenous thin shell of CS gas that is optically thin to ionising photons. The fraction of such a gas in a shell of radius that is ionised at a given time is
| (1) |
where is the spectral energy distribution (SED) of a supernova at a distance from the observer, is the wavelength dependent ionisation cross-section222Obtained via phidrates.space.swri.edu (Huebner & Mukherjee, 2015) and the ionisation energy of the gas. The column density is then defined by
| (2) |
which implies that
| (3) |
We use the SED from Amanullah et al. (2015) based on SN 2011fe, since this supernova has the best temporal coverage of high SN ultraviolet (UV) spectra. then depends on two free parameters, the initial column density and .
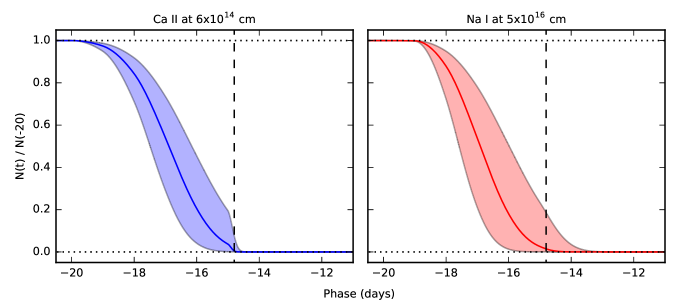
In the absence of absorption line variations, the model can be used to set limits on and . For a given set of observations, one can define a range , within which any gas would be ionised. Thereby defines the radius at which all gas is ionised before the first spectrum is obtained and is the radius beyond which the ionising flux is negligible. To obtain a strong inner radius limit, the first spectrum must be obtained as early as possible.
The spectral coverage of SN 2017cbv implies that – cm and – cm. In Figure 3 the fractional ionisation curves at and are shown. Since the ultraviolet (UV) flux of SNe Ia can vary considerably between supernovae, we consider a mag (factor 2.5) range in UV flux. If the SED underestimates the UV flux of SN 2017cbv by this factor, cm and cm.
One can furthermore define , the highest column density a gas cloud within the excluded radius range can have to not be detected. In the cases of Na I and Ca II gas, one can require that an absorption feature must be identifiable in both profiles of the Na I D and Ca II H&K. This implies it must be detectable in Na I D1 and Ca II H, which have the weaker oscillator strengths of their respective doublets.
Assuming a feature with a Gaussian profile and a full-width-half-maximum of Å, the column density would need to be more than for a line to be identifiable above the noise in Na I D1. Notably, feature IV has a lower column density than this limit and is not detected in Na I D1 above the noise of the first epoch. Only in the later spectra, with higher SN and lower water column, feature IV can be identified. Using the same criterion, a column density greater than is necessary to identify a feature in Ca II H in the first epoch.
One can further determine a upper bound on the enclosed mass of CS gas from the upper column density limits. Assuming a homogenous shell of gas with a radius , M☉ and M☉, where the values are scaled to cm. For typical abundances of (Wakker & Mathis, 2000), this suggests an H I mass of M☉. If the gas has been swept up from the ISM surrounding the progenitor, the H I volume density must have been cm-3.
After photoionisation, gas is expected to recombine, whereby the recombination rate is dependent on the temperature and electron density of the gas cloud. To describe recombination on the time scale of the variations observed in SNe 2006X and 2007le, high electron densities must be assumed (e.g. cm-3, Simon et al., 2009). This has lead to alternative explanations through geometric effects (Chugai, 2008) or photon-induced desorption (Soker, 2014). The spectra of the last epoch of SN 2017cbv were taken at similar time-scales as the examples above, but show no comparable variations.
5 Discussion
The observations suggest that the detected absorption lines stem from gas at interstellar distances. In Ca II H&K, the gas clouds span a velocity range of km s-1, a dispersion that would be unusual for the disc of a spiral galaxy at the projected distance of kpc from the core. Thus some of the gas clouds might be located in the halo of NGC 5643. In the Milky Way, it has been found that the ratio is lower in gas clouds in the disc than in the halo (Cohen & Meloy, 1975). This relation has been used to distinguish between disc and halo absorbing systems in quasar spectra (e.g. Baldwin et al., 1985). In SN 2017cbv, feature VIII has the lowest value, consistent with gas from the disc. Features IV–VI have higher ratios, suggesting that they could be located in the halo.
Assuming similar ISM properties to our Milky Way, we can infer reddening from (Poznanski et al., 2012). This suggests a negligible mag, in agreement with Hosseinzadeh et al. (2017a).
Some SNe Ia have unusually steep extinction curves (e.g. Amanullah et al., 2015), which could be explained by the presence of CS dust (Goobar, 2008). To affect the extinction curve, the dust must be situated at distances closer than a few cm. Assuming the dust is traced by Na I and Ca II gas, our observations exclude CS dust at distances of – cm from SN 2017cbv. Hoang (2017) propose that the steep extinction curves are the result of dust grains shattered by radiation pressure. In line with the suggestions in Soker (2014), this could account for the frequently observed blueshifted and unusually deep Na I D profiles (Sternberg et al., 2011; Maguire et al., 2013; Phillips et al., 2013).
Hosseinzadeh et al. (2017a) propose that the early blue excess of SN 2017cbv could be due to the supernova ejecta hitting a non-degenerate companion star (Kasen, 2010). The progenitor system containing a subgiant companion star must have sustained strong stellar winds during accretion. Models suggest that the outflows should excavate large low-density cavities with radii of – cm (Badenes et al., 2007) into the ISM. Since our observations exclude photoionisation of Na I up to cm from SN 2017cbv, a cavity larger than this is compatible with Badenes et al. (2007). However, the smaller cavities with a few cm predicted for DD He+C/O progenitors (Shen et al., 2013) can be excluded.
6 Conclusions
We have detected multiple Na I and Ca II gas clouds along the LOS to SN 2017cbv, a SN Ia on the outskirts of its host galaxy NGC 5643. We have obtained multi-epoch high-resolution spectra with UVES starting at an early epoch of days before maximum brightness. Due to the extensive time coverage of SN 2017cbv, we are sensitive to photoionisation occurring in gas clouds over a large part of the CS environment. We did not find any time-evolution in any of the detected narrow absorption features, which implies that no detectable Na I gas clouds could be present with – cm and Ca II within – cm from the explosion. The detected gas clouds must therefore be located further from SN 2017cbv than the outer limit, while any gas closer to the explosion than the inner limit would have been ionised before the first spectrum was obtained.
Hosseinzadeh et al. (2017a) suggest that an early blue excess in the lightcurve could be due to ejecta hitting a non-degenerate companion star in a SD progenitor system. However, they do point out that a lack of a corresponding UV bump is in disagreement with the models of Kasen (2010) and propose several explanations for the discrepancy. A SD progenitor is predicted to have excavated large cavities with radii of – cm into the surrounding ISM and deposit matter at the edges (Badenes et al., 2007). Our observations thus exclude the presence of significant amounts of matter from parts of this range. At the same time, no significant amounts of gas could have been at radii of a few cm, distances at which DD He+C/O progenitor models predict matter to be deposited (Shen et al., 2013). There are thus several possible interpretations for our observations, or combinations of them:
-
•
There is no CS gas and the detected absorption features are part of the ISM of NGC 5643 and unrelated to SN 2017cbv.
-
•
There is a CS cavity within the exclusion range, but the Na I and Ca II columns present at the edges are below the detection threshold with and
. Assuming normal abundances, the swept up H I mass must be M☉, suggesting that the ISM had a very low density. -
•
The outflowing matter of an SD progenitor system created a cavity larger than cm (consistent with models of Badenes et al., 2007) and at least some of the detected absorption features correspond to gas deposited at the edges.
Our observations should add useful information to the open progenitor question of SN 2017cbv and SNe Ia in general. A SD progenitor system as that proposed by Hosseinzadeh et al. (2017a) should have a CS environment comparable to that described in Badenes et al. (2007). While we cannot exclude the full range of possible CS gas shells in this model, we also do not find any evidence for significant amounts of CS gas. This suggests a progenitor model with little to no CS matter for SN 2017cbv. Late time observations, when SN 2017cbv reaches a nebular phase should provide further evidence, if there was a non-degenerate companion in the progenitor system. In the cases of SNe 2011fe and 2014J, nebular spectra provided strong evidence for the absence of a non-degenerate companion star (Lundqvist et al., 2015).
References
- Amanullah et al. (2015) Amanullah, R., Johansson, J., Goobar, A., et al. 2015, MNRAS, 453, 3300
- Badenes et al. (2007) Badenes, C., Hughes, J. P., Bravo, E., & Langer, N. 2007, ApJ, 662, 472
- Baldwin et al. (1985) Baldwin, J. A., Phillips, M. M., & Carswell, R. F. 1985, MNRAS, 216, 41P
- Borkowski et al. (2009) Borkowski, K. J., Blondin, J. M., & Reynolds, S. P. 2009, ApJ, 699, L64
- Bulla et al. (2018) Bulla, M., Goobar, A., Amanullah, R., Feindt, U., & Ferretti, R. 2018, MNRAS, 473, 1918
- Chomiuk et al. (2016) Chomiuk, L., Soderberg, A. M., Chevalier, R. A., et al. 2016, ApJ, 821, 119
- Chugai (2008) Chugai, N. N. 2008, Astronomy Letters, 34, 389
- Cohen & Meloy (1975) Cohen, J. G., & Meloy, D. A. 1975, ApJ, 198, 545
- Dekker et al. (2000) Dekker, H., D’Odorico, S., Kaufer, A., Delabre, B., & Kotzlowski, H. 2000, in Society of Photo-Optical Instrumentation Engineers (SPIE) Conference Series, Vol. 4008, Optical and IR Telescope Instrumentation and Detectors, ed. M. Iye & A. F. Moorwood, 534
- Dilday et al. (2012) Dilday, B., Howell, D. A., Cenko, S. B., et al. 2012, Science, 337, 942
- Dong et al. (2015) Dong, S., Katz, B., Kushnir, D., & Prieto, J. L. 2015, MNRAS, 454, L61
- Ferretti et al. (2016) Ferretti, R., Amanullah, R., Goobar, A., et al. 2016, A&A, 592, A40
- Goobar (2008) Goobar, A. 2008, ApJ, 686, L103
- Goobar & Leibundgut (2011) Goobar, A., & Leibundgut, B. 2011, Annual Review of Nuclear and Particle Science, 61, 251
- Graham et al. (2015) Graham, M. L., Valenti, S., Fulton, B. J., et al. 2015, ApJ, 801, 136
- Hoang (2017) Hoang, T. 2017, ApJ, 836, 13
- Hosseinzadeh et al. (2017a) Hosseinzadeh, G., Sand, D. J., Valenti, S., et al. 2017a, ApJ, 845, L11
- Hosseinzadeh et al. (2017b) Hosseinzadeh, G., Howell, D. A., Sand, D., et al. 2017b, The Astronomer’s Telegram, No. 10164, 164
- Huebner & Mukherjee (2015) Huebner, W. F., & Mukherjee, J. 2015, Planet. Space Sci., 106, 11
- Iben & Tutukov (1984) Iben, Jr., I., & Tutukov, A. V. 1984, ApJS, 54, 335
- Johansson et al. (2013) Johansson, J., Amanullah, R., & Goobar, A. 2013, MNRAS, 431, L43
- Johansson et al. (2017) Johansson, J., Goobar, A., Kasliwal, M. M., et al. 2017, MNRAS, 466, 3442
- Kasen (2010) Kasen, D. 2010, ApJ, 708, 1025
- Kausch et al. (2015) Kausch, W., Noll, S., Smette, A., et al. 2015, A&A, 576, A78
- Koribalski et al. (2004) Koribalski, B. S., Staveley-Smith, L., Kilborn, V. A., et al. 2004, AJ, 128, 16
- Kundu et al. (2017) Kundu, E., Lundqvist, P., Pérez-Torres, M. A., Herrero-Illana, R., & Alberdi, A. 2017, ApJ, 842, 17
- Lundqvist et al. (2015) Lundqvist, P., Nyholm, A., Taddia, F., et al. 2015, A&A, 577, A39
- Maeda et al. (2016) Maeda, K., Tajitsu, A., Kawabata, K. S., et al. 2016, ApJ, 816, 57
- Maguire et al. (2013) Maguire, K., Sullivan, M., Patat, F., et al. 2013, MNRAS, 436, 222
- Margutti et al. (2014) Margutti, R., Parrent, J., Kamble, A., et al. 2014, ApJ, 790, 52
- Modigliani et al. (2010) Modigliani, A., Goldoni, P., Royer, F., et al. 2010, in Proc. SPIE, Vol. 7737, Observatory Operations: Strategies, Processes, and Systems III, 773728
- Patat et al. (2010) Patat, F., Cox, N. L. J., Parrent, J., & Branch, D. 2010, A&A, 514, A78
- Patat et al. (2007) Patat, F., Chandra, P., Chevalier, R., et al. 2007, Science, 317, 924
- Patat et al. (2013) Patat, F., Cordiner, M. A., Cox, N. L. J., et al. 2013, A&A, 549, A62
- Phillips et al. (2013) Phillips, M. M., Simon, J. D., Morrell, N., et al. 2013, ApJ, 779, 38
- Poznanski et al. (2012) Poznanski, D., Prochaska, J. X., & Bloom, J. S. 2012, MNRAS, 426, 1465
- Raskin & Kasen (2013) Raskin, C., & Kasen, D. 2013, ApJ, 772, 1
- Schlafly & Finkbeiner (2011) Schlafly, E. F., & Finkbeiner, D. P. 2011, ApJ, 737, 103
- Shen et al. (2013) Shen, K. J., Guillochon, J., & Foley, R. J. 2013, ApJ, 770, L35
- Simon et al. (2009) Simon, J. D., Gal-Yam, A., Gnat, O., et al. 2009, ApJ, 702, 1157
- Smette et al. (2015) Smette, A., Sana, H., Noll, S., et al. 2015, A&A, 576, A77
- Soker (2014) Soker, N. 2014, MNRAS, 444, L73
- Sollerman et al. (2005) Sollerman, J., Cox, N., Mattila, S., et al. 2005, A&A, 429, 559
- Sternberg et al. (2011) Sternberg, A., Gal-Yam, A., Simon, J. D., et al. 2011, Science, 333, 856
- Sternberg et al. (2014) —. 2014, MNRAS, 443, 1849
- Tartaglia et al. (2017) Tartaglia, L., Sand, D., Wyatt, S., et al. 2017, The Astronomer’s Telegram, No. 10158, 158
- Wakker & Mathis (2000) Wakker, B. P., & Mathis, J. S. 2000, ApJ, 544, L107
- Webbink (1984) Webbink, R. F. 1984, ApJ, 277, 355
- Whelan & Iben (1973) Whelan, J., & Iben, Jr., I. 1973, ApJ, 186, 1007