Open storm: a complete framework for sensing and control of urban watersheds
Abstract
Leveraging recent advances in technologies surrounding the Internet of Things, “smart” water systems are poised to transform water resources management by enabling ubiquitous real-time sensing and control. Recent applications have demonstrated the potential to improve flood forecasting, enhance rainwater harvesting, and prevent combined sewer overflows. However, adoption of smart water systems has been hindered by a limited number of proven case studies, along with a lack of guidance on how smart water systems should be built. To this end, we review existing solutions, and introduce open storm—an open-source, end-to-end platform for real-time monitoring and control of watersheds. Open storm includes (i) a robust hardware stack for distributed sensing and control in harsh environments (ii) a cloud services platform that enables system-level supervision and coordination of water assets, and (iii) a comprehensive, web-based “how-to” guide, available on open-storm.org, that empowers newcomers to develop and deploy their own smart water networks. We illustrate the capabilities of the open storm platform through two ongoing deployments: (i) a high-resolution flash-flood monitoring network that detects and communicates flood hazards at the level of individual roadways and (ii) a real-time stormwater control network that actively modulates discharges from stormwater facilities to improve water quality and reduce stream erosion. Through these case studies, we demonstrate the real-world potential for smart water systems to enable sustainable management of water resources.
I Introduction
Advances in wireless communications and low-power sensing are enabling a new generation of “smart cities,” which promise to improve the performance of municipal services and reduce operating costs through real-time analytics and control [1]. While some applications of “smart” infrastructure have received a great deal of attention—such as autonomous vehicles[2, 3], energy grid management [3], and structural health monitoring[4, 3]—integration of these technologies into water systems has lagged behind. However, “smart” water systems offer new inroads for dealing with many of our most pressing urban water challenges, including flash flooding, aquatic ecosystem degradation, and runoff pollution. The goal of this paper is to provide an end-to-end blueprint for the next generation of autonomous water systems, with a particular focus on managing urban stormwater. Towards this goal, we introduce open storm, an open source framework that combines sensing, real-time control, wireless communications, web-services and domain-specific models. We illustrate the potential of open storm through two real-world case studies: 1) a 2,200 km2 wireless flood forecasting network in Texas, and 2) an 11 km2 real-time stormwater control network in Michigan. Most importantly, to encourage broader adoption by the water resources community, this paper is accompanied by extensive supplementary materials on open-storm.org, including videos, photos, source code, hardware schematics, manufacturing guides, and deployment instructions. These materials make it possible for newcomers to implement their own “smart” stormwater systems, without extensive experience in programming or embedded systems design.
II Background
II-A Motivation
Effective management of water supply and water excess are some of the largest engineering problems faced by cities today [5], and in the wake of rapid urbanization, aging infrastructure, and a changing climate, these challenges are expected to intensify in the decades to come [6, 7]. Floods are the leading cause of severe weather fatalities worldwide, accounting for roughly 540,000 deaths between 1980 and 2009 [8]. Furthermore, large quantities of metals, nutrients, and other pollutants are released during storm events, making their way via streams and rivers into lakes and coastal zones [9, 10]. The need to manage pollutant loads in stormwater has persistently been identified as one of our greatest environmental challenges [11]. To contend with these concerns, most communities maintain dedicated gray infrastructure (pipes, ponds, basins, wetlands, etc.) to convey and treat water during storm events. However, many of these systems are approaching the end of their design life [12]. At the same time, stormwater systems are being placed under greater stress due to larger urban populations, changes in land use, and the increasing frequency of extreme weather events[5, 7]. In some communities, stormwater and wastewater are combined, meaning they share the same pipes. For these systems, large storms often lead to combined sewer overflows, which release viruses, bacteria, nutrients, pharmaceuticals, and other pollutants into estuaries downstream [13]. When coupled with population stressors, it comes as little surprise that the current state of stormwater infrastructure in the United States has been given a near-failing grade by the American Society of Civil Engineers [14].
Engineers have traditionally responded to increasing demands on stormwater systems by expanding and constructing new gray infrastructure. However, the upsizing of pipes and storage elements can prove expensive, time-consuming, and may even result in deleterious long-term side effects. Benefits from stormwater conveyance facilities can be diminished if individual sites are not designed in a global context. Even when best management practices are followed, discharges from individual sites may combine to induce downstream flows that are more intense than those produced under unregulated conditions [15]. Without system-level coordination, gray infrastructure expansion may lead to overdesigned solutions that adversely impact flooding, increase stream erosion, and impair water quality[16]. In response to these concerns, green infrastructure (GI) has been proposed as an alternative to traditional “steel and concrete” stormwater solutions. These systems use smaller, distributed assets—such as bioswales, green roofs and rain gardens—to condition flows and improve water quality. However, recent research has raised questions about the scalability and maintenance requirements of green infrastructure [17]. Regardless of the choice between “gray” or “green”, new construction is limited by cost, and often cannot keep pace with evolving community needs. To preserve watershed and ecological stability, there is an urgent need to incorporate systems thinking into stormwater designs and to engineer solutions that can optimize stormwater system performance—not only for individual sites, but for entire watersheds.
II-B The promise of sensing and control
“Smart” water systems promise to improve the study and management of water resources by extending monitoring and control beyond centralized facilities and into watersheds as a whole. With increased access to inexpensive sensors and wireless communications, the feasibility of deploying and maintaining large sensor networks across urban landscapes is now within reach for many public utilities and research groups. While many of the technologies have existed for some time, it was not until the integration of wireless sensor networks with web services (i.e. the Internet of Things) that large networks consisting of hundreds or thousands of heterogeneous devices could be managed reliably[18]. This in turn has enabled watersheds to be studied at spatial and temporal scales that were previously unattainable. By densely instrumenting urban watersheds, researchers can finally begin to understand the complex and spatially variable feedbacks that govern water flow and quality across the built environment. A system-level understanding of urban watershed dynamics will provide decision makers with actionable insights to alert the public, and improve stewardship of water resources.
Beyond new insight gained through sensing, the ability to dynamically regulate water levels across a watershed will reduce flooding, preserve riparian ecosystems, and allow for distributed treatment of stormwater. While these functions were previously achieved only through construction of static gray infrastructure or centralized treatment facilities, the addition of remotely-controlled valves and pumps promises to realize the same benefits while at the same time reducing costs, expanding coverage, and allowing system performance to scale flexibly with changing hydrologic conditions. Adding valves to existing stormwater facilities, for instance, can extend hydraulic retention time, thereby promoting the capture of sediment-bound pollutants[19, 20]. Modulation of flows (hydrograph shaping) may reduce erosion at downstream locations by ensuring that discharges do not exceed critical levels[19]. More fundamentally, distributed control will enable operators to coordinate outflows from stormwater sites (tens to hundreds) across an entire city. Along with reducing flooding, this will allow water managers to utilize the latent treatment capacity of existing ponds and wetlands—effectively allowing a watershed to function as a distributed wastewater treatment plant[20].
Such a vision for “smart” stormwater systems is no longer limited by technology. Rather, adoption of smart water systems has been hindered by (i) a reliance on proprietary technologies, (ii) a lack of proven case studies, and (iii) an absence of end-to-end solutions that are specifically designed and tested for water resources applications. To enable truly holistic management and control, there is an urgent need to combine modern technologies with domain knowledge from water sciences—something which present solutions do not address or make transparent. These solutions are reviewed next, after which the open storm framework is introduced as an end-to-end blueprint for “smart” water systems management. This open-source framework combines low-power wireless hardware with modern cloud computing services and domain-specific applications to enable scalable, real-time control of urban water systems.
III Existing technologies
Real-time sensing and control of water infrastructure is not a new idea. Supervisory control and data acquisition (SCADA) systems have long been used to monitor and control critical water infrastructure [21]. In addition to these traditional technologies, there has been a recent explosion in the development of wireless sensor networks (WSNs) for water resources management. While these technologies have made great strides in enabling monitoring and control of water systems, a lack of end-to-end solutions has inhibited system-scale management of watersheds. In this section, we review existing technological solutions for water system monitoring and control, and describe how open storm advances the state of the art by providing the first open source, end-to-end solution for distributed water systems management.
III-A SCADA systems
Most water utilities use supervisory control and data acquisition (SCADA) systems to manage the conveyance, treatment and distribution of water [21]. These systems comprise collections of devices, communication protocols, and software that enable remote monitoring and control of water assets [21]. Most commonly applied in water distribution systems, SCADA systems typically monitor parameters that indicate service quality—such as flows, pressures, and chemical concentrations—and then use this information to control the operation of pumps and valves in real-time [21]. Control may be manual or automatic, and in some cases may integrate optimization algorithms, decision support systems and advanced control logic [21]. While legacy SCADA systems remain popular among water utilities, they suffer from limitations in three major areas: interoperability, scalability and security.
Perhaps the most critical limitation of legacy SCADA systems is the lack of interoperability between systems, reliance on proprietary protocols, and non-extensible software [22]. Traditional SCADA systems are often isolated and incapable of intercommunication [22]. Systems that manage water in one municipality, for instance, may be incapable of communicating with those in another municipality, despite sharing the same service area. Moreover, different SCADA systems within the same jurisdiction may also be isolated, meaning that management of stormwater systems may not in any way inform the operation of wastewater treatment facilities downstream. This lack of communication between water management architectures makes it difficult to coordinate control actions at the watershed scale. Proprietary SCADA systems are also often unable to interface with modern software layers, like Geographic Information Systems (GIS), network analysis software, or hydrologic models [22]. For this reason, SCADA-based control often cannot take advantage of modern domain-specific tools that would enable system-scale optimization of watershed resources.
The capacity of SCADA systems to implement watershed-scale control is also limited by a lack of spatial coverage. Due to their large power footprint and maintenance requirements, traditional SCADA systems are typically limited to centralized water assets with dedicated line power, such as drinking water distribution systems and wastewater treatment facilities [23]. Sensors are usually deployed at a select few locations within the network—like treatment plants, pump stations and boundaries with other systems—and in many cases plant and pump station discharges are not even recorded [21]. For decentralized applications, such as stormwater networks or natural river systems, the cost and power usage of traditional SCADA systems are prohibitive. As such, these distributed resources often go unmonitored and uncontrolled.
Recent studies have also raised concerns about the security of SCADA systems, many of which were designed and installed decades ago [24, 25]. Many legacy SCADA systems rely on specialized protocols without built-in support for authentication, such as MODBUS/TCP, EtherNet/IP and DNP317 [24, 25]. The use of unsecured protocols means that it is possible for unauthorized parties to execute commands remotely on a device in the SCADA network [24]. To cope with this problem, SCADA networks are often isolated from public networks, such as the internet. However, remote attacks are still possible—particularly through the use of unsecured radio channels [25]. Moreover, isolation from public networks limits the use of modern web services such as cloud computing platforms. Reliance on closed networks and proprietary interfaces may also lend a false sense of security to legacy SCADA systems—a concept known as security through obscurity [24]. For these reasons, SCADA systems have gained the reputation of being relatively closed and only manageable by highly-trained operators or specialized local consultants. While SCADA systems remain the most popular platform for managing urban water systems, new tools are needed to improve security, expand coverage, and encourage integration with modern software.
III-B Wireless sensor networks
The past decade has witnessed a large reduction in the cost and power consumption of wireless electronics; leveraging these advances, wireless sensor networks (WSNs) have opened up new frontiers in environmental monitoring, with applications ranging from biodiversity monitoring [26], forest fire detection [27, 28], precision agriculture [29], glacier research [30], and structural health monitoring [4]. Unlike SCADA systems, WSNs are ideal for low-cost, low-power, and low-maintenance applications, making them well-suited for the monitoring of large water systems like rivers and watersheds. WSNs have been applied to great success in applications ranging from flood monitoring to real-time stormwater control; however, current implementations are generally experimental or proprietary, resulting in a lack of discoverability, limited interoperability, and duplication of effort among projects.
Within the water sciences, flood monitoring represents a particularly important application area for WSNs. While several groups have worked to expand the capabilities of existing legacy flood detection networks [31, 32, 33], only a small number of groups have designed and deployed their own flood monitoring WSNs. Hughes et al. (2008) describe a 15-node riverine flood monitoring WSN in the United Kingdom, which interfaces with remote models, performs on-site computation, and sends location-specific flood warnings to stakeholders [34, 35]. Other riverine flood monitoring networks include a 3-node river monitoring network in Massachusetts, a 4-node network in Honduras [36], and—perhaps the largest unified flood monitoring network in the US—the Iowa Flood Information System (IFIS), which draws on a network of over 200 cellular-enabled sensor nodes [37]. While most existing flood-monitoring networks focus on large-scale river basins, flash-flooding has received considerably less attention in the WSN community. Marin-Perez et al. (2012) construct a 9-node WSN for flash flood monitoring in a 660 km2 semiarid watershed in Spain [38], while See et al. (2011) use a Zigbee-based WSN to monitor gully-pot overflows in an urban sewer system [39]. While most deployments are still pilot-scale, these projects demonstrate the potential of WSNs for distributed flood monitoring across a variety of scales and environments.
In addition to monitoring watershed hazards, a limited—but promising—number of projects are illustrating the potential of WSNs for real-time control. Web-enabled sensor nodes have been used to develop adaptive green infrastructure at a select number of pilot sites—for instance, by using weather forecasts to facilitate predictive rainwater harvesting and capture of sediment-bound pollutants[40]. At larger scales, a combined sewer network in South Bend, Indiana uses over 120 flow and depth sensors along with nine valves to actively modulate flows into the city’s combined sewer system [41]. This network optimizes the use of existing in-line storage and has achieved a roughly five-fold reduction in combined sewer overflows from 2006-2014 [41]—all without the construction of additional infrastructure. While distributed control of storm and sewer systems shows promise, most existing implementations are proprietary. A lack of transparency makes these solutions inaccessible to decision makers and the water resources community at large.
Although many research groups have realized the potential for real-time watershed monitoring, existing WSN deployments are generally small-scale and experimental in nature. In order for these networks to be accepted as “critical infrastructure” by the water resources community at large, consistent standards for design, deployment and functionality are needed. In designing their own WSNs, researchers tend to look towards previous research projects [36]. However, research papers rarely include the detailed documentation needed to implement an end-to-end sensor platform [36]. As a result, researchers are often forced to design and deploy their own WSNs from scratch. To prevent duplication of effort and ensure best practices, a community-driven how-to guide is urgently needed. Moreover, while proprietary control networks have proven their effectiveness in improving the performance of stormwater systems, an open source alternative is needed to encourage transparency, interoperability, and extensibility. Without open software, standards, and documentation, these new technologies risk becoming like the SCADA systems of old: isolated, proprietary, and incapable of intercommunication.
IV The open storm platform
Open storm provides a transparent and unified framework for sensing and control of urban watersheds. To our knowledge, it is the only open-source, end-to-end platform that combines real-time sensing, control and cloud services for the purpose of water resources management. The project is designed to foster engagement by lowering the technological barriers for stakeholders, decision makers, and researchers. To this end, the open storm framework is accompanied by a body of reference material that aims to make it easy for non-experts to deploy their own sensors and controllers. This living document, available at open-storm.org, provides tutorials, documentation, supported hardware, and case studies for end-to-end sensor network management. In addition to documenting core features, this guide details the (literal) nuts-and-bolts of sensor network deployment, including information that is typically not available in journal articles—such as mounting hardware, assembly instructions and deployment techniques.
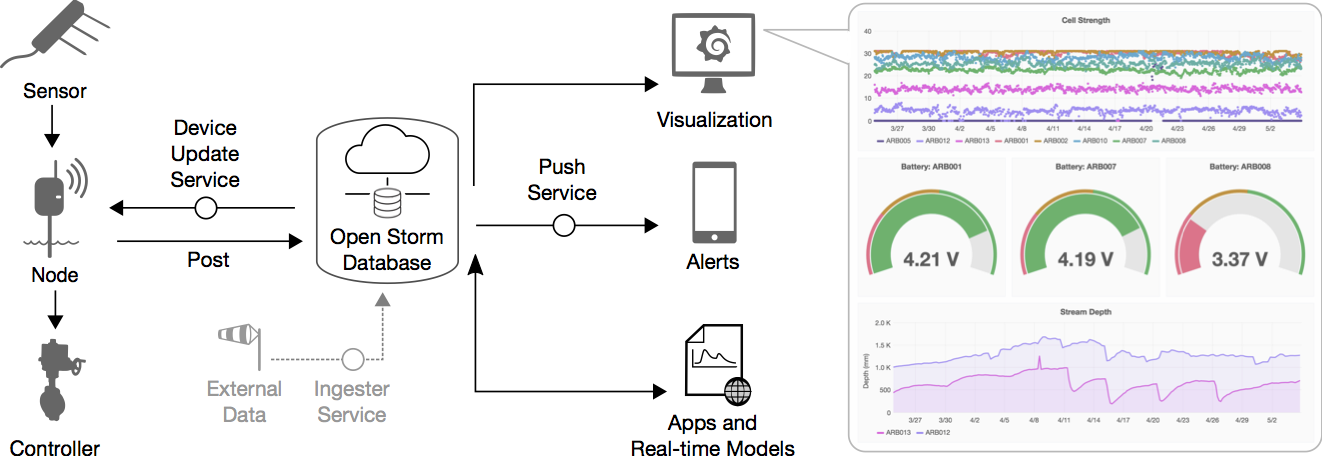
The open storm framework can broadly be divided into three layers: hardware, cloud services, and applications (Figure 2). The hardware layer includes devices that are deployed in the field—such as sensors for collecting raw data, actuators for controlling water flows, microprocessors, and wireless transmitters. The cloud services layer includes processing utilities that receive, store and process data, and interact with field-deployed devices through user-defined applications. Finally, the application layer defines how users, algorithms, and real-time models interact with field-deployed devices. This three-tier architecture allows for applications to be developed at a high level, without the need for low-level firmware programming. Together, these layers comprise a scalable framework that can easily be adapted to the needs of a wide variety of users and applications.
IV-A Hardware
IV-A1 The sensor node
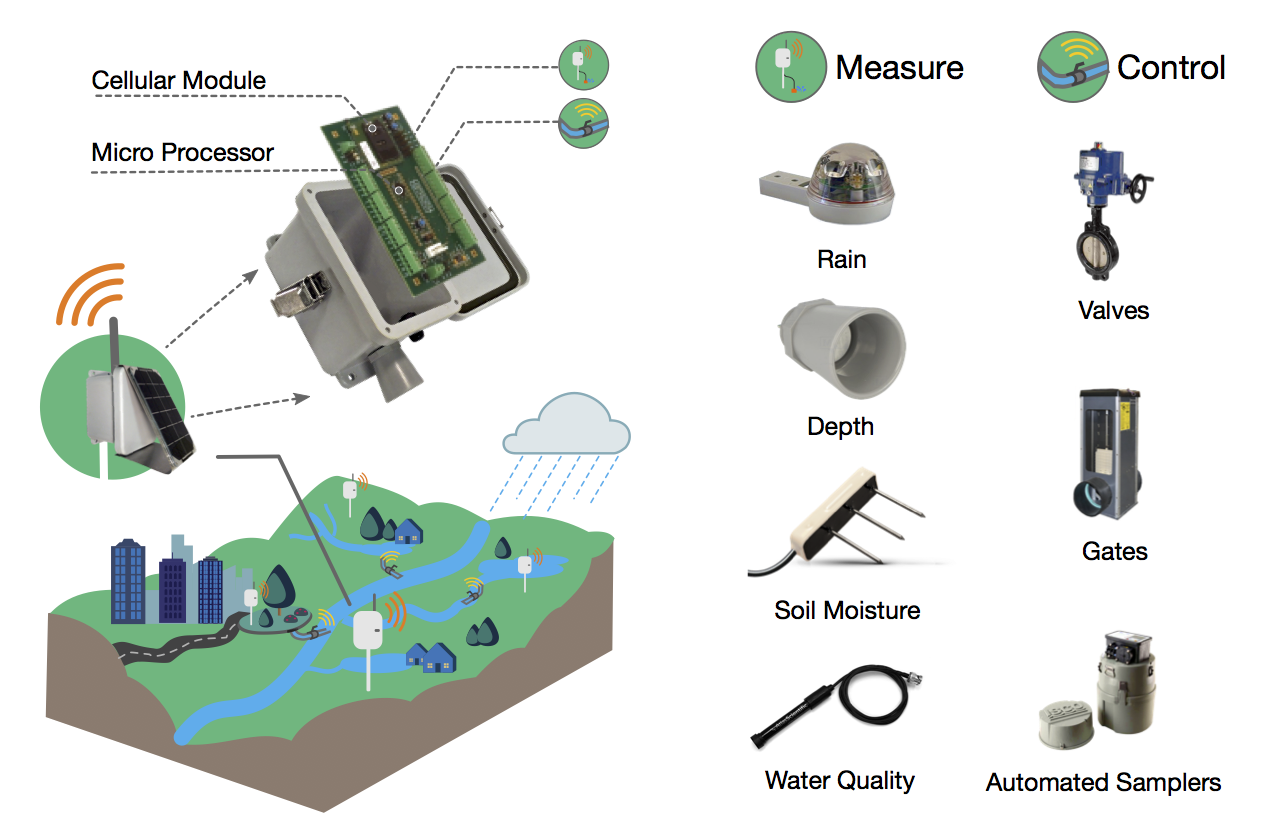
At its core, the open storm hardware layer (Figure 1) is enabled by the sensor node—a custom low-power embedded computer with wireless capabilities. The sensor node collects measurements from attached sensors, transmits and receives data from a remote server, and executes control actions. A microcontroller (PSOC5-LP by Cypress Semiconductor) serves at the processing unit for the board. This microcontroller is programmed with a simple operating system that schedules the tasks to be executed, and interfaces with a series of device drivers that control the behavior of attached sensors and actuators. The operating system is designed to minimize power use and consists of a single routine which (i) wakes the device from sleep mode, (ii) downloads pending instructions from the cloud server, (iii) takes sensor readings and triggers actuators, (iv) transmits sensor data to the server, and (v) puts the device back into sleep mode. The sensor node spends the majority of its deployment in sleep mode, allowing it to conserve battery power and remain in the field for an extended period of time.
The sensor node uses wireless telemetry to transmit and receive data from a remote server. While internet connectivity can be achieved through a number of wireless protocols, open storm nodes currently use a cellular communications protocol, which enables telemetry through 2G, 3G and 4G LTE cellular networks. Cellular connectivity is implemented through the use of a cellular module (by Telit), along with a small antenna for broadcasting the wireless signal. Compared to other protocols (such as satellite or wi-fi), cellular telemetry is especially suitable for urban and suburban environments due to (i) consistent coverage, (ii) relatively low cost, and (iii) high data throughput. At the time of writing, IoT cellular data plans can be purchased for under $5 per month per node (1-10 MB), making it financially feasible for even small research groups to maintain large-scale networks.
The sensor node is equipped with a power regulation subsystem to provide power to the microcontroller and attached devices. The power supply system consists of four components: (i) a battery, (ii) a solar panel, (iii) a charge controller, and (iv) a voltage converter. The voltage converter permits the sensor node to be powered across a range of 3-40V. While most sensor nodes are powered by a 3.7V Lithium Ion battery, 12V batteries can also be used for higher-voltage sensors and actuators. The solar panel and solar charger are used to recharge the battery, allowing the device to remain in the field without routine maintenance. At the time of writing, many field-deployed sensor nodes have reported data for over a year without loss of power.
Detailed technical information regarding the sensor node—including parts, schematics and programming instructions—are available online at open-storm.org/node. Excluding the cost of auxiliary sensors, the sensor node can currently be assembled from off-the-shelf parts for a price of approximately $350 per node.
IV-A2 Sensors and actuators
The open storm platform supports an extensive catalog of digital and analog environmental sensors. Typical sensors include (i) ultrasonic and pressure-based water level sensors, (ii) soil moisture sensors, (iii) tipping-bucket and optical rain gages, (iv) automated grab samplers for assessing pollutant loads, and (v) in-situ water quality sensors, including probes for dissolved oxygen, pH, temperature, conductivity, dissolved solids, and oxidation-reduction potential. While many sensors are known to work “out of the box”, new sensors can be quickly integrated by adding device drivers to the sensor node firmware. Support for arbitrary sensors is provided by the microcontroller’s system-on-chip (SoC), which allows for analog and digital peripherals—like analog-to-digital converters, multiplexers, and logic gates—to be generated using programmable blocks in the device firmware. In addition to environmental sensors, the sensor node also includes internal sensors that report device health statistics, including battery voltage, cellular reception strength, and connection attempts. These device health statistics help to diagnose network issues, and can be used as inputs to remote trigger routines. Sensors can be configured remotely using web services (see cloud services section). This capability allows users to turn sensors on or off, or to change the sampling frequency of a sensor without reprogramming the device in the field.
The open storm platform also supports an array of actuators that can be used to move mechanical devices in the field. These devices are used to guide the behavior of water systems in real-time, by controlling the flow of water in ponds, channels and pipes. Butterfly valves are one common type of actuating device, and are typically used to control discharge from storage elements such as retention basins. Valves can be opened, closed, or configured across any number of partially opened configurations to modulate flows. As with onboard sensors, these devices are operated remotely using commands sent from a server. Control signals can be specified manually, or through automated control algorithms.
Detailed technical information regarding supported sensors and actuators, along with guides for integrating new devices are provided online at open-storm.org/sensors.
IV-B Cloud services
While sensor nodes can function independently by storing data and making decisions on a local level, integration with cloud services enables system-scale supervision, configuration, and control of field-deployed devices. Like a traditional SCADA system, the cloud services layer facilitates telemetry and storage of sensor data, provides visualization capabilities, and enables remote control of devices—either through manual input or through automated routines. However, unlike a traditional SCADA system, the cloud services layer also allows sensor nodes to communicate with a wide variety of user-defined web applications—including advanced data visualization tools, control algorithms, GIS software, external data ingesters, alert systems, and real-time hydrologic models. By combining real-time supervision and control with domain-specific tools, this architecture enables flexible system-scale control of water assets.
In brief, the cloud services layer performs the following core functions: (1) stores and processes remotely-transmitted data, (2) simplifies management and maintenance of field-deployed sensor nodes, and (3) enables integration with a suite of real-time models, control algorithms, and visualizations. These services are environment-agnostic, meaning that they can be deployed on a local server or a virtual server in the cloud. In practice, however, current open storm projects are deployed on popular cloud services—such as Amazon Elastic Compute Cloud (EC2)[42] or Microsoft Azure[43]—to ensure that computational resources flexibly scale with demand. In the following section, we describe the basic architecture, and present example applications that are included with the open storm platform.
The cloud services layer follows a simple design pattern, in which applications communicate with sensor nodes through a central database. On the device side, sensor nodes push sensor measurements to the database, and then query the database to determine the latest desired control actions. On the server side, applications query the latest sensor readings from the database, feed these sensor readings into user-defined applications, and then write commands to the database to control the behavior of field hardware remotely. This architecture allows field-deployed sensors to be managed through a single endpoint, and also allows new applications to be developed without modifying critical device firmware.
The database serves dual purposes as both a storage engine for sensor data, and as a communication layer between field-deployed sensors and web applications. The primary purpose of the database is to store incoming measurements from field-deployed sensors. Sensor nodes report measurements directly to the database via a secure web connection—using the same protocol that one might use to access web pages in a browser (HTTPS). The database address (URL) is specified in the sensor node firmware, allowing the user to write data to an endpoint of their choosing. In addition to storing sensor measurements, the database also enables bidirectional communication between the node and cloud-based applications by storing device configuration data, command signals, and data from external sources. Server applications communicate with the sensor node by writing commands to the database. These commands are then downloaded by the sensor node on each wakeup cycle. For example, a real-time control application might adjust outflow from a storage basin by writing a sequence of valve positions to the database. At each sampling interval, the sensor node will query the latest desired valve position and enact the appropriate control action. This system enables bidirectional communication with field-deployed sensor nodes without the need for complex middleware.
For its database backend, the open storm project uses InfluxDB, a time-series database that is optimized for high availability and throughput of time-series data[44]. Communications with the database backend are secured through the use of basic authentication (i.e. a username and password), as well as Transport Layer Security encryption (TLS/SSL). The use of basic authentication prevents unauthorized parties from executing malicious commands on the network, while the use of encryption prevents attackers from intercepting sensitive data. Because applications communicate with the sensor node through the database, this means that applications are secured automatically against attackers as well. Altogether, this system comprises a data backend that is secure, maintainable, and extensible.
IV-C Applications
The open storm platform features a powerful application layer that enables users to process and analyze data, build user interfaces, and control sensor nodes remotely. Applications are implemented by creating a series of subscriptions on the central database. These subscriptions perform one of three actions: (i) read from the database, (ii) write new entries to the database, and (iii) trigger actions based on user-specified conditions. While seemingly simple, this system allows for the development of a wide range of applications. A data visualization platform, for instance, is implemented by continuously querying sensor streams from the database; similarly, automated control is implemented by writing a continuous stream of commands. In the following section, we demonstrate the potential of the open storm application platform by presenting example applications, including a data visualization portal, a push alert system, adaptive control, and real-time integration with hydrologic models.
IV-C1 Network supervision and maintenance tools
Much like a traditional SCADA system, the open storm platform provides a web-based graphical user interface for real-time visualization and device configuration. Figure 2 shows an example dashboard, with time series of cellular connection strength (top), radial gauges for monitoring battery voltage (center), and real-time depth readings from two sensor nodes (bottom). Time series visualizations are implemented using the Grafana analytics platform[45], which allows users to develop customized dashboards that suit their individual needs. To facilitate remote configuration of sensor nodes, open storm also includes a web portal that allows users to change device parameters (such as sampling frequency), control actuator behavior, and set event triggers using a web browser.
IV-C2 Automated alerts and adaptive control
In addition to enabling manual supervision and control, open storm also provides a rich interface for triggering automatic actions based on user-specified conditions. Push alerts are one common type of trigger event. Alerts can be used to notify stakeholders of hazardous field conditions, such as flooding, or to recommend control strategies to operators in real time. Alerts are also used to notify the user about the health of the network—for instance, by sending push warnings when node battery voltages drop below a threshold, or by emitting a critical alert when data throughput ceases. These system health alerts allow network outages to be promptly diagnosed and serviced. Alerts can be pushed to a variety of endpoints, including email, text messages, or to social media platforms such as Twitter and Slack[46, 47]. The wide variety of available push notification formats means that the open storm platform is suited to handling both (i) confidential alerts for system operators, and (ii) public emergency broadcasts.
In addition to the alert system, subscriptions are also used to implement adaptive sampling and automatic control. Adaptive sampling allows the sampling frequency of the node to be changed remotely in response to weather forecasts, data anomalies, or manual user input[48]. This in turn allows hydrologically interesting events—such as storm events and dam releases—to be measured at an enhanced resolution. To manipulate sampling frequencies in response to changing weather conditions, for instance, weather forecasts are first downloaded into the open storm database using an external data ingester. Next, the subscription service parses the incoming data. If the service detects a probability of rain, the sampling frequency of a node is increased. When no precipitation is anticipated, the sampling frequency is decreased, allowing the node to conserve battery power. The same principle is used to implement automated control. The subscription service can be configured as a simple set-point or PID controller, for instance, by computing a control signal based on an input data stream111An example script for a PID controller is included in the Supplementary Information document. This controller can in turn be used to optimize outflow from a retention pond, by controlling the position of an outlet valve. More sophisticated control schemes can be implemented by attaching the subscription service to an online model, which optimizes control strategies over an entire stormwater network, achieving system-level benefits. Examples include the MatSWMM and pySWMM software packages[49, 50], which are used to simulate real-time control strategies for urban drainage networks.
Detailed information regarding cloud services and applications can be found on open-storm.org/cloud.
V Case Studies
To demonstrate the capabilities of the open storm platform, we present two ongoing case studies. The first is a real-time flash flood warning network for the Dallas–Fort Worth metroplex in Texas. This deployment detects flash floods at the level of individual roadways, allowing targeted alerts for motorists and improved routing of emergency services during storm events. The second case study is a “smart” stormwater control network in the City of Ann Arbor, Michigan. This deployment aims to improve water quality and mitigate stormwater damage by adaptively timing releases from retention basins across an entire watershed.
V-A Case study 1: Flood monitoring
Located in “flash-flood alley”, the Dallas–Fort Worth (DFW) metroplex has historically been one of the most flood-prone areas in the United States [51]. Chronic flooding results in an average of 17 fatalities per year in the state of Texas, with a majority of deaths arising from flash floods [51]. Despite recent efforts to improve stormwater management [52], lack of fine-scale runoff measurements inhibits prediction and communication of flash flood risks. To address this problem, we are using the open storm platform to build a real-time flash flood monitoring network. Drawing on the open storm real-time alert system, this network aims to improve disaster response by communicating flood risks to emergency managers in real-time, and by generating targeted alerts that will allow motorists to safely navigate around inundated roadways.
To date, urban flash flooding remains a poorly-understood phenomenon. There is currently no model that is capable of generating reliable flash flood estimates in urban areas [53]. Modeling of urban flash floods is complicated by an absence of natural flow paths and interaction of runoff with man-made structures [53]. However, lack of data at appropriate spatial and temporal scales also presents a major challenge. For reliable modeling of flash floods, Berne (2004) recommends using rainfall data at a minimum spatial resolution of 500 meters[54], while a recommended temporal resolution of 1-15 minutes for rainfall is recommended by Smith (2007) [55]. Existing rain gages and river stage monitors are often too sparsely distributed to meet these requirements. Within the DFW metroplex, NWS maintains 12 quality-controlled gages [56], while USGS provides precipitation data at 30 sites [57]. This means that the current spatial resolution of validated rain gages within the DFW metroplex is roughly 1 gage per 600 km2—too sparse for reliable prediction of flash floods. Likewise, current river stage monitors for the DFW region are largely deployed along mainstems of creeks and rivers with contributing areas ranging from 20 km2 to 21,000 km2 (and a median contributing area of 220 km2). While these gages provide excellent coverage of riverine flooding, they offer limited potential for capturing flash floods.
To fill coverage gaps and enable real-time flash flood forecasting, we are building a wide-area flood monitoring network that is specifically tailored to monitoring flash floods over small-scale catchments (ranging from about 3 to 80 km2 in size). Our approach is to leverage a large array of inexpensive depth sensors to capture runoff response at the scale of individual roadways, creeks, and culverts. By using inexpensive hardware, we are able to scale our network to a size that would be infeasible with state-of-the-art stage monitoring stations (such as those used by NOAA or USGS). At the time of writing, 40 sensor nodes have been allocated and built for the DFW flood monitoring project, with over 15 nodes currently deployed and reporting. These 40 sensor nodes have been built for a cost of $20,000 USD—less than the cost as a single USGS gaging station [58].222The installation cost for a USGS stage-discharge streamgaging station is roughly $20,000, with an annual recurring cost of approximately $16,000.
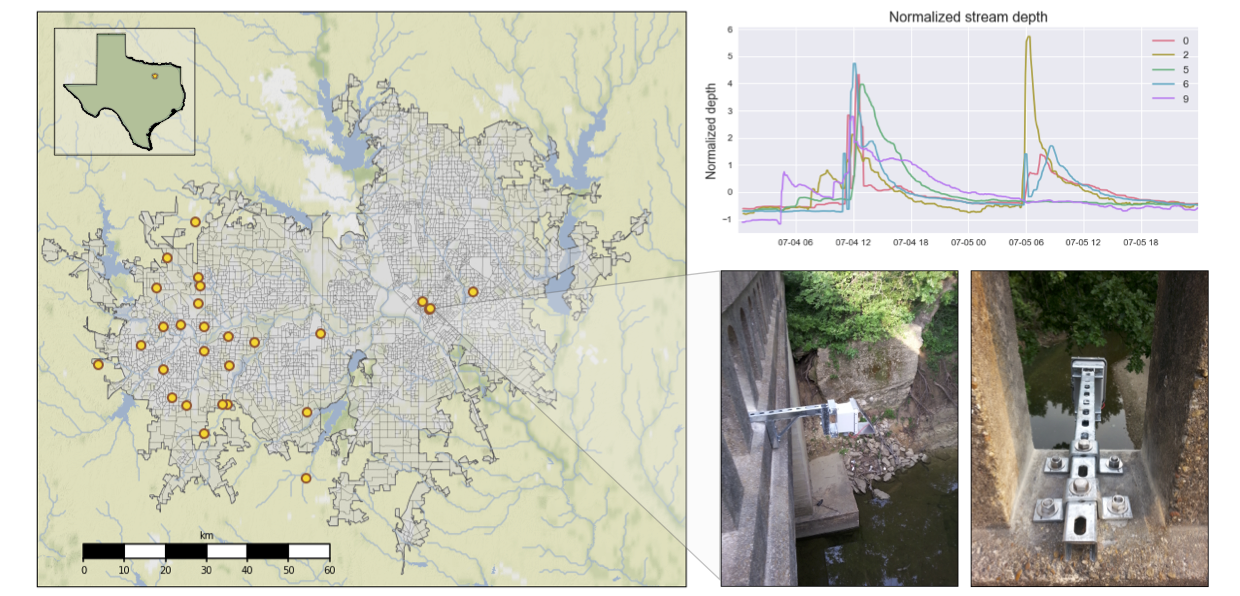
Figure 3 presents an overview of the DFW flood monitoring network. The left panel shows a map of the DFW metroplex, with current and proposed sensor node locations. The bottom-left panel shows a detail of a typical sensor node installation. Like most nodes in the network, this node is mounted to a bridge deck with an ultrasonic depth sensor pointed at the stream surface below. The sensor node records the depth to the water surface at a typical time interval of 3-15 minutes. The top-right plot shows a time series of stream depth during two distinct storm events for a sample of nodes on the network. From this plot, it can be seen that the runoff response varies widely between sensor locations, even in a relatively concentrated geographic area. During the second event, for instance, Node 2 (yellow) reports a large increase in discharge, while Node 9 (purple) reports no change in discharge. Comparison of the hydrographs with NEXRAD[59] radar data shows that the variability in stage is largely explained by spatial variability in the rainfall fields333See https://github.com/open-storm/docs.open-storm.org/wiki/Case-study:-Flood-Monitoring-in-Dallas-Fort-Worth. This result confirms the need for increased spatial resolution in stream stage measurements for flash flood monitoring.
The open storm platform enables detection and communication of flood risks on spatial and temporal scales appropriate for real-time disaster response and control. Adaptive management of traffic during extreme weather events represents one important application of this technology. The Dallas–Fort Worth flood monitoring network could improve disaster response by communicating flood risks to motorists in real-time, thereby allowing them to safely navigate around flooded roadways. This is especially important given that in the US, roughly 74% of fatalities from flooding are motor-vehicle related [8], and in Texas, as much as 93% of flood-related deaths result from walking or driving into floodwaters [51]. Current alert systems are to a large extent insensitive to spatial variability in flood response [35]. However, the open storm framework enables targeted alerts that can be integrated into existing mobile navigation apps. In a future that may be characterized by autonomous vehicles and vehicle-to-infrastructure communication [60], this technology could one day be used to adaptively route traffic during extreme weather events.
V-B Case study 2: Controlling Watersheds
As illustrated by the Dallas–Fort Worth flood-monitoring network, real-time measurements can play a pivotal role in providing alerts to stakeholders and improving our understanding of watershed dynamics. However, with the addition of active control, it is possible to not only monitor adverse events, but also to prevent them. The open storm platform is capable of enacting control on a watershed scale using distributed valve controllers, adaptive control schemes, and cloud-hosted hydrologic models. Instead of building bigger stormwater systems, operators may use real-time control to make better use of existing water infrastructure, mitigate flooding, and decrease contaminant loads into sensitive ecosystems.
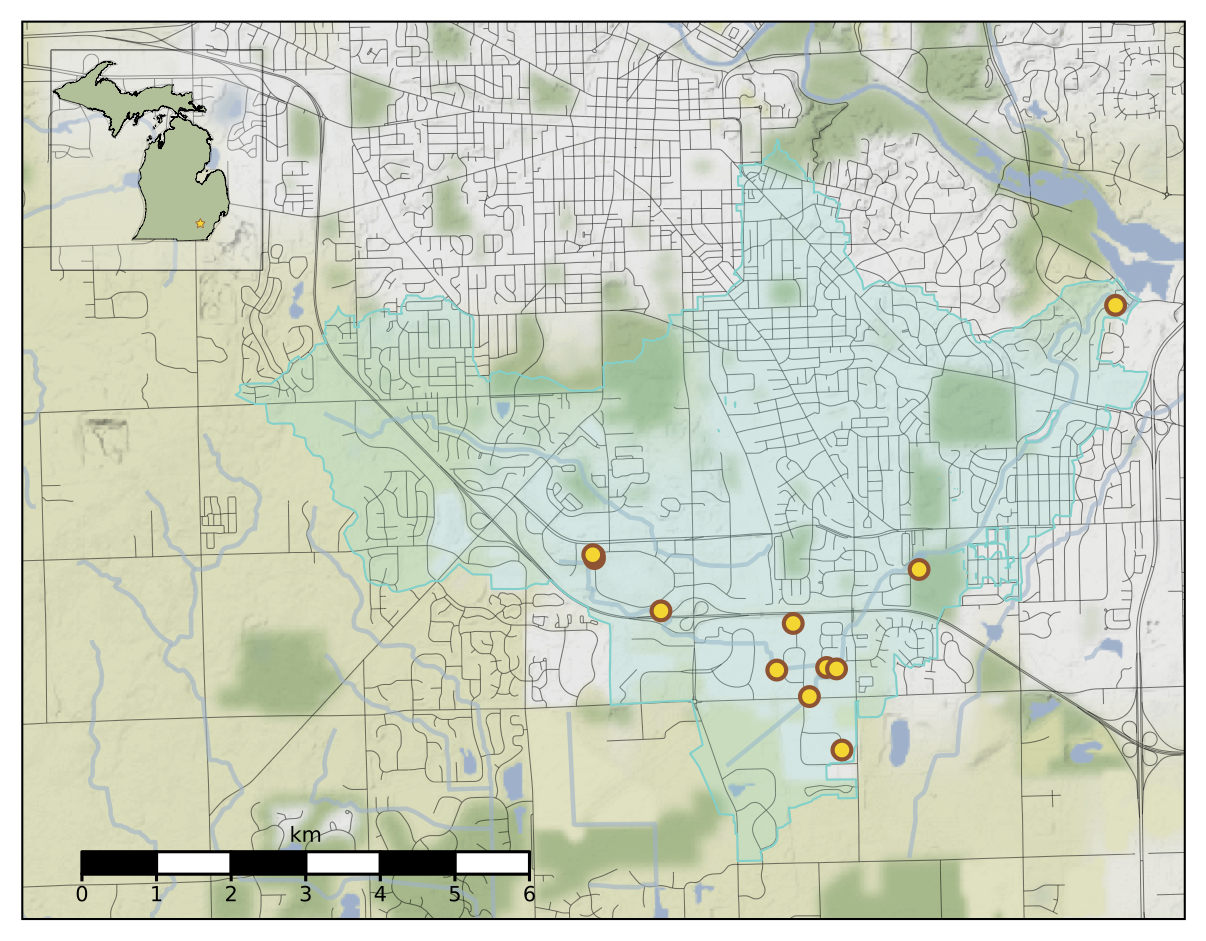
The open storm framework is presently being used to control an urban watershed in the City of Ann Arbor, Michigan. The Malletts Creek watershed—a 26.7 km2 tributary of the Huron River—has traditionally served as a major focal point in the city’s strategy to combat flooding and reduce runoff-driven water quality impairments [61]. Given its proximity to the Great Lakes, water resource managers have placed an emphasis on reducing nutrient loads from urban runoff. A majority of the discharge in Malletts creek originates from the predominantly impervious upstream (southwestern) reach of the watershed, while a significant, but smaller portion of the discharge originates from the central reach of the watershed. For this reason, local water resource managers have constructed a number of flood-control basins in the upstream segments of the catchment. It is these basins that are now modified to allow for real-time control of the watershed.
The watershed is modified for control at two locations by retrofitting existing basin outlets with remotely-operated valves (Figure 4). The first control point is a stormwater retention pond in the southern part of the watershed (shown in red in Figure 5). While originally designed as a flow-through (detention) pond, the addition of two 30 cm diameter gate valves allows for an additional 19 million liters of water to be actively retained or released. The second control point is a smaller retention pond, located in the central reach of the watershed (shown in green in Figure 5). This control site is retrofitted with a rugged 30 cm diameter butterfly valve. The position of each valve is controlled via an attached sensor node, which relays commands from a remote server. Each sensor node is equipped with a pair of ultrasonic sensors: one to measure the water depth at the pond, and one to measure the depth of the outflow stream. The control sites operate entirely on 12V battery power, along with a solar panel to recharge the battery during daylight hours. This configuration allows the controller to remain in the field permanently, without the need for a dedicated external electricity source.444With two people, installation at each site takes approximately one day. This includes time dedicated to mounting valves, sensors, and remotely-testing the equipment.
In addition to the two control sites, the Ann Arbor network is also instrumented with more than twenty sensor nodes that monitor system performance and characterize real-time site conditions. Using a combination of ultrasonic depth sensors, optical rain gages, and soil conductivity sensors, these nodes report stream stage, soil moisture, soil temperature, and precipitation accumulation approximately once every 10 minutes (with an increased resolution of 2-3 minutes during storms). An additional set of nodes is deployed to measure water quality—including dissolved oxygen, pH, temperature, oxidation reduction potential, conductivity, temperature—as well as an automated grab sampler for capturing contaminants of interest (such as heavy metals and microbes). These nodes are deployed at the inlet and outlet of constructed wetlands to determine how real-time control affects the removal of pollutants.
Measurements from the sensor network are validated using an external United States Geological Survey flow measurement station (USGS station 4174518), located at the watershed outlet. These federally-certified measurements are available freely on the web, making them relatively easy to ingest into the open storm framework as an external data source. Furthermore, localized weather forecasts are ingested from public forecasting services (darksky.net) to provide daily, hourly, and minute-level forecasts to inform the control of each site in the network[62]. These external data sources allow for near-instant validation of sensor data, and provide a holistic “snapshot” of system states.
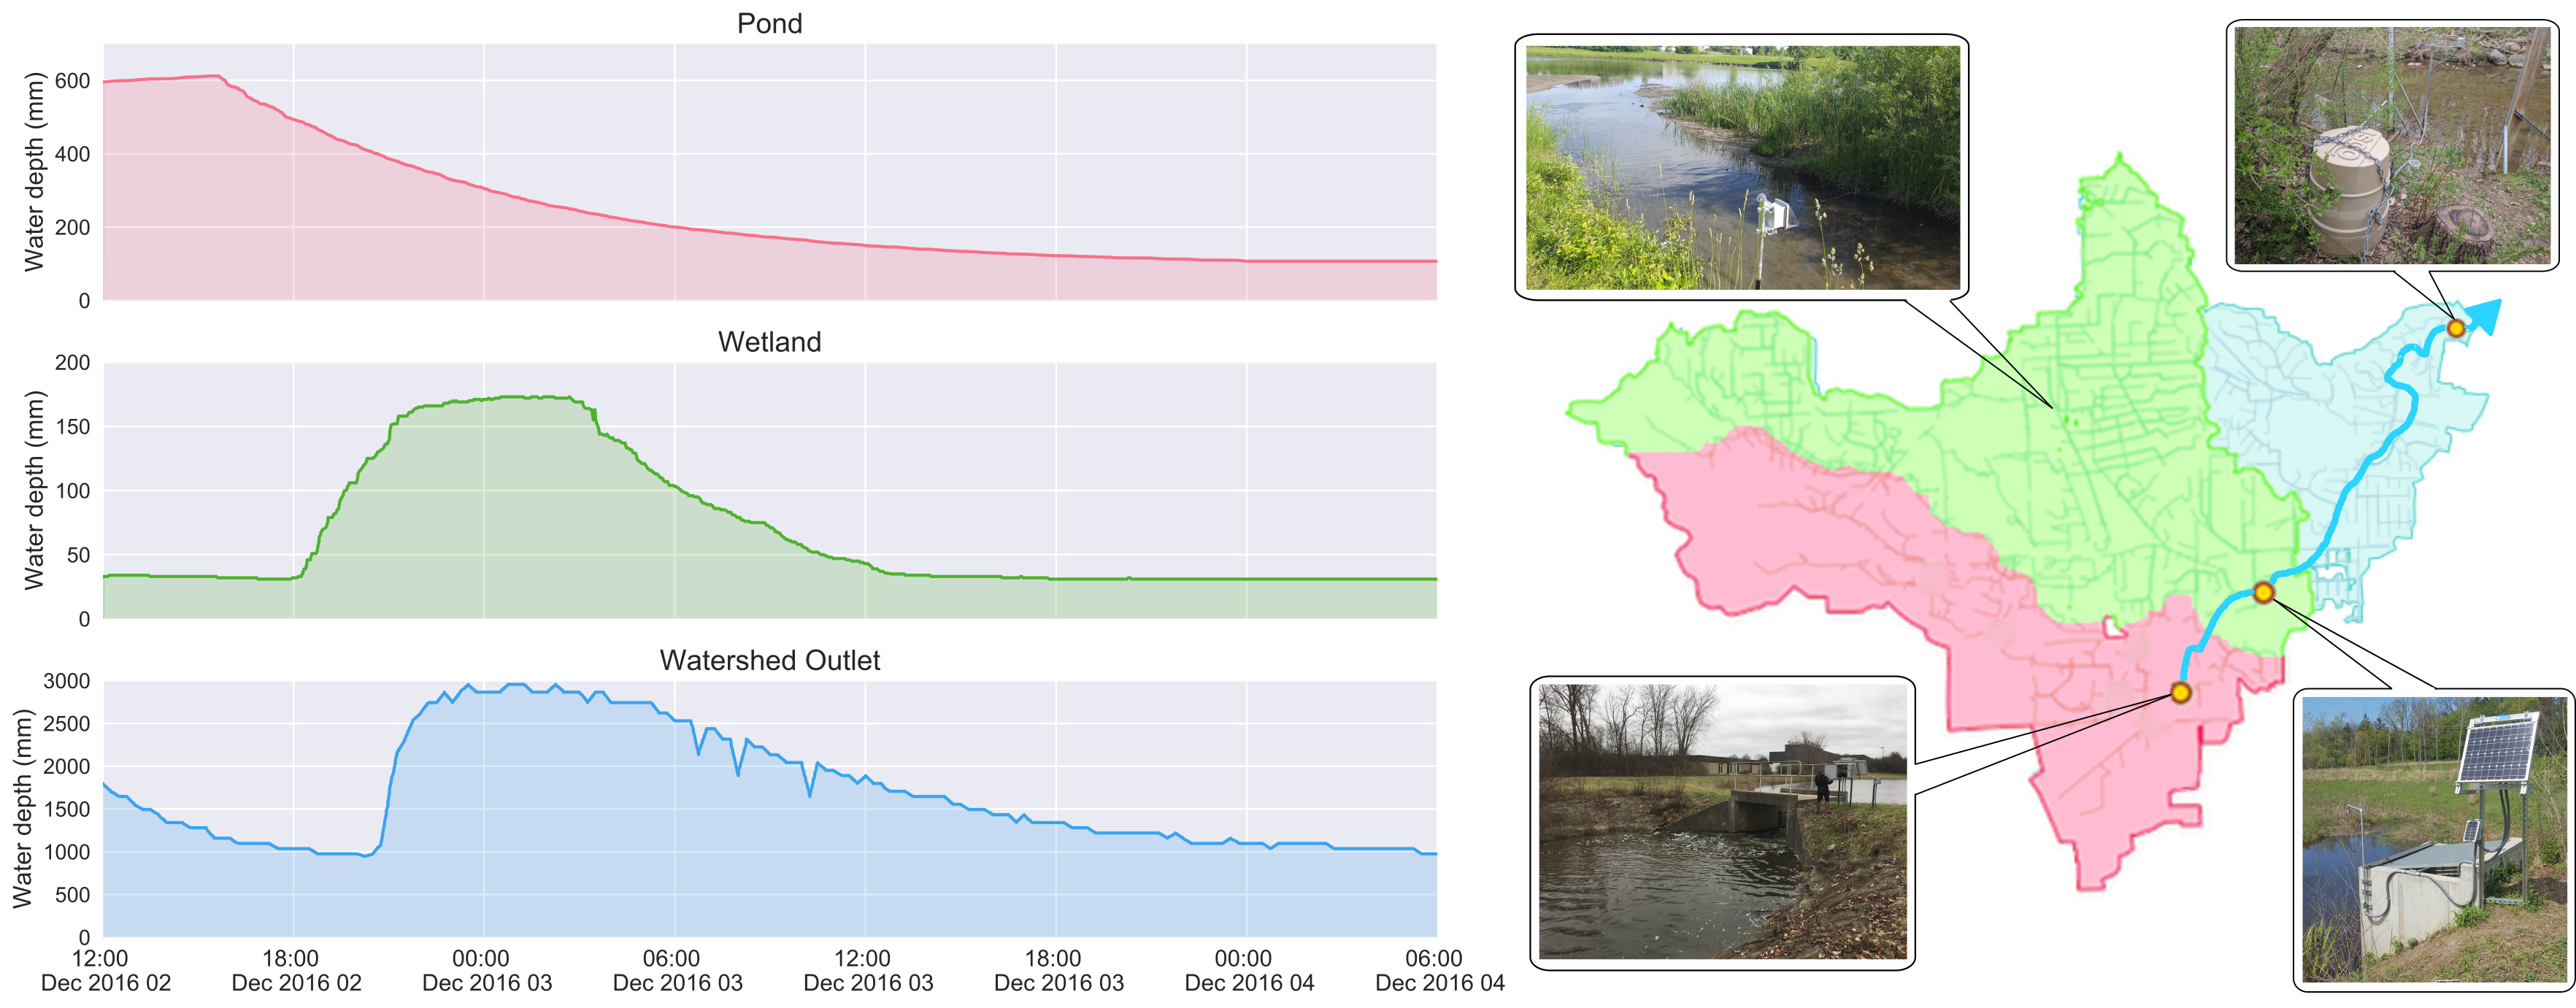
We confirm the effectiveness of the control network through a simple experiment. In this experiment, stormwater is retained at an upstream control site, then released gradually to maximize sedimentation and reduce erosion downstream. While it is known that the addition of control valves affords many localized benefits—such as the ability to increase retention and capture sediments [63]—the goal of this experiment is to test the extent to which control of individual sites can improve watershed-scale outcomes. The control experiment takes place on a river reach that stretches across three sites: a retention pond (upstream), a constructed wetland (center), and the watershed outlet. Figure 5 (right) shows the three test sites within the watershed, with the fractional contributing area of each site indicated by color. In this system, runoff flows from the retention pond (red) to the watershed outlet (blue) by way of an end-of-line constructed wetland (green) designed to treat water, capture sediments, and limit downstream erosion. Erosion, in particular, has been shown to be primary source of phosphorus in the watershed [48], thus emphasizing the need to reduce flashy flows. While the wetland serves a valuable purpose in improving water quality, it is sized for relatively small events. Specifically, the basin is designed to hold up to 57 million liters of stormwater but experiences as much as 760 million liters during a ten-year storm. Thus, it often overflows during storms, meaning that treatment benefits are bypassed. To maximize treatment capacity, a sensor node is placed into the wetland to measure the local water level and determine the optimal time to release from the retention pond upstream.
At the outset of the experiment, water is held in the upstream retention pond following a storm on December 1, 2016. Residual discharge from the original storm event can be observed as a falling hydrograph limb at the USGS gaging station (blue) during the first 10 hours of the experiment (Figure 5). The sensor located at the wetland is used to determine the time at which it is safe to release upstream flows without overflowing the wetland (Figure 5). Water is initially released from the pond at 4:00 pm on December 2, as indicated by a drop in the water level of the pond. Two hours later, the water level in the wetland begins to rise due to the discharge arriving from upstream. Finally, after another three hours, the discharge wave reaches the outlet, where it is detected by the USGS flow station. Over the course of the controlled release, the station registers roughly 19 million liters of cumulative discharge.
The control experiment shows demonstrable improvements in system performance compared to the uncontrolled case. While the water quality benefits will be measured in the coming year, a number of likely benefits can be posited. As measured, over 19 million liters were removed from the storm window and retained in the basin following the storm event. The residence time of the water in the pond increased by nearly 48 hours, increasing the potential for sedimentation [63]. The removal of stormwater flows also resulted in attenuation of the downstream hydrograph. The peak flows at the watershed outlet were measured to be 0.28 during the storm, but would have been nearly 0.60 had the valves in the basin not been closed. Based on prior studies in the watershed—which showed that flows in the stream correlate closely with suspended sediment concentrations—it can be estimated that the flows from the basin were discharged at roughly 60 mg/L, rather than 110 mg/L, thus nearly halving the concentration of suspended solids and total phosphorus in the flows originating from the controlled basin[48]. Moreover, the controlled experiment enhanced the effective treatment capacity at the wetland downstream, which would have overflowed during the storm, thus not treating the flows from the upstream pond. As such, the simple addition of one upstream valve provided additive benefits across a long chain of water assets, demonstrating firsthand how system-level benefits can be achieved beyond the scale of individual sites. While the water quality impacts of active control deserve further assessment, this study opens the door for adaptive stormwater control at the watershed scale. Rather than optimizing the performance of isolated sites, the open storm platform can be used to determine the optimal control strategy for an entire watershed, then enact it in real-time.
VI Conclusion
Open storm is an all-in-one, “batteries included” platform for monitoring and managing urban water systems. Its emphasis on extensive configurability, real-time response, and automated control make it an ideal choice for water system managers and environmental researchers alike. While many open hardware platforms exist, open storm is the first open-source, end-to-end platform that combines sensing, control and cloud computing in service of water resources management. Aside from providing a technological blueprint, open storm addresses the real-world requirements that can be expected in water resources applications, such as field-robustness, low-power operation and system-scale coordination. The open storm project has shown proven results in extending the capabilities of existing stormwater systems: both by increasing the spatiotemporal resolution of measurements, and by actively improving water quality through real-time control. However, open storm is not just a platform—it’s also a community of researchers, stakeholders and decision-makers who are dedicated to realizing smarter water systems. To assist in the dissemination and development of smart water systems, we are creating a living document at open-storm.org in order to share standards, reference materials, architectures, use cases, evaluation metrics, and other helpful resources. We invite users to participate in this project by sharing their experiences with designing, deploying and maintaining smart water systems.
References
- [1] A. Caragliu, C. D. Bo, and P. Nijkamp, “Smart cities in europe,” Journal of Urban Technology, vol. 18, no. 2, pp. 65–82, apr 2011. [Online]. Available: https://doi.org/10.1080%2F10630732.2011.601117
- [2] G. Dimitrakopoulos and P. Demestichas, “Intelligent transportation systems,” IEEE Vehicular Technology Magazine, vol. 5, no. 1, pp. 77–84, mar 2010. [Online]. Available: https://doi.org/10.1109\%2Fmvt.2009.935537
- [3] A. Zanella, N. Bui, A. Castellani, L. Vangelista, and M. Zorzi, “Internet of things for smart cities,” IEEE Internet of Things Journal, vol. 1, no. 1, pp. 22–32, feb 2014. [Online]. Available: https://doi.org/10.1109\%2Fjiot.2014.2306328
- [4] J. P. Lynch, “Design of a wireless active sensing unit for localized structural health monitoring,” Structural Control and Health Monitoring, vol. 12, no. 3-4, pp. 405–423, 2005. [Online]. Available: https://doi.org/10.1002%2Fstc.77
- [5] L. Mays, Water Resources Engineering. John Wiley & Sons, 2010. [Online]. Available: https://books.google.com/books?id=Nh8Y3vIjXK8C
- [6] A. Bronstert, D. Niehoff, and G. Bürger, “Effects of climate and land-use change on storm runoff generation: present knowledge and modelling capabilities,” Hydrological processes, vol. 16, no. 2, pp. 509–529, 2002.
- [7] T. Stocker, Climate change 2013: the physical science basis: Working Group I contribution to the Fifth assessment report of the Intergovernmental Panel on Climate Change. Cambridge University Press, 2014.
- [8] S. Doocy, A. Daniels, S. Murray, and T. D. Kirsch, “The human impact of floods: a historical review of events 1980-2009 and systematic literature review,” PLoS Currents, 2013. [Online]. Available: https://doi.org/10.1371\%2Fcurrents.dis.f4deb457904936b07c09daa98ee8171a
- [9] J. H. Ahn, S. B. Grant, C. Q. Surbeck, P. M. DiGiacomo, N. P. Nezlin, and S. Jiang, “Coastal water quality impact of stormwater runoff from an urban watershed in southern california,” Environmental Science & Technology, vol. 39, no. 16, pp. 5940–5953, aug 2005. [Online]. Available: https://doi.org/10.1021\%2Fes0501464
- [10] R. O. Carey, W. M. Wollheim, G. K. Mulukutla, and M. M. Mineau, “Characterizing storm-event nitrate fluxes in a fifth order suburbanizing watershed using in situ sensors,” Environmental Science & Technology, vol. 48, no. 14, pp. 7756–7765, jul 2014. [Online]. Available: https://doi.org/10.1021\%2Fes500252j
- [11] C. J. Vörösmarty, P. B. McIntyre, M. O. Gessner, D. Dudgeon, A. Prusevich, P. Green, S. Glidden, S. E. Bunn, C. A. Sullivan, C. R. Liermann, and P. M. Davies, “Global threats to human water security and river biodiversity,” Nature, vol. 467, no. 7315, pp. 555–561, sep 2010. [Online]. Available: https://doi.org/10.1038\%2Fnature09440
- [12] “Clean watersheds needs survey 2012,” Environmental Protection Agency, Tech. Rep., 2016. [Online]. Available: https://www.epa.gov/sites/production/files/2015-12/documents/cwns_2012_report_to_congress-508-opt.pdf
- [13] B. Sercu, L. C. V. D. Werfhorst, J. L. S. Murray, and P. A. Holden, “Sewage exfiltration as a source of storm drain contamination during dry weather in urban watersheds,” Environmental Science & Technology, vol. 45, no. 17, pp. 7151–7157, sep 2011. [Online]. Available: https://doi.org/10.1021\%2Fes200981k
- [14] 2013 Report Card for America’s Infrastructure. American Society of Civil Engineers, 2013. [Online]. Available: http://ascelibrary.org/doi/abs/10.1061/9780784478837
- [15] C. H. Emerson, C. Welty, and R. G. Traver, “Watershed-scale evaluation of a system of storm water detention basins,” Journal of Hydrologic Engineering, vol. 10, no. 3, pp. 237–242, may 2005. [Online]. Available: https://doi.org/10.1061\%2F\%28asce\%291084-0699\%282005\%2910\%3A3\%28237\%29
- [16] R. J. Hawley and G. J. Vietz, “Addressing the urban stream disturbance regime,” Freshwater Science, vol. 35, no. 1, pp. 278–292, mar 2016. [Online]. Available: https://doi.org/10.1086\%2F684647
- [17] “The importance of operation and maintenance for the long-term success of green infrastructure: A review of green infrastructure o&m practices in arra clean water state revolving fund projects,” Environmental Protection Agency, Tech. Rep., 2013. [Online]. Available: https://www.epa.gov/sites/production/files/2015-04/documents/green_infrastructure-om_report.pdf
- [18] B. P. Wong and B. Kerkez, “Real-time environmental sensor data: An application to water quality using web services,” Environmental Modelling & Software, vol. 84, pp. 505–517, oct 2016. [Online]. Available: https://doi.org/10.1016\%2Fj.envsoft.2016.07.020
- [19] B. Kerkez, C. Gruden, M. Lewis, L. Montestruque, M. Quigley, B. Wong, A. Bedig, R. Kertesz, T. Braun, O. Cadwalader, A. Poresky, and C. Pak, “Smarter stormwater systems,” Environmental Science & Technology, vol. 50, no. 14, pp. 7267–7273, 2016, pMID: 27227574. [Online]. Available: http://dx.doi.org/10.1021/acs.est.5b05870
- [20] A. Mullapudi, B. P. Wong, and B. Kerkez, “Emerging investigators series: building a theory for smart stormwater systems,” Environ. Sci.: Water Res. Technol., vol. 3, no. 1, pp. 66–77, 2017. [Online]. Available: https://doi.org/10.1039\%2Fc6ew00211k
- [21] L. W. Mays et al., Water distribution systems handbook. McGraw-Hill New York, 2000, vol. 17.
- [22] R. Powell and K. Hindi, Computing and Control for the Water Industry, ser. Computing and Control for the Water Industry. Research Studies Press, 1999. [Online]. Available: https://books.google.com/books?id=diFSAAAAMAAJ
- [23] A. Association, Instrumentation and Control, 3rd Ed. (M2):, ser. Manual of Water Supply Practices. American Water Works Association, 2001. [Online]. Available: https://books.google.com/books?id=UyzFCQAAQBAJ
- [24] V. M. Igure, S. A. Laughter, and R. D. Williams, “Security issues in {SCADA} networks,” Computers & Security, vol. 25, no. 7, pp. 498 – 506, 2006. [Online]. Available: http://www.sciencedirect.com/science/article/pii/S0167404806000514
- [25] L. Mays, Water supply systems security, ser. McGraw-Hill professional engineering. McGraw-Hill, 2004. [Online]. Available: https://books.google.com/books?id=QiJSAAAAMAAJ
- [26] A. Cerpa, J. Elson, M. Hamilton, J. Zhao, D. Estrin, and L. Girod, “Habitat monitoring,” in Workshop on Data communication in Latin America and the Caribbean - SIGCOMM LA 01. ACM Press, 2001. [Online]. Available: https://doi.org/10.1145\%2F371626.371720
- [27] M. Hefeeda and M. Bagheri, “Wireless sensor networks for early detection of forest fires,” in 2007 IEEE Internatonal Conference on Mobile Adhoc and Sensor Systems. IEEE, oct 2007. [Online]. Available: https://doi.org/10.1109%2Fmobhoc.2007.4428702
- [28] H. Soliman, K. Sudan, and A. Mishra, “A smart forest-fire early detection sensory system: Another approach of utilizing wireless sensor and neural networks,” in 2010 IEEE Sensors. IEEE, nov 2010. [Online]. Available: https://doi.org/10.1109%2Ficsens.2010.5690033
- [29] Y. Kim, R. G. Evans, and W. M. Iversen, “Remote sensing and control of an irrigation system using a distributed wireless sensor network,” IEEE Transactions on Instrumentation and Measurement, vol. 57, no. 7, pp. 1379–1387, July 2008.
- [30] K. Martinez, J. K. Hart, and R. Ong, “Environmental sensor networks,” Computer, vol. 37, no. 8, pp. 50–56, Aug 2004.
- [31] P. Bonnet, J. Gehrke, and P. Seshadri, “Querying the physical world,” IEEE Personal Communications, vol. 7, no. 5, pp. 10–15, 2000. [Online]. Available: https://doi.org/10.1109\%2F98.878531
- [32] T. Imielinski and S. Goel, “DataSpace: querying and monitoring deeply networked collections in physical space,” IEEE Personal Communications, vol. 7, no. 5, pp. 4–9, 2000. [Online]. Available: https://doi.org/10.1109\%2F98.878530
- [33] N. Chen, K. Wang, C. Xiao, and J. Gong, “A heterogeneous sensor web node meta-model for the management of a flood monitoring system,” Environmental Modelling & Software, vol. 54, pp. 222–237, apr 2014. [Online]. Available: https://doi.org/10.1016\%2Fj.envsoft.2014.01.014
- [34] D. Hughes, P. Greenwood, G. Blair, G. Coulson, P. Grace, F. Pappenberger, P. Smith, and K. Beven, “An experiment with reflective middleware to support grid-based flood monitoring,” Concurrency and Computation: Practice and Experience, vol. 20, no. 11, pp. 1303–1316, 2008. [Online]. Available: http://dx.doi.org/10.1002/cpe.1279
- [35] P. J. Smith, D. Hughes, K. J. Beven, P. Cross, W. Tych, G. Coulson, and G. Blair, “Towards the provision of site specific flood warnings using wireless sensor networks,” Meteorological Applications, vol. 16, no. 1, pp. 57–64, 2009. [Online]. Available: http://dx.doi.org/10.1002/met.130
- [36] E. A. Basha, S. Ravela, and D. Rus, “Model-based monitoring for early warning flood detection,” in Proceedings of the 6th ACM conference on Embedded network sensor systems - SenSys 08. ACM Press, 2008. [Online]. Available: https://doi.org/10.1145\%2F1460412.1460442
- [37] I. Demir and W. F. Krajewski, “Towards an integrated flood information system: Centralized data access, analysis, and visualization,” Environmental Modelling & Software, vol. 50, pp. 77–84, dec 2013. [Online]. Available: https://doi.org/10.1016\%2Fj.envsoft.2013.08.009
- [38] R. Marin-Perez, J. García-Pintado, and A. S. Gómez, “A real-time measurement system for long-life flood monitoring and warning applications,” Sensors, vol. 12, no. 12, pp. 4213–4236, mar 2012. [Online]. Available: https://doi.org/10.3390\%2Fs120404213
- [39] C. See, K. Horoshenkov, R. abd alhmeed, Y. Hu, and S. Tait, “A low power wireless sensor network for gully pot monitoring in urban catchments,” IEEE Sensors Journal, 2011. [Online]. Available: https://doi.org/10.1109\%2Fjsen.2011.2174354
- [40] M. Quigley, “Advanced rainwater harvesting for urban stormwater management,” EWRI Currents, vol. 17, no. 3, 2015.
- [41] L. Montestruque and M. D. Lemmon, “Globally coordinated distributed storm water management system,” in Proceedings of the 1st ACM International Workshop on Cyber-Physical Systems for Smart Water Networks - CySWater 15. ACM Press, 2015. [Online]. Available: https://doi.org/10.1145%2F2738935.2738948
- [42] (2017) Elastic compute cloud (ec2) – cloud server & hosting – aws. [Online]. Available: https://aws.amazon.com/ec2/
- [43] (2017) Microsoft azure: Cloud computing platform & services. [Online]. Available: https://azure.microsoft.com
- [44] (2017) Influxdb: Scalable datastore for metrics, events, and real-time analytics. [Online]. Available: https://www.influxdata.com/
- [45] (2017) Grafana – the open platform for analytics and monitoring. [Online]. Available: https://grafana.com
- [46] (2017) Twitter. it’s what’s happening. [Online]. Available: https://twitter.com
- [47] (2017) Slack: Where work happens. [Online]. Available: https://slack.com
- [48] B. P. Wong and B. Kerkez, “Adaptive measurements of urban runoff quality,” Water Resources Research, vol. 52, no. 11, pp. 8986–9000, 2016. [Online]. Available: http://dx.doi.org/10.1002/2015WR018013
- [49] G. Riaño-Briceño, J. Barreiro-Gomez, A. Ramirez-Jaime, N. Quijano, and C. Ocampo-Martinez, “MatSWMM – an open-source toolbox for designing real-time control of urban drainage systems,” Environmental Modelling & Software, vol. 83, pp. 143–154, sep 2016. [Online]. Available: https://doi.org/10.1016\%2Fj.envsoft.2016.05.009
- [50] (2017) pyswmm: Python wrappers for swmm. [Online]. Available: https://github.com/OpenWaterAnalytics/pyswmm
- [51] H. O. Sharif, T. L. Jackson, M. M. Hossain, and D. Zane, “Analysis of flood fatalities in texas,” Natural Hazards Review, vol. 16, no. 1, 2014. [Online]. Available: http://ascelibrary.org/doi/abs/10.1061/\%28ASCE\%29NH.1527-6996.0000145
- [52] L. Lee, “Do you live in flash flood alley? experts explain the central texas phenomenon and what residents should know.” txH2O, 2016.
- [53] H. A. P. Hapuarachchi, Q. J. Wang, and T. C. Pagano, “A review of advances in flash flood forecasting,” Hydrol. Process., vol. 25, no. 18, pp. 2771–2784, mar 2011. [Online]. Available: http://dx.doi.org/10.1002/hyp.8040
- [54] A. Berne, G. Delrieu, J.-D. Creutin, and C. Obled, “Temporal and spatial resolution of rainfall measurements required for urban hydrology,” Journal of Hydrology, vol. 299, no. 3-4, pp. 166–179, dec 2004. [Online]. Available: http://dx.doi.org/10.1016/j.jhydrol.2004.08.002
- [55] J. A. Smith, M. L. Baeck, K. L. Meierdiercks, A. J. Miller, and W. F. Krajewski, “Radar rainfall estimation for flash flood forecasting in small urban watersheds,” Advances in Water Resources, vol. 30, no. 10, pp. 2087–2097, oct 2007. [Online]. Available: http://dx.doi.org/10.1016/j.advwatres.2006.09.007
- [56] (2017) F6 climate data. [Online]. Available: https://www.weather.gov/fwd/f6
- [57] (2017) Texas water dashboard. [Online]. Available: https://txpub.usgs.gov/txwaterdashboard
- [58] H. Sheehan, Personal communication.
- [59] T. D. Crum and R. L. Alberty, “The wsr-88d and the wsr-88d operational support facility,” Bulletin of the American Meteorological Society, vol. 74, no. 9, p. 1669–1687, Sep 1993. [Online]. Available: http://dx.doi.org/10.1175/1520-0477(1993)074<1669:TWATWO>2.0.CO;2
- [60] D. Jiang and L. Delgrossi, “Ieee 802.11p: Towards an international standard for wireless access in vehicular environments,” in VTC Spring 2008 - IEEE Vehicular Technology Conference, May 2008, pp. 2036–2040.
- [61] R. Lawson, E. Riggs, D. Weiker, and J. Doubek, “Total suspended solids reduction and implementation plan for malletts creek: October 2011 - september 2016,” Huron River Watershed Council, Tech. Rep., 2016. [Online]. Available: http://www.hrwc.org/wp-content/uploads/2011/11/MallettsCreek_BiotaTMDL_FINAL.pdf
- [62] (2017) Dark sky api. [Online]. Available: https://darksky.net/dev
- [63] E. Gaborit, D. Muschalla, B. Vallet, P. A. Vanrolleghem, and F. Anctil, “Improving the performance of stormwater detention basins by real-time control using rainfall forecasts,” Urban Water Journal, vol. 10, no. 4, pp. 230–246, aug 2013. [Online]. Available: https://doi.org/10.1080\%2F1573062x.2012.726229