Fault in your stars: An Analysis of Android App Reviews
Abstract.
Mobile app distribution platforms such as Google Play Store allow users to share their feedback about downloaded apps in the form of a review comment and a corresponding star rating. Typically, the star rating ranges from one to five stars, with one star denoting a high sense of dissatisfaction with the app and five stars denoting a high sense of satisfaction.
Unfortunately, due to a variety of reasons, often the star rating provided by a user is inconsistent with the opinion expressed in the review. For example, consider the following review for the Facebook App on Android; “Awesome App”. One would reasonably expect the rating for this review to be five stars, but the actual rating is one star!
Such inconsistent ratings can lead to a deflated (or inflated) overall average rating of an app which can affect user downloads, as typically users look at the average star ratings while making a decision on downloading an app. Also, the app developers receive a biased feedback about the application that does not represent ground reality. This is especially significant for small apps with a few thousand downloads as even a small number of mismatched reviews can bring down the average rating drastically.
In this paper, we conducted a study on this review-rating mismatch problem. We manually examined 8600 reviews from 10 popular Android apps and found that 20% of the ratings in our dataset were inconsistent with the review. Further, we developed three systems; two of which were based on traditional machine learning and one on deep learning to automatically identify reviews whose rating did not match with the opinion expressed in the review. Our deep learning system performed the best and had an accuracy of 92% in identifying the correct star rating to be associated with a given review.
In another evaluation, we asked 23 end users to write reviews for any 5 apps that they had used recently. We got 115 reviews from 66 different mobile apps. Our deep learning system had an accuracy of 87%.
Further, our study suggests that this problem is quite prevalent among apps. Across the ten apps used in our study, the mismatch percentage ranged from 16% to 26%.
1. Introduction
Mobile apps are typically available for download at digital distribution platforms like Google Play Store and Apple Store. Once a user has downloaded and used an app, these distribution platforms also allow the user to enter feedback about the app. The feedback is received in the form of a review comment and an associated star rating. The star rating ranges from one to five stars with one star denoting extreme dissatisfaction with an app and five stars denoting high satisfaction.
The review comments and star ratings are very important as studies and our survey show that users typically download an app based on these factors (Harman et al., 2012).
As ratings are an important factor in determining the download of an app, it is imperative that ratings be accurate i.e., a rating accurately reflects the experience of the user with the app.
However, a study (Dave et al., 2003a) and our investigations suggest that often the star rating given by a user is not consistent with the opinion expressed in the review comment. Consider the following review text for the Instagram app on Android.
“Love instagram it’s the best in the world Love it it’s the best in the world” (sic)
One would reasonably expect that due to the highly positive sentiment expressed in the review, the associated star rating would be five stars, but the actual star rating is one star! Such mismatches bring down the average rating of an app, which can adversely affect future downloads of the app (especially for small and upcoming apps without many downloads).
Review rating mismatches can occur due to a variety of reasons; one reason could be that novice end users may simply be confused about the difference between one and five stars (Dave et al., 2003a). On the other end, a negative opinion accompanied by five stars could happen due to the following reason: A user may initially provide a rating of five stars to an app due to a positive experience. Review systems allow users to simply rate without an explicit review comment. Later on, the user may have a negative experience with the app, (usually after an update). He may then write about his problems with the app, but may forget to update the rating to accurately reflect his current review text. Thus, a review with a largely negative opinion can have a high rating of five stars. This hypothesis is in fact confirmed by our survey responses in Section 2
In this paper, we perform a study of this review rating mismatch problem. We first establish by means of a user survey and manual study that the review rating mismatch problem is prevalent across popular apps on Android. We also establish the need for a system which can automatically detect inconsistencies between reviews and ratings. We then show that the development of such an automated system is non-trivial i.e., simple techniques such as natural language sentiment analysis do not suffice.
We then empirically establish that our system performs well i.e., can accurately identify reviews whose ratings do not match with the opinion expressed in the review text.
We use our automated system to find the prevalence of review-rating mismatches across 10 popular apps on Android and discover that 16% to 26% of the ratings do not match with their reviews. We finally show the generalizability of our system by analyzing mismatches on datasets of completely different domains.
To summarize, the main contributions of this paper are as follows:
-
•
A survey of Android app end users and developers which suggests that:
-
–
Review text and star rating should match
-
–
It is useful to have an automated system to detect mismatches
-
–
Users do not update their rating when they change the review text
-
–
-
•
A manual investigation of 8600 reviews from 10 popular apps on Android. This study shows that about 20% of the reviews have inconsistent ratings and this inconsistency is distributed across apps.
-
•
Machine learning and deep learning techniques to automatically detect mismatched review-ratings.
-
•
A deep learning model which achieves a cross-validation accuracy of 92% in identifying reviews with inconsistent ratings.
-
•
An evaluation with 23 independent human evaluators on a test set of 115 reviews drawn from 66 diverse mobile apps. The accuracy ranged from 84% to 87%
-
•
An estimate of the prevalence of review-rating mismatches across 10 popular Android apps using our deep learning system. The mismatch ranges from 16% to 26%
The remainder of this paper is organized as follows: Section 2 provides the motivation, Section 3 describes our approach to solving this review rating mismatch problem, Section 4 describes the evaluation of our approach. Section 5 discusses the implications of our work and Section 6 describes the related work (which has mainly focused on extracting feature requests and bugs from reviews and not on detecting inconsistent review-ratings). We conclude in Section 7.
2. Motivation
In this section, we provide motivation for our work using two methods:
-
•
A survey of Android app end users and developers
-
•
A manual annotation of reviews from popular Android apps
2.1. Motivating Survey
In our survey, we primarily wanted to know whether users believed that a mobile app star rating and associated review text should match, whether an automated system to detect mismatched reviews is useful and whether users update the star rating when they update the review text.
We hosted the survey questions on Google Forms and posted the link on different platforms such as Android forums, mailing lists, bulletin boards of the Computer Science Department at two premier universities in our country and organization.
No compensation was provided to any of the survey participants. They were not told about our hypothesis about review-rating mismatch. The survey had two branches based on whether the respondent was an Android app developer or only an end user. The end users had seven questions while the developers had four questions.
We received 109 responses to our survey with 82% being end users and 18% developers. The survey responses are shown in Tables 1, 2, 3 and 4.
The fundamental premise of our work that the star rating and the associated review text should correspond is strongly supported by the responses shown in Table 1. Further, Table 2 suggests that both end-users and developers feel that an automated system to detect mismatched review-ratings is useful.
Table 3 shows the other survey questions to end users and their responses. It suggests that users base their download decision on existing reviews and average rating. Thus, if we have a number of ratings that are inconsistent with the review text (say, the correct rating should have been five, but the user rated as one), the average rating of the app may decrease which will in turn will affect app downloads. For widely popular apps with millions of downloads, it is possible that inconsistent ratings do not affect the average rating in a significant manner; however, for small and upcoming apps, the average rating will be affected leading to decreased downloads.
The last row in Table 3 is very instructive. It suggests that users typically do not update the rating after updating their review text. We believe this is one of the major causes of review-rating mismatch.
Table 4 shows the other survey questions to app developers and their responses. It suggests that developers believe that review-rating mismatch is prevalent and importantly, affects app development.
To conclude, both Android app end users and developers agree that the review text and associated star rating must match. Further, they consider an automated system to detect mismatched reviews-ratings is useful.
One issue with surveys is that “what people say” could be different from “what people do” (Easterbrook et al., 2008). To overcome such issues, typically, a triangulation approach is used to confirm a survey’s findings (Easterbrook et al., 2008). Thus, we also manually annotated review text from popular Android apps and rated them to confirm that the review-rating mismatch problem is indeed prevalent. We describe our procedure in the next sub-section.
| Should the star rating and review text match? | Yes (%) | No (%) |
|---|---|---|
| Opinion of End Users | 92 | 8 |
| Opinion of Developers | 79 | 21 |
| Utility of an automated system to detect | End Users | Developers |
|---|---|---|
| star rating and review text mismatch | ||
| Very Useful | 26 | 42 |
| Somewhat Useful | 32 | 31 |
| Marginally Useful | 28 | 6 |
| Not Useful | 14 | 21 |
| Question | Always | Mostly | Some- | Never |
| times | ||||
| Do you download an app based | 15 | 56 | 25 | 4 |
| on existing reviews? | ||||
| Does average rating of an app | 23 | 56 | 16 | 5 |
| influence your decision | ||||
| to download the app? | ||||
| Do you rate apps on App/Play Store? | 2 | 21 | 58 | 19 |
| Do you write review comments along | 5 | 5 | 47 | 41 |
| with rating? | ||||
| If you update your review for an app, | ||||
| do you update your rating? | 11 | 8 | 16 | 65 |
| Question | Yes | Somewhat | No |
|---|---|---|---|
| Is review-rating mismatch prevalent? | 42 | 42 | 16 |
| Does review-rating mismatch affect app development | 37 | 53 | 10 |
2.2. Manual Annotation of Reviews
We chose 8600 random reviews from 10 very popular Android apps. Some characteristics of the apps are shown in Table 5. As can be seen from the table, we have diversity in the sample with apps drawn from different categories such as social media, e-mail, games and so on.
| App | Avg. rating | # downloads | # Reviews |
|---|---|---|---|
| 4 | 1,000,000,000 | 40,632,882 | |
| Gmail | 4.3 | 1,000,000,000 | 2,485,656 |
| Google Plus | 4.2 | 1,000,000,000 | 2,458,398 |
| 4.2 | 500,000,000 | 7,345,190 | |
| Subway Surfers | 4.4 | 500,000,000 | 19,025,802 |
| 4.5 | 500,000,000 | 31,922,875 | |
| Angry Birds | 4.4 | 100,000,000 | 4,748,194 |
| Temple Run | 4.3 | 100,000,000 | 2,970,608 |
| 4.2 | 50,000,000 | 869,962 | |
| Quora | 4.5 | 1,000,000 | 135,060 |
Once we chose the reviews, three annotators set about manually annotating them. The annotation task is to read the review and assign a star rating ranging from one to five stars, without having seen the original star rating. Assigning a star rating is a somewhat subjective process; hence we formulated the following guidelines about star ratings corresponding to review text.
-
•
Five Stars: A five star rating is assigned to review text which are entirely complimentary without any reports of a problem or even a feature request. For example, the Facebook review,
“Awesome!”
-
•
Four stars: A four star rating is assigned to reviews which are almost like five star rated reviews but which express a feature request (through words such as ‘wish’). For example, the Gmail review,
“Great app! Wish we could delete all mails with one click”
-
•
Three stars: A three star rating is given to those reviews which are in between praising and criticizing. For example, the Temple Run review,
“Nice app but annoying with too many ads”
-
•
Two stars: A two star rating is given to those reviews which in general are not complimentary but do not sound extremely dissatisfied i.e., find some redeeming features as well. For example, the Quora review,
“Ok, but very slow and crashes at times”
-
•
One star: A one star rating is given to those reviews which express extreme disappointment with an app and finds nothing redeeming. For example, the Temple Run review,
“Hate this app! Uninstalling now”
Armed with the above guidelines, we set about manually annotating reviews. Note that this is a tedious process and the annotators could annotate only about 3 reviews per minute. This time consumption further illustrates the need for an automated solution.
We measured the agreement among the annotators through the Fleiss’s Kappa, a standard inter-annotator agreeent measure when there are multiple annotators (Banerjee et al., 1999). The Kappa score was 0.7 indicating a substantial level of agreement (Banerjee et al., 1999).
For reviews where annotators were not in agreement, we took the majority rating if at least two annotators agreed, else we took the average as the final rating.
Table 6 shows the distribution of the original rating and the annotator rating. The diagonal elements represent agreement between the original reviewer and the annotators while the non-diagonal elements represent the disagreements.
| 1 | 2 | 3 | 4 | 5 | Total | |
|---|---|---|---|---|---|---|
| 1 | 1337 | 367 | 238 | 84 | 73 | 2099 |
| 2 | 314 | 313 | 257 | 168 | 89 | 1141 |
| 3 | 74 | 57 | 397 | 275 | 229 | 1032 |
| 4 | 15 | 5 | 52 | 434 | 510 | 1016 |
| 5 | 38 | 15 | 71 | 438 | 2750 | 3312 |
| Total | 1778 | 757 | 1015 | 1399 | 3651 | 8600 |
We then proceeded to count the mismatches between the original rating and the rating assigned by the annotators. We classified ratings 5-4 as Good, 3 as Neutral and 1-2 as Bad. We counted the mismatches only when the rating for a review text moved from one category to another. For example, if the original rating was 5 and the annotator rating was 3, we considered it as a mismatch. However, if the annotated rating was 4, we did not consider it as a mismatch.
Such a scheme ensures that fine differences in opinion are tolerated and we do not get an inflated sense of mismatches.
Using the above methodology, we found about 20% mismatches in the 8600 reviews. The highlighted cells in Table 6 show the mismatch count. The mismatch percentage per app are shown in Table 7 indicating that the review-rating mismatch problem is fairly prevalent and also occurs across different apps. A sample of review-rating mismatches are shown in Table 8.
To conclude, the survey of end-users and app developers suggested that the problem of review text and star rating mismatch was fairly prevalent. Our manual annotation of reviews across popular apps also suggest the same.
We also found during the manual annotation of review text, identifying mismatches is a tedious process which supports the survey findings of the need for an automated solution. Thus, the manual annotation has reinforced the survey findings.
| App | % mismatch | App | % mismatch |
|---|---|---|---|
| Angry Birds | 20.04 | 18.43 | |
| 21.36 | Quora | 19.81 | |
| Gmail | 24.33 | Subway Surfers | 16.31 |
| Google Plus | 19.85 | Temple Run | 20.5 |
| 18.94 | 21.79 |
| Review | User | Annotator |
| Rating | Rating | |
| Love instagram it’s the | ||
| best in the world | 1 | 5 |
| Crashing all the time | 5 | 1 |
| AHHH IT WONT LET ME | ||
| CHANGE MY PROFILE | ||
| PICTURE ANYMORE!!!!!!!!!!!!! | 5 | 1 |
| New update really sucks……very bad | 5 | 1 |
| I love instagram but i | ||
| cannot post video | 5 | 3 |
| Nice Enjoying | 2 | 5 |
| Notification? Keeps telling | ||
| me I have a notification | ||
| when I don’t. | 5 | 2 |
| App crashes in Marshmallow. | 4 | 1 |
| This game is very nice but it hangs sometimes.. | 2 | 3 |
| really love this app but severe problem of battery drain | 4 | 3 |
| angry birds nice game | 3 | 5 |
Moving on, a simple or naive approach for automation is to use natural language sentiment analysis. We describe in the next subsection as to why this approach does not suffice and hence motivate the need for sophisticated automated solutions.
2.3. Sentiment Analysis Based Rating Prediction is insufficient
In Natural Language Processing, sentiment analysis research deals with automatically analyzing the sentiment expressed in a sentence. Usually, the sentence analyzed is categorized into one of 5 categories viz., highly negative, negative, neutral, positive, and highly positive.
Intuitively, it appears that one can thus apply sentiment analysis to review text, obtain a category such as highly positive and map it to a numerical star rating, 5. However, this approach does not work in practice as described below.
Sentiment Score Calculation: For each review in our set of 8600 reviews, we first applied a natural language tokenizer from the Stanford NLP toolkit (Manning et al., 2014) to obtain individual sentences. We then applied sentiment analysis to each sentence and computed the overall average sentiment as follows: The five sentiment categories were mapped to an ordinal scale ranging from 1 to 5, with the category highly negative mapped to 1 and the category highly positive mapped to 5. Let be the sentiment score for the sentence of the review text. Then the average sentiment score for the entire review text, S, is given by
| (1) |
For each review, we then found the correlation between the rating and S. We used both the Pearson and Spearman correlation. The Pearson correlation is a measure of the linear correlation between two variables and , giving a value between and inclusive, where is total positive correlation, is no correlation, and is total negative correlation. Similarly, the Spearman correlation assesses how well the relationship between two variables can be described using a monotonic function. If there are no repeated data values, a perfect Spearman correlation of or occur when each of the variables is a perfect monotone function of the other.
Results: We obtained Pearson and Spearman correlation values of around each, for correlation between the ratings and the average sentiment scores. This indicates that there is some correlation (as expected) but not a very high degree, which precludes the use of sentiment analysis alone to solve the problem of review-rating mismatch.
Discussion: Our hypothesis as to why sentiment analysis does not work is as follows: Consider the review text for Facebook on Android, “freezes after last update”. There is nothing intrinsically negative about this sentence if one looks at it from a typical English sentence perspective. It is only in the domain of mobile apps that words like ‘freezes’ have a very negative connotation. Sentiment analysis tools which are trained on standard English text will not be able to work accurately in this domain, thus preventing their use.
Since simple techniques like sentiment analysis do not suffice in automatically detecting review-rating mismatch, we explore more advanced solutions and describe them next.
3. Approach
In this section, we describe our approach towards automatically detecting review-rating mismatches. We use three different approaches, two of which are based on traditional machine learning and one which is based on deep learning. The manually annotated set of 8600 reviews from 10 popular apps, served as the training data for these approaches.
3.1. Machine Learning
Since the problem at hand is a five class classification problem, we first train different standard machine learning classifiers as baselines. We mention the different classifiers and the features used to train them below.
3.1.1. Machine Learning algorithms used
-
•
Naive Bayes Classifier
-
•
Decision Trees (J48)
-
•
Decision Stump (One-level decision tree)
-
•
Decision Table (Majority classifier)
-
•
AdaBoost (AdaBoost.M1, LogitBoost)
-
•
K-nearest neighbors (IBk)
-
•
Support Vector Machines (SMO)
-
•
Holte’s 1R
Due to space constraints, we do not provide details of these classifiers, but interested readers can refer to (Mitchell, 1997) for more details.
3.1.2. Features for machine learning
In supervised learning, along with manually annotated training data, we need to identify a proper set of features and extract feature values for each data point in the training data. As we are dealing with text data, it is natural to use TF-IDF scores as one of the features. But when we analyzed the 8600 reviews in our training data, there were some patterns which we felt would help represent the reviews better. We now describe the various features we extracted from our training set (apart from TF-IDF) to train the above mentioned classifiers and the intuition behind them:
HasAllCapitalWords: When a user is unhappy, he tends to use all capital lettered words which is a norm on the world wide web. For example, consider the review from Facebook, “NOTIFICATIONS STOPPED WORKING”. The presence of such terms indicate frustration and disappointment and act as cue for a lower star rating. This is a binary or feature.
HasNegativeCueWords: Similar to the above, this feature is also helpful in identifying reviews that should have a low star rating. Cue words such as crash, freeze, hang, slow, annoying, etc. express a negative opinion. We manually constructed a dictionary of such negative cue words.
HasQuestions: This feature is also helpful in identifying reviews that should have a low star rating. We observed that reviews which had a question typically indicated unhappiness and hence had lower star ratings. For example,‘Why are there so many updates?’. Another way to identify such questions is to check for the presence of words like why, when, where, what, etc. This is helpful in situations where users may have not used a question mark in the review text.
HasExclamation: In contrast with the above features which deal with cues about identifying low star ratings, this feature deals with identifying high star ratings. We noticed that review text which were correctly rated high often had exclamation(s). For example, the Facebook review,‘awesome app!’.
HasPositiveCueWords: This is a counterpart of the HasNegativeCueWords and is helpful in identifying reviews that should have a high star rating. Cue words that express a positive opinion such as great, excellent, awesome, etc. are used here. We manually constructed a dictionary of such positive cue words.
ReviewLength: We observed that reviews which are correctly rated high tend to be short with only a few words. In contrast, reviews which have been correctly rated low tend to be long (with many words) as the user typically is complaining about certain things. For example, ‘Notifications stopped working. The only one I get is for primary or priority inbox. No longer able to use the sorting feature and get notifications for each group. Doesn’t allow turning on label notifications. Pop up appears, but does not work’.
SentimentScore: Although our empirical experiments suggest that sentiment analysis alone cannot be used to accurately predict star ratings, we believe, that in conjunction with other features, it can help in accurately identifying review-rating mismatch.
ReadabilityScore: Our intuition is that, reviews that are correctly rated high are more readable (Kincaid et al., [n. d.]) than those which are correctly rated low. This is because, when users are unhappy or confronted with a problem, they may be agitated and hence may not write clearly.
3.2. Deep Learning
Usually feature engineering requires domain expertise which is often hard or expensive to come by. Also, when features are handcrafted, some important correlations may be missed which result in a poor representation of data which in turn decreases the accuracy of classification. This can be overcome by unsupervised feature learning/deep learning where the best feature representations are automatically learned from raw data.
RNNs with LSTM units (Hochreiter and Schmidhuber, 1997) have become the defacto standard for unsupervised extraction of features from text. However, recently CNNs have been used to get state of the art results on problems involving small pieces of text (Ruder et al., 2016). The app reviews which we are currently dealing with can often be short. Therefore we use a modified version of CNNs called Dependency based CNN (DCNN) for our classification problem. We briefly introduce CNNs below which is then followed by the internal working of the DCNN.
3.2.1. Convolutional Neural Networks
CNN (LeCun et al., 1995) is a type of feed-forward artificial neural network whose simplest form consists of 2 types of layers; the convolutional layer and the pooling layer. Neurons in each layer pass on their outputs to the next layer after they undergo a non-linear transformation (typically rectified linear or ). The neurons in a convolutional layer are connected to a small part of the adjacent layers which help in capturing spatially-local correlations. The pooling layer is used for non-linear down sampling of the inputs (deeplearning.net, 2014). It also provides translation invariance; for example, it can identify a car, no matter in which way it is oriented.
3.2.2. Dependency based Convolutional Neural Networks
Since CNNs were designed to operate mainly on images, they inherently apply convolution on continuous areas of inputs. If it is applied as is to language tasks, the convolution operates on the words in a sequential order. Let be a -dimensional representation of a word (can either be a one-hot representation or word2vec (Mikolov et al., 2013)). If is the concatenation operator,
| (2) |
where is the concatenated word vector from the to the word on which the convolution is applied. This is similar to n-gram models which feed local information to the convolution operations. In some cases, parts of a phrase maybe separated by several other words. Therefore we need a way to capture relationships among words even when they are not contiguous.
DCNN is similar to the model proposed in (Kim, 2014), but it also considers the ancestor and sibling words in a sentence’s dependency tree. Here, we consider two types of convolutions: Convolutions of ancestor paths and Convolutions on Siblings.
Convolution of ancestor paths and siblings: In this case, we concatenate word vectors as follows:
| (3) |
where is a function which returns the ancestor of the word. Mathematically,
| (4) |
For a given , we apply a convolutional filter with a bias term .
| (5) |
where is a non-linearity such as or (Xu et al., 2015). When this filter is applied on all the words in a sentence, we get a feature map , where is the length of the sentence.
| (6) |
We repeat the same process for performing convolutions of siblings as well. The only difference is that, here returns the sibling(s) rather than the ancestor.
3.2.3. Our Model
: When using CNNs with text data, we use max-over-time pooling (Kim, 2014) to get the maximum activation over the feature map . In DCNNs, we want the maximum activation from the feature map across the whole dependency tree (whole sentence). This is also called ‘max-over-tree’ pooling (Ma et al., 2015). Thus, each filter outputs only one feature vector after pooling. The final representation of a sentence will be many such features, one from each of the filters in the network. These feature vectors are finally passed on to a fully connected layer for classification.
The model we built is similar to what is done in (Ma et al., 2015). We concatenated the feature maps obtained from ancestor path and sibling convolutions with the sequential n-gram representation. The concatenation with the sequential n-gram representation was done because the app reviews contains grammatical flaws which will result in parsing errors during dependency tree construction, but these parsing errors do not affect the sequential representation. The concatenated representation is shown in equation 7. Here represent the ancestor path feature map, represent the sibling feature map and represent the sequential feature map. We used 100 filters for each representation.
| (7) |
In our model, we used a dropout probability of 0.5 and a learning rate of 0.95 which was decayed using adadelta update rule (Zeiler, 2012). We used dimensional word embedding which were learned from scratch during training.
4. Evaluation
In this section, we describe our evaluation. We designed our evaluation to answer the following research questions (RQ):
RQ1: Accuracy on manually annotated data: What is the accuracy of our machine learning and deep learning techniques on manually annotated data?
RQ2: Accuracy on data from the wild: With what accuracy are we able to automatically predict the star rating of any given review text?
RQ3: Mismatch Prevalence: How prevalent are the review-rating mismatches across popular mobile apps for Android?
4.1. Metric
As explained in Section 2.2 we categorized the ratings 5-4 as Good, rating 3 as Neutral and ratings 1-2 as Bad. We considered our prediction to be accurate iff the predicted rating and the correct rating fell in the same category. Therefore our accuracy is given by equation 8 where is the predicted rating category, is the correct rating category and is the total number of reviews in the evaluation data.
Note that have not used ”precision/recall” etc. as they make sense only when there are multiple correct answers and a subset of them is returned by an approach. Here we have only a binary answer as result (i.e., match/mismatch) and thus we strongly believe ”accuracy” is the most appropriate measure.
| (8) |
4.2. RQ1: Accuracy on manually annotated data
In this section, we answer the question about the accuracy of our machine learning and deep learning techniques on manually annotated data of 8600 reviews.
4.2.1. Construction of the models
Model with handcrafted features: For each of the 8600 reviews in our training set, we extract the features using the rules described in Section 3.1.2. For the ReviewLength and ReadabilityScore we transformed the score values into a scale of 0 to 1 as follows.
For ReviewLength we automatically got the count of words in all the reviews. We then sort and find the percentile to which a review belongs. If a review is in the percentile, the feature’s value will be and so on.
We obtained the Flesch-Kincaid readability score (Kincaid et al., [n. d.]) for each review text and transformed the scores into a scale of 0 to 1 as above.
We then built 9 different traditional machine learning models mentioned previously and trained them using the extracted feature values with Weka 3.8 (Smith and Frank, 2016).
Model with Word Vectors: We constructed a vocabulary of all the words present in our review corpus by removing stop words and converting the rest into lowercase. We then use 100 dimensional glove vectors (Pennington et al., 2014) pre-trained on Wikipedia-14 and Gigaword 5 datasets to represent each word in our vocabulary. Finally, these word vectors were used to train the machine learning classifiers mentioned previously.
Model using DCNN: For DCNNs, no pre-processing of data is required. Therefore, we only removed all special characters in the review text and used it for training.
4.2.2. Results
To evaluate all these models, we used ten fold cross validation. Here the 8600 reviews were divided into ten equal sets. In a single iteration, nine sets were used for training and one set was used to test. We had ten such iterations, with each of the ten sets serving as the test data once.
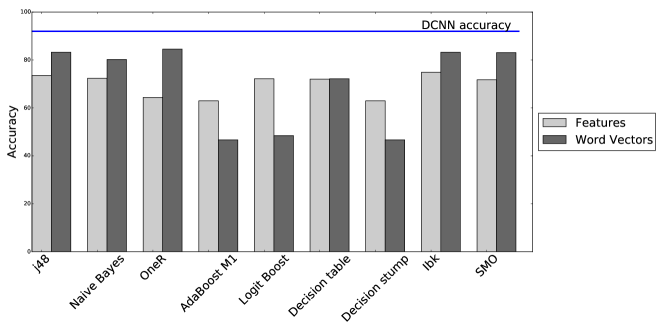
The cross-validation accuracy of the models with different traditional machine learning techniques is shown in Figure 1. The lightly shaded bars i.e., the bars that appear on the left of each pair of bars represent the cross-validation accuracy of each machine learning classifier using the features described in Section 3.1.2. The best accuracy of 74.9% was obtained with the IBk classifier i.e., the Instance Based classifier, followed by the J48 (Decision Tree) classifier which had an accuracy of 73.6%.
The darkly shaded bars i.e., the bars that appear on the right of each pair of bars represent the cross-validation accuracy of each machine learning classifier using word vectors. The best accuracy of 84.52% was obtained with the One R classifier, followed by the J48 (Decision Tree) classifier which had an accuracy of 83.22%.
The DCNN outperformed all the models shown in Figure 1. It had an accuracy of 92%.
4.2.3. Discussion
The deep learning approach appears to perform the best among the three techniques. The time taken by all three approaches is of the same order with the entire model building (i.e., learning) and ten fold cross validation finishing in a few minutes. The feature engineering based approach did not perform as well due to limitations in identifying all possible features which can accurately help in identifying the rating. DCNN outperformed the word vector based model as it captures additional non-sequential context of a word, which may not have been captured by the word vector model. This additional context appears to help the model to classify the review in a more accurate fashion.
Thus, for answering the next two research questions, we consider only DCNN as the automated solution for predicting review mismatches, as it has performed the best on the manually annotated data set.
4.3. RQ2: Accuracy on data from the wild
Evaluation with users: We recruited 23 users within our organization for this evaluation. All of them have advanced degrees in computer science. We asked them to write reviews for 5 mobile apps of their choice and provide a suitable rating corresponding to their reviews. At a high level, we instructed the users not to choose all positive or all negative experience apps to ensure diversity of review-ratings. Thus we have a total of mobile app reviews with associated ratings in our test set. The users were not compensated in anyway for their work. They were also not told about the intention behind this exercise.
In total, the 23 different users provided reviews for 66 different apps out of which four apps had figured in our training set viz., Facebook, Twitter, Gmail and LinkedIn. The distribution of 115 reviews among the star ratings were as follows: 9 reviews were rated as one star, 15 as two stars, 34 as three stars, 35 as four stars and 22 as five stars.
For each review, we then used our DCNN model trained on our manually annotated dataset to predict the rating using only the provided review text.
Results: We computed the accuracy according to equation 8. We got an accuracy of 87% if we consider only reviews from those apps which were present in our training set. Whereas, if we consider the entire review set from all the 66 apps, the accuracy was 84%. We believe that both these accuracy values are fairly good.
Discussion: The accuracy values and the vast number of apps suggest that the DCNN based approach is fairly good in assigning an appropriate star rating to a review text and can also be used adequately on apps that have not featured in the training set. The review-rating prediction accuracy for an app can be further improved if the DCNN is trained on review text from the same app. This is due to the fact that sometimes, we see app specific terms in the review text which were not seen by our model previously.
We also asked the users if they would use a system that would automatically help suggest an appropriate rating for their reviews. 18 of the 23 users said that they would use such a system, indicating a need for an automated solution. Note that, this reinforces our survey results presented in Section 2.
Generalizability to other domains: We now discuss about the generalizability of our approach i.e., what would be the accuracy of our approach when applied to non Android app reviews?
We gathered 1000 random product reviews apiece from the publicly available Amazon MP3 and Trip Advisor datasets (Wang et al., 2011) and applied our DCNN model to obtain star ratings for these reviews. We then manually verified the results and found that our approach had an accuracy of 88% on the Amazon MP3 reviews and 86% on the Trip Advisor reviews. This shows that, our model works well on different domains even without any fine tuning (Ohzeki, 2015) and being trained on a relatively small dataset of an entirely different domain (8600 Android app reviews). Thus, our model generalizes fairly well and is not overfitted to the training data.
| App | Number of Reviews | App | Number of Reviews |
|---|---|---|---|
| Angry Birds | 3920 | 10839 | |
| 14950 | Quora | 2859 | |
| Gmail | 10744 | Subway Surfers | 8250 |
| Google Plus | 11082 | Temple Run | 3942 |
| 4965 | 10683 |
4.4. RQ3: Mismatch Prevalence
We now answer the question as to how prevalent are the review-rating mismatches across popular mobile apps for Android on Google Play Store.
Data: In order to obtain a count of the review-rating mismatches for an app, we first need to retrieve all the reviews of that app. Unfortunately, Google Play Store does not allow one to download all reviews for an app (unless one is a developer of the app). Thus, the next option is to crawl Google Play Store and retrieve the reviews. Here again, it puts restrictions on crawling and blocks requests if too many of them are sent in a short period of time. Therefore, we decided to retrieve only the reviews from the last few months for each app. We obtained a total of 82234 reviews of 10 different apps. The apps and the number of retrieved reviews per app are shown in Table 9. We then ran our DCNN model on these reviews.
| Review | App | Actual | Predicted |
| Rating | Rating | ||
| I love it. I am addicted to it. | Subway Surfers | 1 | 5 |
| App keeps crashing, reinstalled | |||
| same thing happens FIX IT ASAP | 5 | 1 | |
| Love it! New favourite social network! | GooglePlus | 1 | 5 |
| I’m 74 and enjoy it. I can’t get | |||
| friends anymore. Good game | AngryBirds | 1 | 4 |
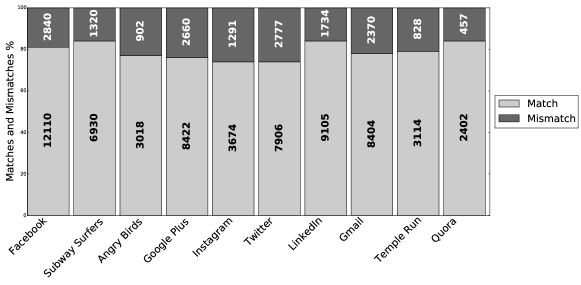
Results: Accuracy was computed as before using equation 8. The percentage of reviews for which the original and the predicted star rating categories matched and did not match are shown in the stacked bar chart in Figure 2. The results suggest that a substantial number of reviews (17179 or 20%) have inconsistent star ratings. This phenomenon is not restricted to a few apps but appears across all the apps, ranging from 16% (for Quora, LinkedIn and Subway Surfers) to 26% (Instagram and Twitter). A sample of the mismatched reviews are shown in Table 10.
Change of average rating due to mismatches:
For each app in Table 9, we computed the average rating, using the original star rating for the reviews shown in Table 9. We then computed the average rating using the predicted ratings of our DCNN model for each app. The original average rating and the predicted rating after accounting for mismatches is shown in Table 11.
The average rating decreases for some apps but increases for others when we re-calculate after correcting the mismatches. The average rating variation ranges from 0.3 to 0.7.
| App | Org. Avg. | New Avg. | App | Org. Avg. | New Avg. |
|---|---|---|---|---|---|
| Rating | Rating | Rating | Rating | ||
| Angry Birds | 3.5 | 4.1 | 3.5 | 3.2 | |
| 2.1 | 1.7 | Quora | 3.8 | 4.2 | |
| Gmail | 3.2 | 2.6 | Sub. Surf. | 4.5 | 4.2 |
| G Plus | 3.7 | 3.1 | Temple Run | 4.1 | 3.7 |
| 3.1 | 3.8 | 3.4 | 2.8 |
General Discussion: Note that, it is possible that such mismatched reviews are not really mismatches but rather mis-predictions by our system. To validate this, we manually analyzed the mismatches by examining 760 random reviews, with 76 apiece from each of the ten apps. Of the 760 reviews, there were 192 which were classified as mismatch by our system (i.e., 25.26%). Among these, we had an accuracy of 90.62% i.e., 174 of the 192 were indeed mismatches. Thus, overall, 174 of the 760 reviews were genuine mismatches (i.e., 23%)
Further, our qualitative observations are as follows: Errors in mismatch prediction happen when reviews contain non-English representations of English words like “waaaaahoooo” and “woooorked!!!” etc. In apps like Quora some reviews talked about the content (questions and answers) served by the app rather than about the app as such. This lead to the detection of a few mismatches incorrectly.
4.5. Replication Package
Our tool is available at http://mismatch.mybluemix.net. The user survey responses, data sets for manual annotation and the evaluations are also provided there. Further, model parameters for the DCNN are also mentioned in detail.
4.6. Threats to Validity
Our study is focused on applications from Android with reviews from Google Play Store, and hence it might not generalize to other distribution platforms like Apple Store. Due to constraints imposed by Google Play Store on downloading all reviews of an app, we had to perforce evaluate on a smaller subset of the latest 82234 reviews from 10 popular Android apps. Thus, our results may not generalize to all reviews, especially when the review text contain app specific terminologies not seen by the model beforehand. To mitigate this we downloaded as many reviews as possible and in future, plan to evaluate our approach on reviews from the Apple Store.
User surveys are generally prone to various threats(Easterbrook et al., 2008) such as being unrepresentative, exhibiting bias and idealistic responses (what people say in a survey can be different from what they actually do in practice). To mitigate these threats, we tried to ensure that we obtained responses from a representative sample by posting notifications about the survey on many diverse platforms. We also tried to avoid bias in the responses by not revealing the intentions behind our exercise and avoiding any kind of compensation. Finally, we used the manual annotations to reinforce some of the survey’s findings.
In constructing our training set, the rating given by annotators might not be accurate since they are not aware of the circumstances under which the review was written and the original rating provided. To mitigate this we had fairly large sample of 8600 reviews from diverse apps and three independent annotators.
In the user evaluation, there is a possibility for certain users to not rate their reviews in accordance to what is expected. To mitigate this, we conducted the evaluation with a fairly large pool of 23 participants with each reviewing 5 different apps of their choice.
5. Implications of our work
We believe this is a foundational work and can be used in several prior research works such as (Chen et al., 2014; Linares-Vásquez et al., 2013). Prior research that use reviews and rating, make an assumption that the rating and reviews match and thus can be used as is (i.e, the average rating truly represents the experience of the end-users; a low star rating implies a negative opinion and so on).
Our work strongly suggests that we need to be more careful in dealing with reviews and rating. (For ex: a heuristic for automatically finding negative reviews could assume a low star rating of 1 or 2. However, this heuristic may not be very accurate and would miss a number of negative reviews which have been erroneously rated 4 or 5 stars).
Further as shown in Table 11, review-rating mismatch will affect the overall average rating of an app and this can impact research that uses average rating (Linares-Vásquez et al., 2013) to determine success of an app.
There is a strong correlation between average rating and downloads (Harman et al., 2012). Mismatched review-ratings can deflate average rating leading to fewer downloads and consequently a loss of revenue. Small and upcoming apps with less number of downloads and reviews are especially affected by these inconsistent review-ratings.
Our future work will focus on determining the improvement in existing research that can be obtained by identifying review rating mismatches.
6. Related Work
Broadly, most of the related work has focused on analyzing the content of the review text using techniques such as topic modeling to identify bugs and feature requests (Vu et al., 2015; Iacob and Harrison, 2013; Galvis Carreño and Winbladh, 2013; Chen et al., 2014).
To help developers prioritize the devices to test their app, (Khalid et al., 2014) examined reviews from different devices for the same app and found that some devices gave significantly lower ratings.
Dave et al. (Dave et al., 2003b) use information retrieval techniques to distinguish between positive and negative product reviews. They state that the performance of their method is affected due to rating inconsistencies, which they define as “similar qualitative descriptions yield very different quantitative reviews from reviewers. In the most extreme case, reviewers do not understand the rating system and give a 1 instead of a 5”. Our work in contrast addresses the rating inconsistency problem directly.
Fu et al. (Fu et al., 2013) try to understand why people might dislike an app. As part of this, they allude to the presence of reviews with inconsistent ratings. They propose a simple approach of using regression on words with a certain frequency (viz., 10). They unfortunately do not provide an accuracy assessment of their approach. The first of our three approaches can be seen as a generalization of their approach as it uses TF-IDF and further allows the use of different classifiers apart from regression. Also, our DCNN approach performs better than the mentioned approach.
7. Conclusion
In this paper, we performed a study of the Android app review-rating mismatch problem. We conducted a survey of Android app end users and developers. The survey responses suggest that: (1) review text and corresponding star ratings should match; (2) it is useful to have an automated system to detect mismatches; (3) end users do not update the star ratings when they update their review text; (4) developers believe mismatches are prevalent and affects overall app development.
We manually analyzed 8600 reviews from 10 mobile apps available for Android. These apps include Facebook, Gmail and other popular apps. We found that about 20% of the reviews had ratings which did not match with the review text. Further, our study suggested that manually analyzing reviews to detect inconsistent ratings can be tedious and time consuming, thus, warranting automated solutions.
We developed multiple automated systems to detect reviews with inconsistent ratings. These systems are based on machine and deep learning methods. We then empirically established that our Dependency based Convolutional Neural Network model performs well in practice i.e., can accurately identify reviews whose rating does not match with the opinion expressed in the review text. Our system achieved an accuracy of 92% on the manually annotated data.
Further, we performed an end user evaluation. We recruited 23 Android app end-users and asked them to write reviews for any five mobile apps used by them, along with providing a rating ranging from one to five stars. We predicted the star rating for these user reviews using DCNN and compared with the user provided rating. Our system achieved an upward accuracy of 87%.
We finally used our system to detect review-rating mismatches across 10 popular apps on Android (available on Google Play Store) and found that mismatched review-ratings are fairly prevalent across apps ranging from 16% to 26%.
References
- (1)
- Banerjee et al. (1999) Mousumi Banerjee, Michelle Capozzoli, Laura McSweeney, and Debajyoti Sinha. 1999. Beyond kappa: A review of interrater agreement measures. Canadian Journal of Statistics 27, 1 (1999), 3–23. https://doi.org/10.2307/3315487
- Chen et al. (2014) Ning Chen, Jialiu Lin, Steven C. H. Hoi, Xiaokui Xiao, and Boshen Zhang. 2014. AR-miner: Mining Informative Reviews for Developers from Mobile App Marketplace. In Proceedings of the 36th International Conference on Software Engineering (ICSE 2014). ACM, New York, NY, USA, 767–778. https://doi.org/10.1145/2568225.2568263
- Dave et al. (2003a) Kushal Dave, Steve Lawrence, and David M. Pennock. 2003a. Mining the Peanut Gallery: Opinion Extraction and Semantic Classification of Product Reviews. In Proceedings of the 12th International Conference on World Wide Web (WWW ’03). ACM, New York, NY, USA, 519–528. https://doi.org/10.1145/775152.775226
- Dave et al. (2003b) Kushal Dave, Steve Lawrence, and David M. Pennock. 2003b. Mining the Peanut Gallery: Opinion Extraction and Semantic Classification of Product Reviews. In Proceedings of the 12th International Conference on World Wide Web (WWW ’03). ACM, New York, NY, USA, 519–528. https://doi.org/10.1145/775152.775226
- deeplearning.net (2014) deeplearning.net. 2014. Convolutional Neural Networks (LeNet). online. (2014).
- Easterbrook et al. (2008) Steve Easterbrook, Janice Singer, Margaret-Anne Storey, and Daniela Damian. 2008. Selecting Empirical Methods for Software Engineering Research. (2008), 285–311. https://doi.org/10.1007/978-1-84800-044-5_11
- Fu et al. (2013) Bin Fu, Jialiu Lin, Lei Li, Christos Faloutsos, Jason Hong, and Norman Sadeh. 2013. Why People Hate Your App: Making Sense of User Feedback in a Mobile App Store. In Proceedings of the 19th ACM SIGKDD International Conference on Knowledge Discovery and Data Mining (KDD ’13). ACM, New York, NY, USA, 1276–1284. https://doi.org/10.1145/2487575.2488202
- Galvis Carreño and Winbladh (2013) Laura V. Galvis Carreño and Kristina Winbladh. 2013. Analysis of User Comments: An Approach for Software Requirements Evolution. In Proceedings of the 2013 International Conference on Software Engineering (ICSE ’13). IEEE Press, Piscataway, NJ, USA, 582–591. http://dl.acm.org/citation.cfm?id=2486788.2486865
- Harman et al. (2012) M. Harman, Y. Jia, and Y. Zhang. 2012. App store mining and analysis: MSR for app stores. In Mining Software Repositories (MSR), 2012 9th IEEE Working Conference on. 108–111. https://doi.org/10.1109/MSR.2012.6224306
- Hochreiter and Schmidhuber (1997) Sepp Hochreiter and Jürgen Schmidhuber. 1997. Long short-term memory. Neural computation 9, 8 (1997), 1735–1780.
- Iacob and Harrison (2013) Claudia Iacob and Rachel Harrison. 2013. Retrieving and Analyzing Mobile Apps Feature Requests from Online Reviews. In Proceedings of the 10th Working Conference on Mining Software Repositories (MSR ’13). IEEE Press, Piscataway, NJ, USA, 41–44. http://dl.acm.org/citation.cfm?id=2487085.2487094
- Khalid et al. (2014) Hammad Khalid, Meiyappan Nagappan, Emad Shihab, and Ahmed E. Hassan. 2014. Prioritizing the Devices to Test Your App on: A Case Study of Android Game Apps. In Proceedings of the 22Nd ACM SIGSOFT International Symposium on Foundations of Software Engineering (FSE 2014). ACM, New York, NY, USA, 610–620. https://doi.org/10.1145/2635868.2635909
- Kim (2014) Yoon Kim. 2014. Convolutional Neural Networks for Sentence Classification. CoRR abs/1408.5882 (2014). http://arxiv.org/abs/1408.5882
- Kincaid et al. ([n. d.]) J. Peter Kincaid, Richard Braby, and John E. Mears. [n. d.]. Electronic authoring and delivery of technical information. Journal of instructional development 11, 2 ([n. d.]), 8–13. https://doi.org/10.1007/BF02904998
- LeCun et al. (1995) Y. LeCun, L. Jackel, L. Bottou, A. Brunot, C. Cortes, J. Denker, H. Drucker, I. Guyon, U. Müller, E. Säckinger, P. Simard, and V. Vapnik. 1995. Comparison of Learning Algorithms for Handwritten Digit Recognition. In INTERNATIONAL CONFERENCE ON ARTIFICIAL NEURAL NETWORKS. 53–60.
- Linares-Vásquez et al. (2013) Mario Linares-Vásquez, Gabriele Bavota, Carlos Bernal-Cárdenas, Massimiliano Di Penta, Rocco Oliveto, and Denys Poshyvanyk. 2013. API Change and Fault Proneness: A Threat to the Success of Android Apps. In Proceedings of the 2013 9th Joint Meeting on Foundations of Software Engineering (ESEC/FSE 2013). ACM, New York, NY, USA, 477–487. https://doi.org/10.1145/2491411.2491428
- Ma et al. (2015) Mingbo Ma, Liang Huang, Bowen Zhou, and Bing Xiang. 2015. Tree-based Convolution for Sentence Modeling. CoRR abs/1507.01839 (2015). http://arxiv.org/abs/1507.01839
- Manning et al. (2014) Christopher D. Manning, Mihai Surdeanu, John Bauer, Jenny Finkel, Steven J. Bethard, and David McClosky. 2014. The Stanford CoreNLP Natural Language Processing Toolkit. In Association for Computational Linguistics (ACL) System Demonstrations. 55–60. http://www.aclweb.org/anthology/P/P14/P14-5010
- Mikolov et al. (2013) Tomas Mikolov, Kai Chen, Greg Corrado, and Jeffrey Dean. 2013. Efficient Estimation of Word Representations in Vector Space. CoRR abs/1301.3781 (2013). http://arxiv.org/abs/1301.3781
- Mitchell (1997) Thomas M. Mitchell. 1997. Machine Learning (1 ed.). McGraw-Hill, Inc., New York, NY, USA.
- Ohzeki (2015) M. Ohzeki. 2015. Statistical-Mechanical Analysis of Pre-training and Fine Tuning in Deep Learning. Journal of the Physical Society of Japan 84, 3, Article 034003 (March 2015), 034003 pages. https://doi.org/10.7566/JPSJ.84.034003 arXiv:stat.ML/1501.04413
- Pennington et al. (2014) Jeffrey Pennington, Richard Socher, and Christopher D. Manning. 2014. GloVe: Global Vectors for Word Representation. In Empirical Methods in Natural Language Processing (EMNLP). 1532–1543. http://www.aclweb.org/anthology/D14-1162
- Ruder et al. (2016) S. Ruder, P. Ghaffari, and J. G. Breslin. 2016. Character-level and Multi-channel Convolutional Neural Networks for Large-scale Authorship Attribution. ArXiv e-prints (Sept. 2016). arXiv:cs.CL/1609.06686
- Smith and Frank (2016) Tony C. Smith and Eibe Frank. 2016. Statistical Genomics: Methods and Protocols. Springer, New York, NY, Chapter Introducing Machine Learning Concepts with WEKA, 353–378. http://dx.doi.org/10.1007/978-1-4939-3578-9_17
- Vu et al. (2015) Phong Minh Vu, Tam The Nguyen, Hung Viet Pham, and Tung Thanh Nguyen. 2015. Mining User Opinions in Mobile App Reviews: A Keyword-Based Approach (T). In Proceedings of the 2015 30th IEEE/ACM International Conference on Automated Software Engineering (ASE) (ASE ’15). IEEE Computer Society, Washington, DC, USA, 749–759. https://doi.org/10.1109/ASE.2015.85
- Wang et al. (2011) Hongning Wang, Yue Lu, and ChengXiang Zhai. 2011. Latent Aspect Rating Analysis Without Aspect Keyword Supervision. In Proceedings of the 17th ACM SIGKDD International Conference on Knowledge Discovery and Data Mining (KDD ’11). ACM, New York, NY, USA, 618–626. https://doi.org/10.1145/2020408.2020505
- Xu et al. (2015) Bing Xu, Naiyan Wang, Tianqi Chen, and Mu Li. 2015. Empirical Evaluation of Rectified Activations in Convolutional Network. CoRR abs/1505.00853 (2015). http://arxiv.org/abs/1505.00853
- Zeiler (2012) Matthew D. Zeiler. 2012. ADADELTA: An Adaptive Learning Rate Method. CoRR abs/1212.5701 (2012). http://arxiv.org/abs/1212.5701