VERITAS observations of the Cygnus Region
Abstract:
The Cygnus region of the galaxy is one of the richest regions of gas and star formation and is the brightest region of diffuse GeV emission in the northern sky. VERITAS has conducted deep observations (approximately 300 hours) in the direction of Cygnus region, reaching an average sensitivity of a few percent of the Crab nebula flux. We present the results of these observations and an analysis of over seven years of Fermi-LAT data above 1 GeV. In addition to a search for new sources in the region, we present updated spectra and morphologies of the known TeV -ray sources and a study of their relationship with the GeV emission from the region. These results are discussed in their multiwavelength context including the recently published HAWC observatory -ray catalog. A comparison is also made to the H.E.S.S. galactic plane survey.
1 Introduction
The Cygnus region is the brightest region of diffuse high-energy (HE, 0.1 GeV E 100 GeV) -rays in the northern sky. Seen as a small-scale version of a whole galaxy, the Cygnus region harbors a wealth of objects and is the largest known star-forming region outside the Galactic center. It has already been observed by a wealth of instruments at different wavelengths which have highlighted the variety of objects and processes within the region, and firmly established it as a key region for understanding our galaxy.
We present a survey over a 15° by 5° portion of the Cygnus region centered on Galactic longitude () 74.5° and Galactic latitude () 1.5° conducted by VERITAS between 2007 April and 2008 December with a total observing time of 135 h (120 h live time). We also include targeted and follow-up observations of 174 h (151 h live time) made by VERITAS between 2008 November and 2012 June, for a total observing time of about 309 h (271 h live time).
The Cygnus region has been observed by several very high energy (VHE, E 100 GeV) -ray instruments who have identified seven sources, four of them have previously been detected by VERITAS. TeV J2032+4130 is an unidentified VHE emitter which lies within the extended Cygnus cocoon [1]. VER J2019+407 is also located within the Cygnus cocoon and is associated with the Gamma-Cygni SNR (G78.2+2.1) [2]. The large, bright Milagro source MGRO J2019+37 which has been resolved into two sources after observations by VERITAS: VER J2016+371 which is associated with the PWN CTB 87, and VER J2019+368 which is a spatially extended source whose origin has yet to be identified [3]. HAWC has recently published the 2HWC catalog [4], in which they identified three new sources in the survey region: 2HWC J1953+294, which lies at the edge of the survey region; 2HWC J2006+341; and 2HWC J2024+417*.
2 Fermi-LAT Observations and Analysis
The Large Area Telescope (LAT) [7], is the primary instrument on the Fermi Gamma-ray Space Telescope. It is a pair conversion -ray detector that is sensitive to -rays with energies from 20 MeV to greater than 500 GeV. We have undertaken an analysis using over seven years (2008 August - 2016 January) of Fermi-LAT Pass 8 data using Fermi-LAT science tools v10r0p5 and the fermipy tools v0.13.5. In order to reduce the contribution of the galactic diffuse emission and for improved angular resolution, “SOURCE” class photons were selected in the energy range from 1 to 500 GeV and a region of 30° radius centered at (, ) = (74.5°, 1.5°). The region of interest is taken to be 65.5° 83.5°, -2.5° 5.5° to match the VERITAS data. A base model derived from the 3FGL was used with the fermipy tool find_sources used to identify new sources. All sources have a minimum test statistic (TS) of 25 and spectral models were updated if appropriate.
By far the brightest sources in the region are pulsars, but they all demonstrate an exponential cutoff spectrum with an extrapolated flux greater than 1 TeV of approximately zero. To search for potential PWN emission, a “gated” analysis was conducted, where a time cut was applied to the pulsar phase to remove the ON-pulse and bridge emission. In addition, we performed an ON-pulse analysis on the data range available to fit an ON-pulse source. The spectral parameters of the pulsar in the model used to analyze the full dataset were then fixed to the ON-pulse values and the dataset refit. Nebula emission should then be apparent as a positive residual. A check was also conducted on the light curves of the pulsars to ensure no changes in the flux occurred during the period of these observations. Provided the new source has a TS of at least 25 after being refit with the pulsar parameters free, it was kept in the model. This produced the base model from which all analyses were conducted.
3 VERITAS Observations and Analysis
The Very Energetic Radiation Imaging Telescope Array System (VERITAS) is an array of four IACTs, located at the Fred Lawrence Whipple Observatory in southern Arizona (31°40’ N, 110°57’ W, 1.3 km a.s.l.) [5]. Full array operations began in 2007 and in the summer of 2009 the first telescope was relocated to increase the sensitivity of the array [11]. Following a trigger upgrade in fall 2011, in summer 2012, the cameras in each telescope were replaced with new, high quantum efficiency PMTs which has resulted in a decrease of the array energy threshold to about 85 GeV [12]. All the data presented in this work were taken prior to the 2012 upgrade.
The results presented here were generated using a standard VERITAS event reconstruction package [6] and cross checked with another package, using two different integration radii, one targeted at point sources ( = 0.1°, Point) and one at extended sources, ( = 0.23°, Extended). A high signal threshold (130 photoelectrons) and a minimum of three telescope images was used to reduce the PSF and better handle background artifacts due to bright stars. Source morphologies were determined by fitting a sky map of the uncorrelated excess events with a delta function and two-dimensional Gaussian distributions convolved with the VERITAS PSF.
4 Results
4.1 Whole Region
Examination of the significance sky map (fig. 1) produced with the Extended integration radius shows the four known VERITAS sources. No other new VHE sources were detected. In addition to the detected VHE sources, upper limits were calculated for 71 locations, including all of the detected Fermi-LAT sources and other potential VHE emitters in the region. The mean significance of the upper limit positions was 0.33 and 0.18 for the Point and Extended integration radii, respectively.
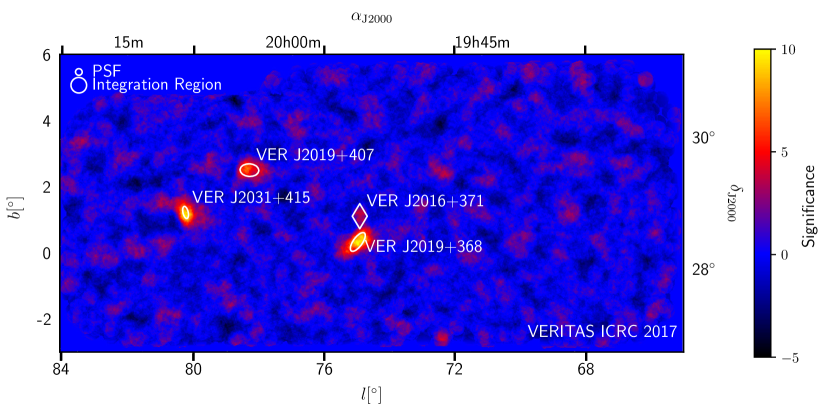
Twenty-seven 3FGL catalog sources were identified within the region of interest, overlapping with eight 1FHL sources, and four 2FHL sources. In addition, 25 new point sources were identified. Two 3FHL catalog sources were not detected in this analysis, 3FHL J1950.5+3457 and 3FHL J2026.7+3449. Both of these sources are close to the 3FHL detection threshold (5.5 and 4.2 respectively) and hard spectrum (spectral indices of 1.8 and 1.9). Of these new Fermi-LAT sources, notable detections include Cygnus X1/X3, 2HWC J2006+341, PSR J2006+3412 and G73.9+0.9.
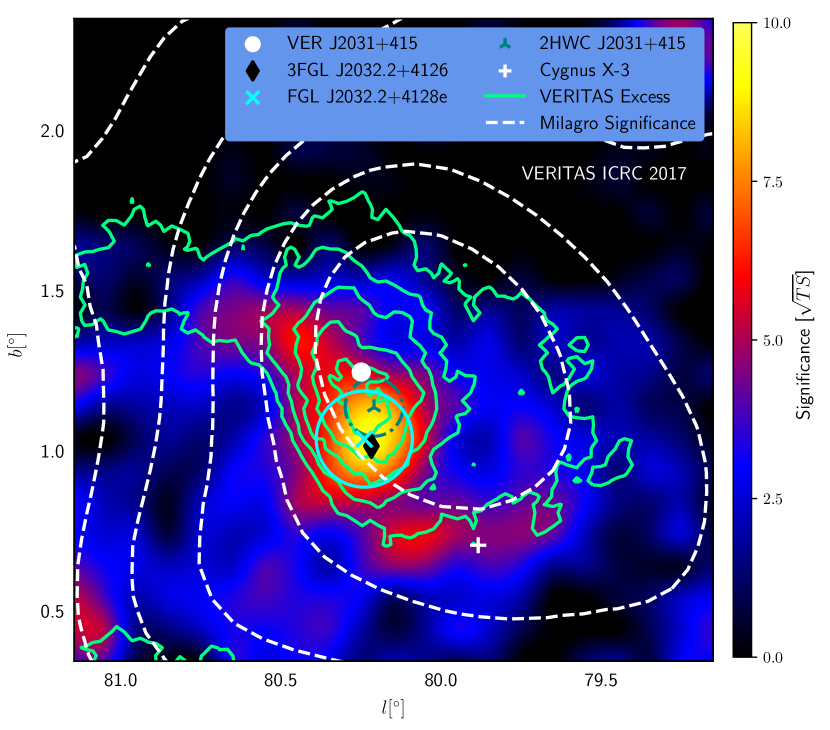
4.2 TeV J2032+4130 / VER J2031+415
VER J2031+415 was observed by VERITAS at 10.1 using the Extended integration radius. It was found to be asymmetric with a centroid at (, ) = , ((, ) = , )), a semi-major axis of , a semi-minor axis of and oriented to the North-East (of galactic north) at an angle of .
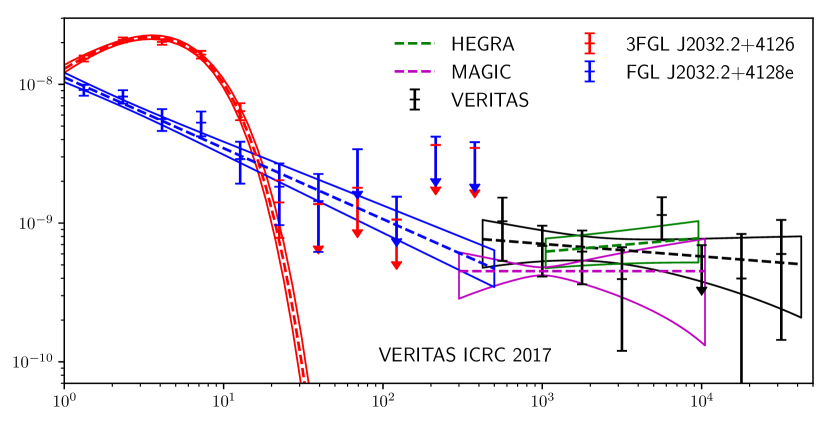
A gated Fermi-LAT analysis on 3FGL J2032.2+4126 showed an extended residual (fig. 3), with centroid (, ) = (, ) ((, ) = (, ). This residual was fit by an symmetric Gaussian source of 68% containment radius centered on this location with a TS of 321.1 and a TS of extension of 28.6. We name the source FGL J2032.2+4128e.
The VERITAS spectrum is well described by a power law with an index of and a normalization of at 2300 GeV (fig. 4(a)). The spectrum of FGL J2032.2+4128e can be described by a power law with index and a normalization of at 2.27 GeV. Comparing the spectra of FGL J2032.2+4128e and 3FGL J2032.2+4126 shows that, below 1 GeV, the extrapolated flux from FGL J2032.2+4128e would be stronger than 3FGL J2032.2+4126. It is likely, therefore, that at low energies some of the emission from 3FGL J2032.2+4126 is being included in the measured flux from FGL J2032.2+4128e. A joint fit to the VERITAS and Fermi-LAT data points for VER J2031+415/FGL J2032.2+4128e is well fit with a power law of index and normalization at 4.04 GeV.
It is likely that both the HE and VHE emission share a common origin. Given the proximity of the emission from both sources to the pulsar PSR J2032+4127, a PWN origin of this emission is a strong possibility. It has been suggested that PSR J2032+4127 is in a long-period binary system and that this is the origin of at least some of the VHE emission and could be confirmed through the detection of correlated variability across multiple wavelengths [9].
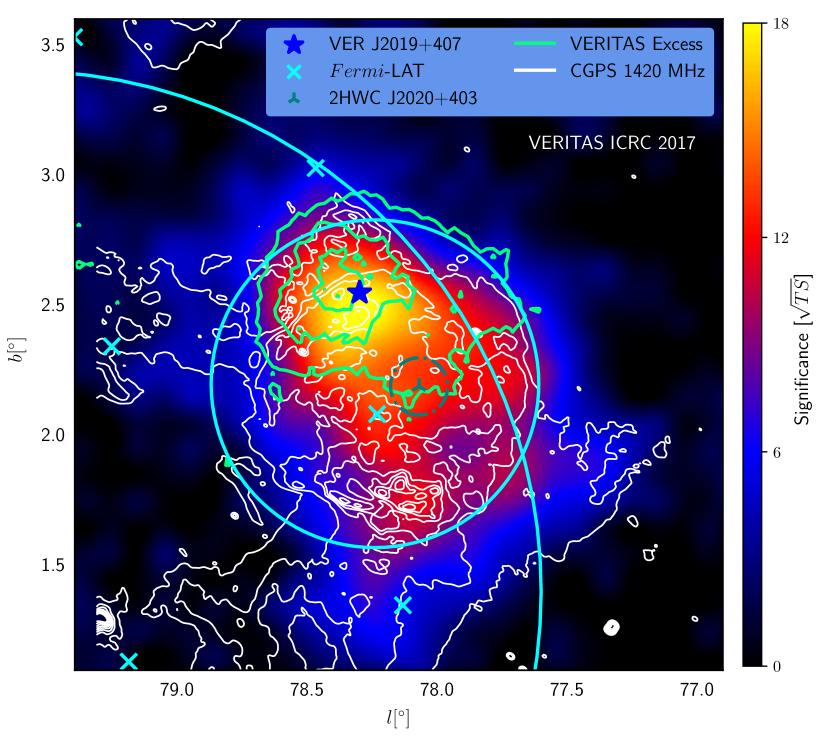
4.3 VER J2019+407
In this analysis, VER J2019+407 was observed by VERITAS at a peak significance of 7.6 using the Extended integration region. The centroid was (, ) = (, ) ((, ) = , ) with a semi-major axis of and a semi-minor axis of at an angle of east of galactic north. The Fermi-LAT morphology of 3FGL J2021.0+4031e was examined by producing a TS map of the region with 3FGL J2021.0+4031e removed from the model of the region (fig. 3). This shows a disk-like structure of similar size to the remnant detected in the CGPS 1420 MHz survey [13] but enhanced at the northern rim where the VERITAS emission is detected.
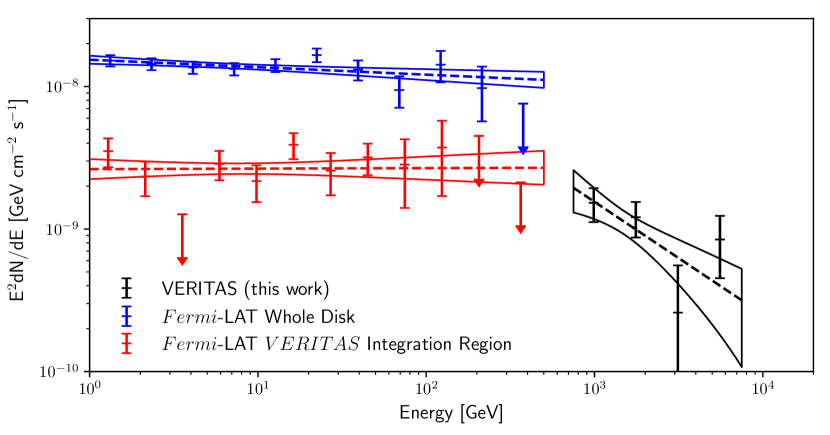
The VERITAS emission was fit with a power law of spectral index and a normalization of at 1500 GeV. Two Fermi-LAT SEDs were produced for 3FGL J2021.0+4031e. The first uses the full disk of radius 0.63° as in the 3FGL catalog and has a TS of 909.44 and spectral parameters of = , = at = 6780 GeV. For the second 3FGL J2021.0+4031e was broken up into two sources: the region inside the VERITAS Extended integration region and the remainder of the larger region outside of the VERITAS integration region. The two component are detected at TSs of 186.0 and 473.9 with fit parameters = , = at = 6775 GeV, and = , = at = 6775 GeV respectively (fig. 4(b)). A joint fit was conducted to the VERITAS and the Fermi-LAT spectral points for the part that lies within the VERITAS integration region. The best fit is with a broken power law ( = 7.8 for 9 DoF) of parameters = , = 405 GeV, = and = . Since the Fermi-LAT emission traces the morphology of G78.2+2.1, this is the most likely origin of this emission, and thus the most likely origin of the VERITAS emission, with the current VERITAS observations only able to detect the brightest part of the remnant.
4.4 VER J2019+368
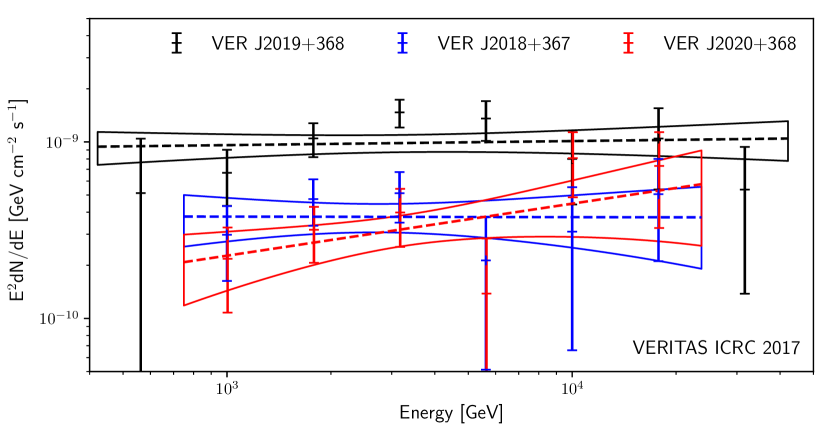
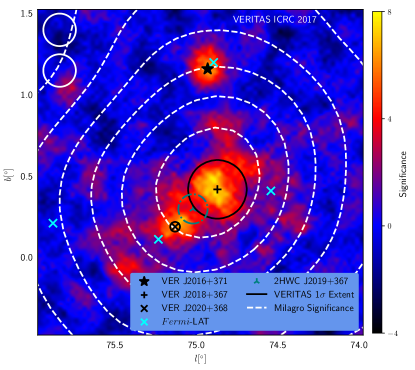
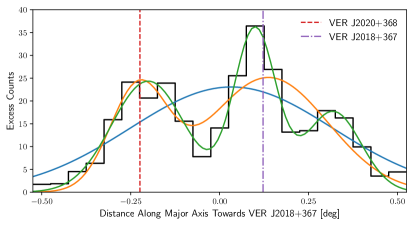
VER J2019+368 was observed at a peak (local) significance of 10.3 using the Extended integration region. The best fit morphology (/DoF = 0.838) has a centroid at (, ) = (, ) ((ra,dec) = (, )) with a 1 angular extension of by at an angle east of galactic north. The Point integration region analysis shows that the emission appears to be strongest in two regions, each of which is detected at a level greater than 7. This suggests that the emission may be the result of two sources that were previously unresolved (though whether these are two independent sources or two enhancements of a single, extended source, is as yet, uncertain). Jointly fitting the uncorrelated excess sky map with two, symmetric Gaussian functions identifies the sources at locations (, ) = (, ) and (, ) ((ra,dec) = (, ) and (, )) thus we name these sources VER J2018+367 and VER J2020+368. The two sources are separated by 0.35° and have 1 extensions of and respectively.
To explore this in more detail a section through the Point integration region excess map along the major axis of the fit to VER J2019+368 was produced. The data was binned using rectangles of width 0.05° and height 0.2° along a length of 1.0°. This section was fit with three models: a single Gaussian function, the sum of two Gaussian functions, and the sum of three Gaussian functions with p-values of 6, 4 and 0.12 respectively. The third Gaussian improved the fit beyond VER J2018+367 where there is a region of excess at around the 4 level.
A SED for VER J2019+368 was produced using the Extended integration region and was fit with both a power law and a log parabola, with the log parabola favored but not significantly (F-test = 1.75). The power law fit parameters are = and = at = 3110 GeV with a of 8.73 for 5 DoF. Spectra were also produced for VER J2018+367 and VER J2020+368 using the Point integration region. VER J2018+367 is fit with a power law of parameters = at = 2710 GeV and a spectral index of . VER J2020+368 shows a harder spectrum with a spectral index of and a flux normalization of at = 3270 GeV (fig. 4(c)).
3FGL J2021.1+3651 (PSR J2021+3651) is a -ray pulsar that lies 0.11° away from VER J2020+368. XMM-Newton and Suzaku observations clearly show a bright point source spatially coincident with the Fermi-LAT detected pulsar PSR J2021.1+3651, with associated extended emission from a PWN (G75.2+0.1) [10] stretching back towards VER J2020+368. It is likely that VER J2020+368 is associated with G75.2+0.1.
4.5 VER J2016+371
VER J2016+371 was observed using the Point integration region at 6.2. The location of this fit is (, ) = (, ) ((,) = , ) with no evidence of extension. The spectrum is fit with a power law of normalization at = 2510 GeV and spectral index .
To test the relative contributions of CTB 87 and the blazar QSO J2015+371 to the HE -ray emission, in addition to a single source model, a model with two power law sources at their radio locations was used. The two sources had test statistics of 102 and 1087 respectively. The spectra of the two sources are noticeably different, with the CTB 87 source being weaker and harder. Plotting all three Fermi-LAT spectra with the VERITAS spectrum (fig. 4(d)), shows good agreement between the spectrum of the Fermi-LAT CTB 87 source and VER J2016+371, whereas the QSO J2015+371 source would require a spectral hardening to fit the VERITAS results. Conducting a joint power law fit to the spectral points from the CTB 87 source and VER J2016+371 gives the parameters = at = 5.2 GeV and spectral index . Combined, the location of VER J2016+371 and the spectra of the Fermi-LAT emission, when fit as two sources, suggests that the Fermi emission from the direction of CTB 87 and VER J2016+371 are the same source and that they are associated with the PWN CTB 87.
5 Comparison to H.E.S.S. Galactic Plane Survey
The H.E.S.S. Galactic plane survey (GPS) [8] contains 56 sources and has similar sensitivity to this work. In the Fermi-LAT 3FGL catalog there are 339 total sources in the region covered by the GPS and 37 in the region covered by this work. We would therefore expect to detect 37/33956 = 6 VHE sources in the VERITAS survey, comparable to the 4/5 that we detect (depending on whether VER J2018+367 and VER J2020+368 are considered as independent sources or as hot spots in VER J2019+368). Performing similar calculations with the 2 and 3 FHL catalogs gives 3/4056 = 4 and 13/11956 = 6 VHE sources respectively.
6 Conclusions
The results of the VERITAS of the Cygnus region with a total observing time of about 309 h (271 h live time) and a Pass 8 Fermi-LAT analysis of the same region using over 7 years (2008 August - 2016 January) of data above 1 GeV were presented. These observations have enabled the most detailed study of the region to date in HE and VHE -rays. They have shown that the morphology of the HE emission from 3FGL J2021.0+4031e is not uniform, rather it peaks at the north eastern rim of the SNR, in the same region as the VERITAS emission from VER J2019+407 and the spectral fits show good agreement. An extended (68% containment radius = ) Fermi-LAT counterpart to VER J2031+415 (TeV J2032+4130) was detected at a test statistic of 321. VER J2019+368 was resolved into two sources in the VERITAS observations (VER J2018+367 and VER J2020+368) with both sources are detected at a level greater than 7. An exploration of the HE emission from the direction VER J2016+371 suggests that at least some of the emission is due to CTB 87 and a joint fit with the VERITAS data was conducted.
Acknowledgments.
We acknowledge the support listed at https://veritas.sao.arizona.edu.References
- [1] Aliu, E. et al. 2014, ApJ, 743, 16
- [2] Aliu, E. et al. 2013, ApJ, 770, 2
- [3] Aliu, E. et al. 2013, ApJ, 788, 78
- [4] Abeysekara, A. U. et al. 2017, arXiv:1702.02992
- [5] https://veritas.sao.arizona.edu
- [6] Acciari, V. A. et al. 2008, ApJ, 679, 1427
- [7] Atwood, W. B. et al. 2009, ApJ, 697, 1071
- [8] Carrigan, S. et al. 2013, arXiv:1307.4690
- [9] Lyne, A. et al. 2015, MNRAS, 451(1):581-587
- [10] Mizuno, T. et al. 2017, ApJ, 841, 104
- [11] Otte, A. N. 2009, arXiv:0907.4826
- [12] Park, N. 2015, arXiv:1508.07070
- [13] Taylor, R. et al. 2003, AJ, 125, 3145