The mass function of GX 3394 from spectroscopic observations of its donor star111Based on ESO programme IDs 097.D-0915 and 297.D-5048
Abstract
We obtained 16 VLT/X-shooter observations of GX 3394 in quiescence in the period May – September 2016 and detected absorption lines from the donor star in its NIR spectrum. This allows us to measure the radial velocity curve and projected rotational velocity of the donor for the first time. We confirm the 1.76 day orbital period and we find that = km s-1, = km s-1 and = km s-1. From these values we compute a mass function = , a factor lower than previously reported, and a mass ratio = . We confirm the donor is a K-type star and estimate that it contributes of the light in the - and H-band. We constrain the binary inclination to and the black hole mass to . GX 3394 may therefore be the first black hole to fall in the ‘mass-gap’ of .
1 Introduction
GX 3394 is a low mass X-ray binary (LMXB) system that has been studied extensively since its discovery (e.g. Markert et al., 1973; Miyamoto et al., 1991; Méndez & van der Klis, 1997; Gallo et al., 2004; Plant et al., 2015). It shows relatively frequent outbursts (four in the last decade); all four X-ray states typically seen in X-ray binaries (XRBs) have been detected in this system, and X-ray observations of this system have been very important in shaping the theory of LMXBs (e.g. Miyamoto et al., 1995; Homan & Belloni, 2005; Plant et al., 2014). The relation between X-ray and radio emission from XRBs also relies heavily on observations of GX 3394 (e.g. Corbel et al., 2013; Gallo et al., 2014).
However, the mass of the compact object in GX 3394 is not known. Although it has long been suspected to harbor a black hole (BH) (Cowley et al., 1987; McClintock & Remillard, 2006), dynamical evidence for this was long missing because its optical spectrum in quiescence is dominated by the accretion disc (Shahbaz et al., 2001). Hynes et al. (2003) were the first to detect dynamical evidence for a BH from CIII/NIII Bowen emission lines modulated on an orbital period of 1.7557 days. These lines are suspected to originate in the irradiated atmosphere of the donor star. They found a lower limit on the radial velocity semi-amplitude () of km s-1, corresponding to a mass function . Their reported orbital period was later detected in X-rays as well (Levine & Corbet, 2006). Muñoz-Darias et al. (2008) refined the Hynes et al. (2003) result by applying the K-correction and suggested that the donor star is a stripped giant with an effective temperature of K.
The mass function reported by Hynes et al. (2003) was surprisingly large given that the inclination of the system is believed to be low based on the small separation of the double peaked emission lines (cf. Wu et al. 2001). To obtain a reliable mass function for GX 3394, it is necessary to measure the radial velocity (RV) curve using absorption lines from the photosphere of the donor star. As these have not been detected in its visible spectrum because of the bright accretion disc, we used the very wide spectral range of X-shooter (Vernet et al., 2011) on the Very Large Telescope (VLT) to search for absorption lines in the near-infrared (NIR) while GX 3394 was in a quiescent phase in the summer of 2016. A similar approach led to the measurement of the mass function for GRS 1915+105, a system that is too obscured to be observed at visible wavelengths (although for GRS 1915, the RV curve was measured while the system was in outburst; Greiner et al., 2001; Steeghs et al., 2013). Here we present our measurement of the RV curve of GX 3394 using stellar absorption lines detected in the - and H-band. Section 2 describes our observations and data reduction. In Section 3 we describe our RV measurements and our analysis of the average spectrum to determine the rotational velocity () of the donor star. We discuss the implications for the mass function, our estimate of the mass ratio, and the distance to GX 3394 and present our conclusions in Section 4. All errors quoted in this paper are single parameter errors, and limits are 95% confidence limits. All errors on derived quantities are calculated using Monte Carlo error analysis. Quoted wavelengths are in air.
2 Observations and data reduction
2.1 X-shooter spectra of GX 3394
We obtained 16 VLT/X-shooter spectra of GX 3394 in service mode while the system was in quiescence: 1 pilot observation on May 22, 2016 (run code 097.D-0915) and subsequently 15 observations between August 10 and September 8, 2016 granted as director’s discretionary time (run code 297.D-5048; see Table 1 for a log of the observations). Every spectrum was obtained in one observing block (OB) including the target acquisition and one ABBA nod pattern, using the XSHOOTER_slt_obs_AutoNodOnSlit template and a nod throw of 5”. Individual exposure times are 250, 200 and 275 s for the UVB, VIS and NIR arms, respectively. This yields total integration times of 1000, 800 and 1100 s for the respective arms for each of the 16 observations. We use the 1.0” slit in the UVB arm, the 0.9” slit in the VIS arm and the 0.9JH” slit (with K-band blocking filter) in the NIR arm. This setup was chosen to maximize signal to noise (S/N) in the - and -bands. The slitwidth-limited resolution R is 4350 in the UVB arm, 7410 in the VIS arm and 5410 in the NIR arm. In some observing nights, more than one OB was executed. In these cases the target was reacquired at the beginning of each OB. A telluric standard star was observed for every science spectrum. Sky conditions were photometric on 2016-08-14 and clear on all other nights.
| UT date | MJD mid time | Sky222The sky conditions in all observations were either clear (CLR) or photometric (PHO). | VIS IQ333The image quality (IQ) is measured as the FWHM of the spatial profile of the 2D spectrum in the , , , and -bands. | NIR IQ | RV |
| (yyyy-mm-dd) | ( - , arcsec) | ( - , arcsec) | (km s-1) | ||
| 2016-05-22 | 57530.7647627 | CLR | 0.75-0.8 | 0.8-0.7 | |
| 2016-08-09 | 57610.4930110 | CLR | 1.0 | 1.0-0.85 | |
| 2016-08-10 | 57611.4814135 | CLR | 0.9 | 0.75-0.65 | |
| 2016-08-12 | 57613.4822289 | CLR | 0.9-0.8 | 0.8-0.7 | |
| 2016-08-14 | 57614.5926091 | PHO | 1.0 | 1.0-0.85 | |
| 57614.6310668 | PHO | 0.85-0.95 | 0.9-0.8 | ||
| 2016-08-30 | 57631.4852136 | CLR | 0.85-0.95 | 0.8-0.7 | |
| 2016-08-31 | 57631.5239705 | CLR | 0.9 | 0.8-0.7 | |
| 57631.5558336 | CLR | 0.85-1.0 | 0.95-0.8 | ||
| 2016-09-03 | 57634.5215575 | CLR | 0.9 | 0.9-0.8 | |
| 57634.5612928 | CLR | 0.8 | 0.8-0.65 | ||
| 2016-09-04 | 57636.4847256 | CLR | 0.9-0.8 | 0.75-0.65 | |
| 2016-09-05 | 57637.4787554 | CLR | 0.8 | 0.7-0.65 | |
| 2016-09-06 | 57637.5182959 | CLR | 0.9 | 0.75-0.7 | |
| 57637.5527546 | CLR | 1.0 | 0.85-0.8 | ||
| 2016-09-07 | 57639.4869854 | CLR | 0.7-0.8 | 0.65-0.6 |
For all observations we use a sky position angle of 119∘ so that both the counterpart to GX 3394 and a nearby star (star B in Shahbaz et al. 2001) fall in the slits of the three arms. The separation between GX 3394 and star B is only , so we require a seeing of (as measured in the V-band) to separate the two spectra. This condition was met in most observations. Because in the NIR arm the seeing is smaller than the slit width in all observations, the resolution is set by the seeing rather than by the slit. This means that the effective resolution varies between the spectra and is somewhat higher than the slit-limited resolution of R = 5410, or km s-1 at 1.65 m. To quantify this, we measure the full width at half maximum (FWHM) of the spectra by fitting two Gaussians to the spatial profile of star B and GX 3394 at several wavelengths (see Table 1). The spectra taken under the best seeing conditions have a FWHM in the H-band of , which corresponds to a resolution of R = 7490 or km s-1.
As expected, there is hardly any signal in the UVB arm. The S/N in the VIS arm is rather low () but the H line is clearly detected. The NIR arm has the highest continuum S/N ratio in all observations, varying from depending on the seeing. We analyze the data from the VIS and NIR arms only.
We process the data of GX 3394 and the telluric standards using the X-shooter pipeline in the Reflex environment (Freudling et al., 2013). This produces a flat-fielded, sky-subtracted, rectified, wavelength- and flux-calibrated 2D image and a 1D extracted spectrum. We also use the Starlink package Figaro to optimally extract the GX 3394 spectra with the tasks profile and optextract (Horne, 1986), using a non-symmetric extraction region to avoid as much as possible contamination from star B. Comparing the spectra extracted in these different ways, we find that the optimal extraction significantly reduces the errors for the NIR arm spectra, while it does not improve the VIS arm spectra that are dominated by emission lines. Therefore we use the optimally extracted spectra in the NIR arm and the spectra provided by the pipeline for the VIS arm. For the telluric standards we take the normally extracted spectra provided by the pipeline.
The size of the extraction aperture for the NIR spectra is determined by the proximity of star B, not by the width of the spatial profile. This causes a loss of NIR flux that is most significant in the spectra taken under the worst seeing conditions. In combination with the fact that most spectra were taken under clear, not photometric conditions this means that the absolute flux calibration of our spectra is not accurate.
For the telluric correction of the NIR arm data, we use the telluric calibration package Molecfit (Kausch et al., 2015; Smette et al., 2015). First we fit an atmospheric model to the telluric standard stars, to determine the concentrations of H2O, CO2, CH4 and O2. We then fit an atmospheric model to the GX 3394 spectra, keeping the concentrations fixed, and apply the telluric correction.
2.2 Templates
To measure the RVs and rotational broadening of the GX 3394 spectra we compare them with template spectra. We use both spectra of Galactic stars observed with X-shooter and synthetic spectra from model atmospheres at different temperatures as templates.
We retrieved the raw data of several K-stars and one late G-type star from the ESO archive (see Table 2). These stars were observed with X-shooter as part of the X-shooter Spectral Library (XSL) project, with the NIR arm slit as for our GX 3394 data but without the K-band blocking filter (Chen et al., 2014, program ID 085.B-0751). All were observed with seeing in the NIR so their spectral resolution is determined by the slit width. The XSL contains only one K-type subgiant; to obtain templates spanning a range of spectral types we also include several giant stars. We reduce the NIR arm data in the same way as for the telluric standard stars, using the X-shooter pipeline in Reflex to extract the spectra and Molecfit to correct for telluric absorption.
| Star | Spectral type |
|---|---|
| HD 83212 | G8III |
| HD 170820 | K0III |
| HD 165438 | K1IV |
| HD 37763 | K2III |
| HD 175545 | K2III |
| HD 65354 | K3III |
In addition we use three model atmospheres with , solar metallicity, and effective temperatures of , and K. These were produced using the state-of-the-art realistic three-dimensional radiative hydrodynamical (RHD) simulations of stellar convection carried out with the Stagger-code (Nordlund et al., 2009). These simulations cover a large part of the HR diagram including the evolutionary phases from the main sequence over the turnoff up to the red-giant branch for low-mass stars (Magic et al., 2013). These simulations have been used to compute synthetic spectra in the range of X-shooter with the multidimensional pure-LTE radiative transfer code Optim3D (Chiavassa et al., 2009). The code takes into account the Doppler shifts occurring due to convective motions and solves monochromatically for the emerging intensity including extensive atomic and molecular continuum and line opacity data from UV to far-IR. We smooth the high-resolution RHD simulations both to the slitwidth-limited X-shooter resolution ( km s-1) and to the highest resolution present among our GX 3394 observations ( km s-1) and rebin the two sets of synthetic spectra to the same velocity scale as the data.
3 Analysis and results
3.1 The RV curve of GX 3394
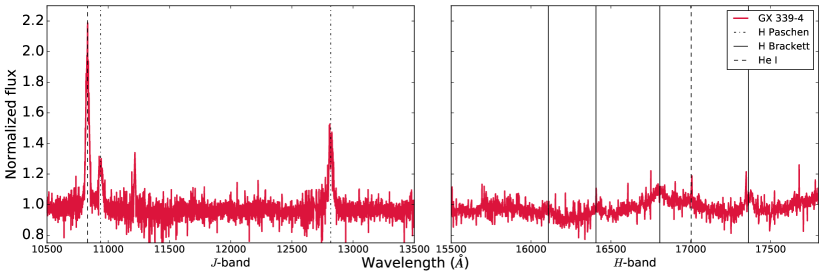
We use Tom Marsh’ program Molly444http://www2.warwick.ac.uk/fac/sci/physics/research/astro/people/marsh/software/ to further analyze the data. First we apply hfix to convert to heliocentric velocities and we mask noisy pixels (mainly due to residuals from strong telluric emission lines). For the NIR data, we use vbin to rebin all spectra to a common velocity spacing of km s-1 per pixel, the average velocity dispersion of X-shooter in the - and H-band. Absorption lines corresponding to Mg i (m) and Al i (at m) are visible in the individual spectra, indicating that the donor star is a K-type star (e.g. Meyer et al., 1998; Wallace et al., 2000, see Section 3.2). To prepare the spectra for cross-correlation, we first scale them by dividing through a constant and then subtract a spline-fit. K-star spectra have many absorption lines which makes defining the continuum level difficult. We determine the normalization factor by fitting a constant to a relatively clean region of the spectrum close to the strong Mg i line at 1.71m. For the spline fit, we mask the regions in the J-band and between the - and H-band that are severely affected by telluric absorption, as well as the H and He emission lines that are present in the GX 3394 spectra (see Figure 1).
We prepare the templates in the same way as the GX 3394 spectra. In addition we cross-correlate the spectra of the templates stars observed with X-shooter with the RHD simulations to obtain accurate radial velocities, and shift the template spectra to remove their intrinsic radial velocity. We then cross-correlate the 16 individual GX 3394 spectra with the different templates using the task xcor, excluding regions with high noise levels and emission lines. All three RHD simulations, at both resolutions, and the XSL stars yield consistent RVs. The highest values for the cross-correlation function are found for the K model smoothed to km s-1, hence the results in this paper are from the cross-correlation with that template. For five GX 3394 spectra with lower S/N we find that only considering the regions around the strongest absorption lines in the cross-correlation significantly improves the signal. The highest S/N spectra, and low S/N spectra with many masked pixels in these regions, do not benefit from this approach — for those we use the RV found by cross-correlating the full selected spectral range.
xcor gives only a purely statistical error that underestimates the real uncertainty in the RV measurement. To better constrain the uncertainty we use the boot command in Molly to produce 1000 bootstrapped copies of every spectrum which we then cross-correlate with the model spectrum. We fit a Gaussian to the resulting distribution of RVs, and adopt the mean and standard deviation of that Gaussian as reliable estimates of the RV and uncertainty. The results are listed in Table 1; the error includes the uncertainty in the wavelength calibration of X-shooter (2 km s-1).
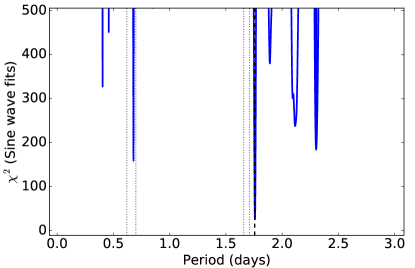
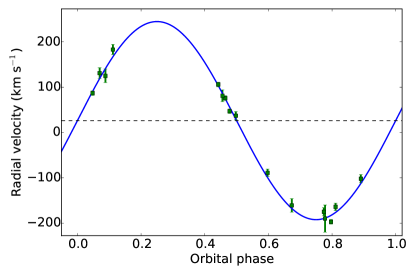
To determine the orbital period we fit sinusoids of the form for a range of periods and calculate (see Figure 2). We find that the minimum is 25.6 (with 13 degrees of freedom) for a period of d, where the uncertainty is set by the change in for which . Our spectroscopic orbital period confirms the orbital period reported by Hynes et al. (2003) and Levine & Corbet (2006). The resulting RV curve is plotted in Figure 3. The best-fit parameters are = km s-1, measured with respect to the heliocentric velocity, = km s-1, and the time of inferior conjunction of the donor star MJD .
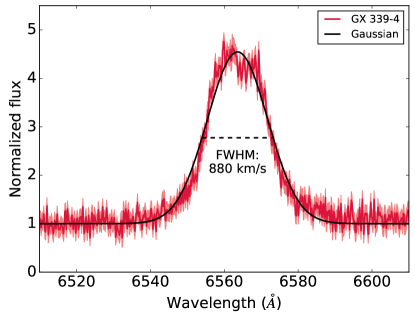
In addition we evaluate using the relation between this orbital parameter and the FWHM of the H line (Casares, 2015). The H line in our GX 3394 spectra is double-peaked. Following the approach of Casares (2015), we fit a single Gaussian profile to the H emission line in each VIS spectrum with mgfit. We find an average FWHM of km s-1(corrected for the instrumental resolution; see Figure 4). This corresponds to km s-1 according to the Casares (2015) relation.
3.2 Projected rotational velocity
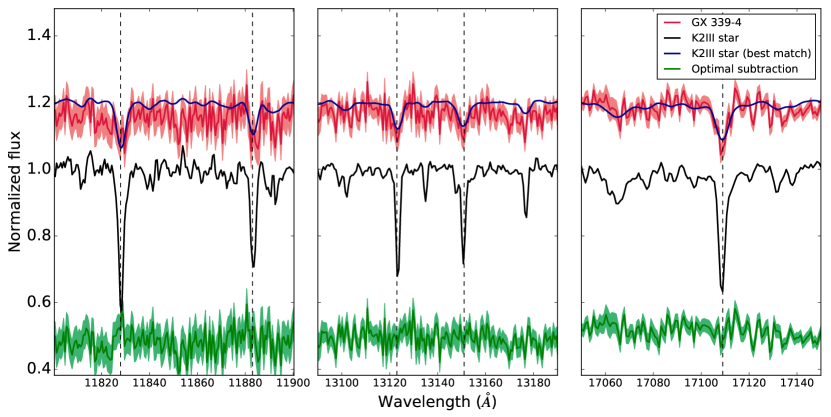
To obtain a higher S/N spectrum for determining both the projected rotational velocity and spectral type of the donor star, we normalize the individual NIR spectra by dividing them through a spline fit, correct for the RVs of the individual spectra and average them, weighted by their mean (S/N)2. In the resulting spectrum several absorption lines are detected, mainly due to Al i and Mg i (see Figure 5). The lines are weaker than those in the model spectra, indicating that the accretion disc still contributes significantly to the detected NIR continuum flux, and broadened because of the rotation of the tidally locked star.
To determine the projected rotational velocity of the donor star, and the contribution of the accretion disc to the NIR emission, we use the optimal subtraction method (Marsh et al., 1994). In Molly, we broaden all templates by a range of velocities (0 – 100 km s-1 in steps of 1 km s-1) with rbroad and then use optsub with a linear limb darkening coefficient of 0.75 to subtract the broadened models from the average GX 3394 spectrum. For the optimal subtraction we use small spectral regions containing the five strongest absorption lines in the GX 3394 spectrum. optsub subtracts a constant times the template from the GX 3394 spectrum, adjusting the constant to minimise the residual scatter between the spectra. The scatter is measured by computing the between the residual spectrum and a smoothed version of itself, produced by convolving the subtracted spectrum with a Gaussian with a FWHM of 25 pixels.
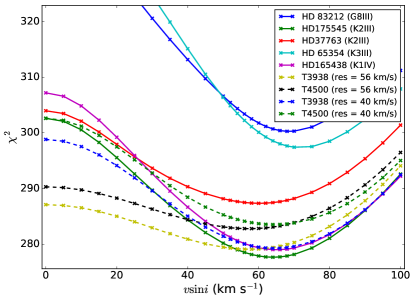
Apart from the two worst-matched templates, all distributions yield consistent values, with only small differences between the results found by using the higher and lower resolution RHD simulations (see Figure 6). This confirms that we are resolving the stellar absorption lines with our instrumental set-up under the prevailing seeing conditions. We find that using a different limb darkening factor of 0.5 influences the measurement by km s-1. The best-fitting templates are the K RHD simulation, a K2III star and the K1IV star; the K2III star HD 175545 has the lowest minimal of 278 (with 361 degrees of freedom) for an optimum factor of . This template, and the residuals of the optimal subtraction, are shown in Figure 5. To obtain a reliable estimate of the uncertainty we follow the bootstrapping approach by Steeghs & Jonker (2007): we produce 1000 bootstrapped copies of the average GX 3394 spectrum and repeat the optimal subtraction analysis with the two best-matched templates (HD 175545 and HD 165438) for each of them. For every bootstrapped copy we find the value of that results in the minimum . We fit a Gaussian to the resulting distributions of values and adopt the mean and standard deviation as the best estimate of and its uncertainty. For both templates we find that = km s-1, and the donor star contributes of the light in the NIR.
4 Discussion and conclusions
For the first time we have detected absorption lines from the donor star in GX 3394. We observed the source 16 times between May and September 2016 with VLT/X-shooter, allowing us to reliably measure its RV curve (see Figure 3). We find a systemic RV of km s-1, in agreement with the value found by Hynes et al. (2003), and our measurement of d confirms and refines the preferred orbital period of Hynes et al. (2003). We measure the radial velocity semi-amplitude to be = km s-1.
4.1 Discrepancy with Bowen blend measurement
Our measurement of is significantly lower than the lower limit of km s-1 reported by Hynes et al. (2003) based on the Bowen blend emission lines. One explanation for this discrepancy could be that the absorption lines in our NIR spectra are predominantly formed very close to the tip of the Roche lobe, and our measurement simply requires a larger K-correction than the Bowen blend measurement. Following the procedure for K-correction outlined by Muñoz-Darias et al. (2008), taking the maximum acceptable value for with based on our measurement (see Section 4.2), we find a maximum correction factor of . This could in principle reconcile our value for with the one found by Hynes et al. (2003). This scenario would imply significant X-ray irradiation of the donor star during quiescence and that the absorption lines are stronger when we view the irradiated side of the donor star. Our spectra cover most orbital phases; we find no such variation in the presence or strength of the absorption lines. In contrast, the Bowen blend emission lines used by Hynes et al. (2003) are only present in part of the orbit. The total NIR flux does vary between our spectra, but not as a function of phase; it is correlated to the observing conditions. This is because the size of the extraction region is limited by the close proximity of the second star in the slit rather than by the width of the profile, which causes more flux to be lost in spectra taken under worse seeing conditions. These results support that our measured RVs reflect the motion of the center of mass of the donor star and we do not underestimate .
In addition, the implied by the FWHM of the H emission line is km s-1, consistent with the value obtained from our dynamical study. As noted by Casares (2015), a caveat when using this relation is that the width of the line rises steadily after an outburst and it takes several years of quiescence to ‘settle down’. Because of the frequent outbursts of GX 3394 it is not clear if this system ever reaches that equilibrium state. For comparison, Rahoui et al. (2014) obtained three spectra of GX 3394 during its 2010 outburst, two while it was rising in the hard state and one after it transitioned to the soft state, and report values for the FWHM of the H line of , , and at those epochs, respectively. Our FWHM of is significantly higher, in line with expectations. The last major outburst of GX 3394 took place in December 2014, 1.5 years before our observations. In V404 Cyg, for which Casares (2015) shows the evolution of the H FWHM in the 20 years after an outburst, the width of the line approaches its equilibrium state after days (their figure 2). This suggests that our measurement from this relation should be close to the real value, which further strengthens the case for a lower than found through the Bowen blend method.
This large discrepancy between the RV semi-amplitude measured from the Bowen blend lines and our value shows that in the case of GX 3394, the assumption that the narrow emission lines originate in the irradiated side of the donor star is likely wrong. Rather, the sharp Bowen blend lines must predominantly be emitted in a different location in the system with a higher Keplerian velocity or be a combination of the Keplerian motion of the star and gas flow motions. This implies that using the RV curve of the narrow Bowen blend lines may not always be a good alternative to obtaining the RV curve of the donor star by the motion of photospheric absorption lines if one wants to measure in BH XRBs.
4.2 Mass function and mass ratio
Our measurement corresponds to a mass function
| (1) |
where is the mass of the compact object and is the mass ratio between the donor star and the compact object, . This mass function is a factor lower than derived from the Bowen emission line measurements for GX 3394.
The mass ratio in a Roche-lobe overflow system is related to the projected rotational velocity and as
| (2) |
given that the rotation of the mass donor star will be tidally locked with the orbital period (e.g. Gies & Bolton, 1986). We find that km s-1, which, combined with our measurement of , implies that = .
4.3 Constraints on the inclination and BH mass
The inclination of GX 3394 has been suspected to be low rather than high based on the small separation of the double-peaked emission lines (Wu et al., 2001).
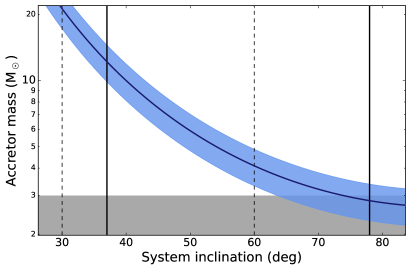
Modeling of the reflection component of the X-ray spectra of GX 3394 has yielded inclinations ranging from (e.g. Fürst et al., 2015; García et al., 2015; Basak & Zdziarski, 2016; Parker et al., 2016). An inclination in this range would lead to a BH mass between (see Figure 7). However, this method gives the inclination of the inner accretion disc which is not necessarily the same as the binary inclination if the BH spin angular momentum axis is not aligned with the binary angular momentum vector.
An upper limit to the binary inclination is provided by the fact that GX 3394 does not show eclipses in its X-ray light curve; with = , the donor star subtends an angle of as seen from the compact object (Paczyński, 1971), setting an upper limit to the inclination of . Combined with our value, at this inclination our mass function yields a BH mass of , and a 95% confidence lower limit to the mass of the compact object of .
Muñoz-Darias et al. (2008) found a maximum mass for a sub-giant donor star of 1.1 . Combined with our mass ratio this implies a maximum mass for the BH of , or a 95% confidence upper limit of . This also sets a lower limit to the binary inclination of .
A reliable measurement of the binary inclination of GX 3394, for example through the detection of ellipsoidal modulations, is required to determine the mass of the accretor in this system.
4.4 Donor star properties and distance to GX 3394
From our optimal subtraction analysis we conclude that the donor is most likely a K1 or K2 star, confirming the result of Hynes et al. (2004) and Muñoz-Darias et al. (2008). The S/N of our spectrum is not high enough to significantly detect many of the fainter absorption lines that are present in such stars, but we clearly detect the strongest lines due to Mg I and Al I (see Figure 5). However, the strongest Si I line in the template spectra (at 1.59 m) is not detected in our GX 3394 spectrum, which may indicate that the donor has an anomalous Si abundance. Higher S/N spectra are necessary to investigate this further. The star contributes of the NIR emission.
The distance to GX 3394 is not accurately known; Hynes et al. (2004) found a lower limit to the distance of 6 kpc, but point out that their observations are also consistent with a much larger distance of kpc. The flux calibration of our spectra is not absolute as they were largely taken under non-photometric conditions and because the size of the extraction region is limited by the proximity of star B. However, we can derive a lower limit to the distance of GX 3394 using the spectrum with the highest measured flux. This is the spectrum taken on 2016-05-22, which has an average flux density of erg cm-2 s-1 Å-1 in the H-band — we use the H-band because it suffers the least from extinction. Taking as the stellar contribution in line with our optimal subtraction results, this translates into an H-band magnitude of the donor star of .
For a lower limit on the distance we take the minimum mass models for the donor star from Muñoz-Darias et al. (2008), the properties of which translate into an absolute H-band magnitude of . For the extinction towards GX 3394 we follow Muñoz-Darias et al. (2008) and adopt (Hynes et al., 2004), which corresponds to . Using these values we find a distance to GX 3394 of kpc. The main source of uncertainty is in the flux of the donor star. We conservatively estimate the uncertainty on the stellar flux as . This translates into a uncertainty on the distance. We thus find a lower limit on the distance of kpc, although given the fact that the X-ray activity of GX 3394 favors a donor mass at the higher end of the allowed mass range (Muñoz-Darias et al., 2008), a larger distance seems more likely. These conclusions are in agreement with those of Hynes et al. (2004).
4.5 Comparison with XTE J1550-564
It is interesting to note the difference in between GX 3394 and XTE J1550-564, which has a very similar orbital period (1.54 days) and has been suggested as a ‘twin’ system to GX 3394 (Muñoz-Darias et al., 2008). Its donor star has been identified as a K3 star (Orosz et al., 2011). However, XTE J1550-564 in quiescence shows an H line with a FWHM of km s-1 (Casares, 2015), and it has an RV semi-amplitude of km s-1 (Orosz et al., 2011). The difference between the two systems may be due to inclination: XTE J1550-564 has a relatively high inclination of , and an inclination of for GX 3394 would explain the difference in . Alternatively GX 3394 may contain a less massive BH than XTE J1550-564, which contains a BH with a mass in the range of 7.8 – 15.6 . The lower mass ratio in XTE J1550-564 () would suggest a more massive BH if the donor star masses are similar in both systems.
4.6 Conclusions
We obtained 16 VLT/X-shooter observations of GX 3394 and detected absorption lines from the donor star in the NIR spectrum, allowing us to measure the RV semi-amplitude and projected rotational velocity of the donor star for the first time. We measure = km s-1 and = km s-1. This implies a mass ratio = and a mass function = . The value we find for is significantly lower than the value obtained using the Bowen blend method, showing that a mass function based on RV measurements of these emission lines can be incorrect.
The donor is a K1-2 type star and we estimate that it contributes of the light in the - and H-band. Adopting the minimum mass model for a stripped donor star from Muñoz-Darias et al. (2008) we obtain a lower limit to the distance to GX 3394 of kpc, in agreement with Hynes et al. (2004).
Without the binary inclination we can only set limits to the accretor mass; we find , which means that a (massive) neutron star accretor cannot be excluded. Although a low system inclination would still allow for a BH more massive than 5 , the mass function of GX 3394 is much lower than has been assumed to date and it may in fact be the first BH to fall in the ‘mass-gap’ of (Özel et al., 2010; Farr et al., 2011).
Acknowledgments
MH would like to thank Javier García for valuable discussions. We would like to thank the ESO director for granting us DDT time for this project and the ESO staff for executing the observations. This research is based on observations made with ESO Telescopes at the La Silla Paranal Observatory under programme IDs 097.D-0915 and 297.D-5048. It also made use of data obtained from the ESO Science Archive Facility, programme ID 085.B-0751. This research made use of the software package Molly provided by Tom Marsh.
References
- Basak & Zdziarski (2016) Basak, R., & Zdziarski, A. A. 2016, MNRAS, 458, 2199
- Callanan et al. (1992) Callanan, P. J., Charles, P. A., Honey, W. B., & Thorstensen, J. R. 1992, MNRAS, 259, 395
- Casares (2015) Casares, J. 2015, ApJ, 808, 80
- Chen et al. (2014) Chen, Y.-P., Trager, S. C., Peletier, R. F., et al. 2014, A&A, 565, A117
- Chiavassa et al. (2009) Chiavassa, A., Plez, B., Josselin, E., & Freytag, B. 2009, A&A, 506, 1351
- Corbel et al. (2013) Corbel, S., Coriat, M., Brocksopp, C., et al. 2013, MNRAS, 428, 2500
- Cowley et al. (1987) Cowley, A. P., Crampton, D., & Hutchings, J. B. 1987, AJ, 93, 195
- Cowley et al. (2002) Cowley, A. P., Schmidtke, P. C., Hutchings, J. B., & Crampton, D. 2002, AJ, 123, 1741
- Farr et al. (2011) Farr, W. M., Sravan, N., Cantrell, A., et al. 2011, ApJ, 741, 103
- Freudling et al. (2013) Freudling, W., Romaniello, M., Bramich, D. M., et al. 2013, A&A, 559, A96
- Fürst et al. (2015) Fürst, F., Nowak, M. A., Tomsick, J. A., et al. 2015, ApJ, 808, 122
- Gallo et al. (2004) Gallo, E., Corbel, S., Fender, R. P., Maccarone, T. J., & Tzioumis, A. K. 2004, MNRAS, 347, L52
- Gallo et al. (2014) Gallo, E., Miller-Jones, J. C. A., Russell, D. M., et al. 2014, MNRAS, 445, 290
- García et al. (2015) García, J. A., Steiner, J. F., McClintock, J. E., et al. 2015, ApJ, 813, 84
- Gies & Bolton (1986) Gies, D. R., & Bolton, C. T. 1986, ApJ, 304, 371
- Greiner et al. (2001) Greiner, J., Cuby, J. G., & McCaughrean, M. J. 2001, Nature, 414, 522
- Homan & Belloni (2005) Homan, J., & Belloni, T. 2005, Ap&SS, 300, 107
- Horne (1986) Horne, K. 1986, PASP, 98, 609
- Hynes et al. (2003) Hynes, R. I., Steeghs, D., Casares, J., Charles, P. A., & O’Brien, K. 2003, ApJ, 583, L95
- Hynes et al. (2004) —. 2004, ApJ, 609, 317
- Kausch et al. (2015) Kausch, W., Noll, S., Smette, A., et al. 2015, A&A, 576, A78
- Lattimer (2012) Lattimer, J. M. 2012, Annual Review of Nuclear and Particle Science, 62, 485
- Levine & Corbet (2006) Levine, A. M., & Corbet, R. 2006, The Astronomer’s Telegram, 940
- Magic et al. (2013) Magic, Z., Collet, R., Asplund, M., et al. 2013, A&A, 557, A26
- Markert et al. (1973) Markert, T. H., Canizares, C. R., Clark, G. W., et al. 1973, ApJ, 184, L67
- Marsh et al. (1994) Marsh, T. R., Robinson, E. L., & Wood, J. H. 1994, MNRAS, 266, 137
- McClintock & Remillard (2006) McClintock, J. E., & Remillard, R. A. 2006, Black hole binaries, ed. W. H. G. Lewin & M. van der Klis, 157–213
- Méndez & van der Klis (1997) Méndez, M., & van der Klis, M. 1997, ApJ, 479, 926
- Meyer et al. (1998) Meyer, M. R., Edwards, S., Hinkle, K. H., & Strom, S. E. 1998, ApJ, 508, 397
- Miyamoto et al. (1991) Miyamoto, S., Kimura, K., Kitamoto, S., Dotani, T., & Ebisawa, K. 1991, ApJ, 383, 784
- Miyamoto et al. (1995) Miyamoto, S., Kitamoto, S., Hayashida, K., & Egoshi, W. 1995, ApJ, 442, L13
- Muñoz-Darias et al. (2008) Muñoz-Darias, T., Casares, J., & Martínez-Pais, I. G. 2008, MNRAS, 385, 2205
- Nordlund et al. (2009) Nordlund, Å., Stein, R. F., & Asplund, M. 2009, Living Reviews in Solar Physics, 6, 2
- Orosz et al. (2011) Orosz, J. A., Steiner, J. F., McClintock, J. E., et al. 2011, ApJ, 730, 75
- Özel et al. (2010) Özel, F., Psaltis, D., Narayan, R., & McClintock, J. E. 2010, ApJ, 725, 1918
- Paczyński (1971) Paczyński, B. 1971, ARA&A, 9, 183
- Parker et al. (2016) Parker, M. L., Tomsick, J. A., Kennea, J. A., et al. 2016, ApJ, 821, L6
- Plant et al. (2014) Plant, D. S., Fender, R. P., Ponti, G., Muñoz-Darias, T., & Coriat, M. 2014, MNRAS, 442, 1767
- Plant et al. (2015) —. 2015, A&A, 573, A120
- Rahoui et al. (2014) Rahoui, F., Coriat, M., & Lee, J. C. 2014, MNRAS, 442, 1610
- Shahbaz et al. (2001) Shahbaz, T., Fender, R., & Charles, P. A. 2001, A&A, 376, L17
- Smette et al. (2015) Smette, A., Sana, H., Noll, S., et al. 2015, A&A, 576, A77
- Steeghs & Jonker (2007) Steeghs, D., & Jonker, P. G. 2007, ApJ, 669, L85
- Steeghs et al. (2013) Steeghs, D., McClintock, J. E., Parsons, S. G., et al. 2013, ApJ, 768, 185
- Vernet et al. (2011) Vernet, J., Dekker, H., D’Odorico, S., et al. 2011, A&A, 536, A105
- Wallace et al. (2000) Wallace, L., Meyer, M. R., Hinkle, K., & Edwards, S. 2000, ApJ, 535, 325
- Wu et al. (2001) Wu, K., Soria, R., Hunstead, R. W., & Johnston, H. M. 2001, MNRAS, 320, 177