Coronal X-ray emission and planetary irradiation in HD 209458
HD 209458 is one of the benchmark objects in the study of hot Jupiter atmospheres and their evaporation through planetary winds. The expansion of the planetary atmosphere is thought to be driven by high-energy EUV and X-ray irradiation. We obtained new Chandra HRC-I data, which unequivocally show that HD 209458 is an X-ray source. Combining these data with archival XMM-Newton observations, we find that the corona of HD 209458 is characterized by a temperature of about 1 MK and an emission measure of cm-3, yielding an X-ray luminosity of erg s-1 in the keV band. HD 209458 is an inactive star with a coronal temperature comparable to that of the inactive Sun but a larger emission measure. At this level of activity, the planetary high-energy emission is sufficient to support mass-loss at a rate of a few times g s-1.
Key Words.:
Stars: individual: HD 209458, Stars: coronae, Stars: activity, X-rays: stars, Planets and satellites: gaseous planets1 Introduction
Planets orbiting their host stars at close proximity are thought to undergo mass-loss through planetary winds driven by stellar X-ray and extreme ultraviolet irradiation (e.g., Salz et al., 2016a, b). This may even affect the planetary evolution (Sanz-Forcada et al., 2010) and thus, precise knowledge of the stellar high-energy spectrum is critical to understand both the stars and their planets.
One of the key systems in which planetary mass-loss can be studied to date is HD 209458. In fact, the G0 dwarf HD 209458 is one of the optically brightest stars known to host a transiting hot Jupiter, which orbits the star every d at a distance of about AU (Charbonneau et al., 2000; Henry et al., 2000). HD 209458 b was among the first planets for which mass-loss was detected by means of enhanced in-transit absorption in the Ly line (Vidal-Madjar et al., 2003). Subsequently, further elements such as oxygen and carbon were reported in the planetary wind (Vidal-Madjar et al., 2004).
The distance to the HD 209458 system was determined by GAIA to be pc (DR1, Gaia Collaboration et al., 2016a, b). Using hydrogen Lyman line observations, Wood et al. (2005) determined an interstellar H i column density of cm-2 toward HD 209458. The star is slightly larger than the Sun ( R⊙, Boyajian et al., 2015; del Burgo & Allende Prieto, 2016), shows solar iron abundance (, Santos et al., 2004), and is a bona-fide single (Raghavan et al., 2006; Daemgen et al., 2009).
According to its projected rotation velocity, the rotation period of HD 209458 is d, assuming the system is aligned, which is consistent with measurements of the Rossiter-McLaughlin effect (Winn et al., 2005). Silva-Valio (2008) favor a somewhat shorter rotation period of d based on in-transit starspot observations. According to Bonfanti et al. (2016), the age of HD 209458 is about Gyr, i.e., essentially the age of the Sun. Yet, age estimates for HD 209458 differ widely from around 2 Gyr, determined by Maxted et al. (2015) using gyrochronology and isochrones, to Gyr as reported by Boyajian et al. (2015) based on evolutionary modeling, however, with a large uncertainty of nearly 3 Gyr.
Although HD 209458 rotates at about twice the solar rate, it is a rather inactive star. Henry et al. (2000) report a value of . Between 2004 and the end of 2009, HD 209458 was observed in the context of the California Planet Search (Isaacson & Fischer, 2010). During this period, the star showed a continuously low activity level with values ranging between and , i.e., it remained close to the minimum solar activity level of (Mamajek & Hillenbrand, 2008). This is also consistent with the value of reported by Knutson et al. (2010). From the coadded spectrum obtained between Aug. 2013 and Aug. 2014 by the TIGRE telescope (Mittag et al., 2011; Schmitt et al., 2014), we measured a Mount-Wilson S-index of (e.g., Mittag et al., 2016). Applying the calibration by Noyes et al. (1984), this value can be converted into , comparable to the previously determined values.
Despite its critical role in planetary mass loss, the X-ray spectrum and luminosity of HD 209458 remain controversial. Sanz-Forcada et al. (2011) determined an upper limit of erg s-1 for the X-ray luminosity of HD 209458 ( keV band), using XMM-Newton data and assuming a coronal temperature of 2 MK. The 3XMM catalog lists fluxes for a source with a position about two arcseconds from that of HD 209458 (Rosen et al., 2016). Adopting the distance of HD 209458, the reported flux yields an X-ray source with a luminosity of erg s-1 in the keV band (Louden et al., 2016). The reconstruction of the differential emission measure presented by Louden et al. (2016) yields an X-ray luminosity of erg s-1 in the keV band. The authors used the 3XMM catalog fluxes to constrain their model. According to their analysis, the mass-loss rate of the planet HD 209458 b is g s-1.
Notably, all above estimates of the soft X-ray flux are fully or partly based on the available XMM-Newton data, which suffer from considerable background contamination, complicating the analysis of a weak and soft source like HD 209458. Therefore, we obtained a new Chandra HRC-I observation to constrain the soft X-ray flux of HD 209458 more stringently.
2 Data analysis
We carry out a detailed analysis of our new Chandra HRC-I data, the available archival XMM-Newton observations and, finally, present a combined analysis of both data sets.
2.1 Chandra HRC-I data
Chandra observed HD 209458 on June 17, 2016, for ks using the HRC-I (observation ID 16667). Our analysis is based on the pipeline-produced event files and CIAO in version 4.8. While the HRC-I does not provide any notable energy resolution111See, e.g., the report “Spectral Response of the HRC-I” by V. Kashyap and J. Posson-Brown at http://cxc.cfa.harvard.edu/ccr/proceedings/05_proc/presentations/kashyap2/, its sensitivity extends to photon energies of eV, which allows to study soft X-ray sources. In Fig. 1, we show the HRC-I image of the surroundings of HD 209458.
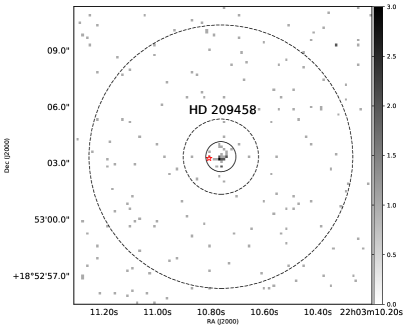
We identify a clear X-ray source close to the nominal position of HD 209458 (see Fig. 1). As our source region, we use a circle with a radius of also indicated in Fig. 1. Using the CIAO task psffrac, we estimate that this region contains % of the photons with an energy of eV. We first center the source region on the visual position of the source and then refine the position by determining the centroid of the photon distribution (see Table 1). In the final source region, a total of counts are recorded.
The centroid position of the X-ray source is offset by toward the west with respect to the proper-motion corrected optical position of HD 209458 determined by GAIA (DR1, Gaia Collaboration et al., 2016a, b). This offset is within the accuracy range of the Chandra aspect solution222http://cxc.harvard.edu/proposer/POG/html/chap5.html, so we are confident that the X-ray source is associated with the bright star HD 209458 (see also Sect. 2.1.1).
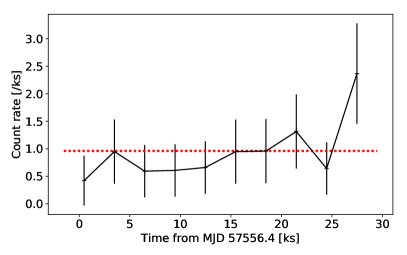
We estimate background counts in the source region by considering an annulus with the same centroid and limiting radii of and . Given the exposure time of ks, this yields a net source count rate of cts ks-1. The HRC-I light curve of HD 209458 shows no obvious variability such as a flare and is compatible with a constant flux (see Fig. 2).
2.1.1 Refinement of HRC-I astrometry
| Source | RA [deg] | Dec [deg] |
| HD 209458 | ||
| HRC-I | 330.794845 | 18.884262 |
| GAIA (2015) | 330.795018 | 18.884244 |
| Reference source | ||
| HRC-I | 330.801708 | 18.943287 |
| USNO-B1 | 330.801887 | 18.943328 |
The closest reference X-ray source with respect to the image center we could identify, using the celldetect algorithm, is located 3.6 0 nearly due north of HD 209458. –¿ The closest reference X-ray source is located 3.6’ nearly due north of HD 209458. (Verschachtelter Satzbau)
Although we are confident that the small positional offset between the X-ray source and the optical position of HD 209458 is instrumental, this can be validated by finding other X-ray sources in the field with known optical counterparts. The closest reference X-ray source we could identify, using the celldetect algorithm, is located nearly due north of HD 209458. The centroid position of the source with about registered net counts, corresponds to a faint red object in the USNO-B1 catalog (source ID 089-0583168, R mag, Monet et al., 2003). This source is located nearly due east of the X-ray position, which supports the contention that the offset seen for HD 209458 is in fact due to a slight error in the aspect solution.
2.2 XMM-Newton data
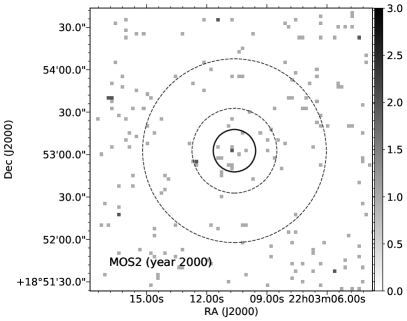
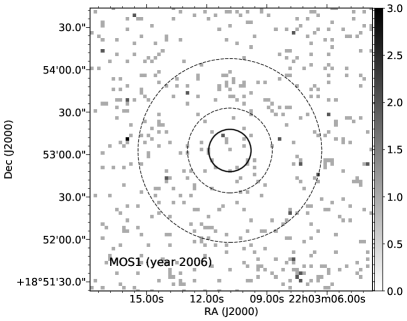
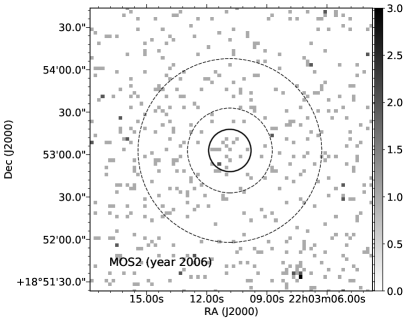
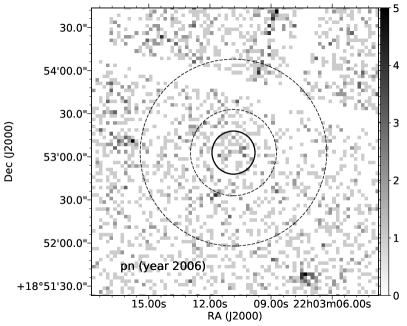
XMM-Newton observed HD 209458 in the years 2000 and 2006 (see Table 2 for details)333An additional observation in 2003 (Obs. ID 0148200101) is not scientifically usable because of a filter-wheel failure.. In the year 2000 observation, optical loading caused by the use of the thin filter, leaves only the MOS2 data usable for our analysis.
We reduced the data using the Scientific Analysis System (SAS) in version 16.0.0444“Users Guide to the XMM-Newton Science Analysis System”, Issue 12.0, 2016 (ESA: XMM-Newton SOC).. In the reduction, we used standard reduction recipes. We used the epreject task to improve the pn energy scale particularly at low photons energies. The high-energy background of the observations is well behaved with only the 2006 pn observation showing a weak, approximately 2 ks long background flare, which is excluded from our analysis.
| Obs. ID/ | Camera | Filter | Duration | Livetime |
|---|---|---|---|---|
| Date | [ks] | [ks] | ||
| 0130920101 | MOS1 | thina𝑎aa𝑎aCorrupted by optical loading. | 17.3 | |
| 2000-Nov-29 | MOS2 | thick | 18.1 | 16.2 |
| pn | thina𝑎aa𝑎aCorrupted by optical loading. | 16.4 | ||
| 0404450101 | MOS1 | medium | 33.3 | 32.8 |
| 2006-Nov-14 | MOS2 | medium | 33.3 | 32.8 |
| pn | medium | 31.6 | 26.4 |
2.2.1 Detection experiment
To test whether X-ray emission of HD 209458 can be detected in the XMM-Newton data, we carried out a detection experiment. For all scientifically usable exposures, we defined a circular source region with a radius of 15″, centered on the source position as determined from the Optical Monitor images; none of these is more than from the nominal optical position. We then extracted the counts in these source regions in a soft ( keV) and a hard spectral band ( keV), which together comprise the bulk of X-ray emission from rather inactive stars such as HD 209458, detectable with XMM-Newton’s EPIC instruments. While no emission at higher photon energies is expected, there may be substantial emission at lower energies, not covered by XMM-Newton.
After visual inspection of the X-ray images, we defined an annulus-shaped background region with an inner radius of ″ and an outer radius of ″ (see Fig. 3). This background region does not cover obvious X-ray sources in the vicinity of HD 209458; also the Chandra HRC-I image does not show any sources in this region (see Sect. 2.1.1). Only for the 2006 pn observation, the background annulus covers the chip edges, which does not appear to introduce any particular artifacts. Generally, the background in the vicinity of HD 209458 seems to be inhomogeneous so that differently placed circular reference regions yield different rates. Ignorant of the actual source-region background, we consider the annulus to yield an appropriate estimate. The detected source and background counts in the soft and hard band are listed in Table 3. Along with these numbers we list the number of net counts, , calculated according to
| (1) |
where and are the number of photons detected in the source and background region and the ratio of their areas. Of course, negative values are not physically admissible, and a more stringent statistical treatment is applied in Sect. 3.
| Instr. | Band | SRC | BGA | Net counts |
|---|---|---|---|---|
| Year 2000 | ||||
| MOS2 | soft | 3 | 18 | |
| MOS2 | hard | 8 | 18 | |
| Year 2006 | ||||
| MOS1 | soft | 8 | 52 | |
| MOS2 | soft | 13 | 42 | |
| pn | soft | 44 | 312 | |
| MOS1 | hard | 4 | 87 | |
| MOS2 | hard | 3 | 93 | |
| pn | hard | 16 | 183 | |
In the soft band, all individual observations yield a surplus of events in the source region compared to the background. While not overly significant individually, all soft-band results may be combined to yield a total of counts, which yields a significant detection in the soft band. In the year 2000 MOS2 observation, we even find a slightly larger excess in the hard band than in the soft band, which is not the case for the year 2006 observations, where only the pn yields a marginally positive net count rate in the hard band.
2.3 EPIC pn spectral analysis for year 2006
The year 2006 observation by XMM-Newton’s pn camera provides sufficient photons for a coarse spectral analysis, which we carried out using XSPEC (version 12.9.1, Arnaud, 1996). In Fig. 4, we show the pn spectrum along with the best-fit one-temperature thermal APEC model (Foster et al., 2012). In the modeling, the interstellar hydrogen column density remained fixed at the value of cm-2 determined by Wood et al. (2005) and the metallicity is taken to be solar.
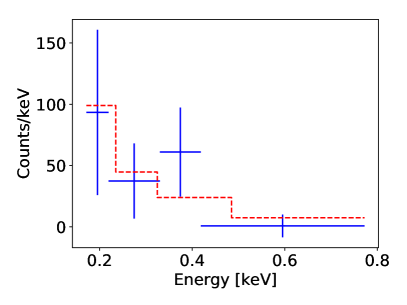
The model yields a best-fit temperature of keV with the error indicating the % confidence limits. The best-fit emission measure is cm-3, which remains rather loosely constrained. In fact, the % confidence limit only provides an upper limit of cm-3, which is essentially due to a degeneracy between temperature and emission measure in this range.
3 Combined HRC-I and XMM-Newton analysis
At our disposal we find a rather heterogeneous data set. A total of three observational epochs in the years 2000, 2006, and 2016 are available, and the data of no two epochs were obtained with the same instrumental setup.
While the Chandra HRC-I observation yields a clear detection of the X-ray emission, it provides no spectral resolution in itself. The latter can be provided by XMM-Newton, the observations of which however, suffer from comparably high background contamination, allowing only a detection of somewhat debatable quality. Nonetheless, all observations provide information on the X-ray emission of HD 209458.
Therefore, we carry out a combined analysis of all three observational epochs. Although we are aware that also the X-ray emission of inactive stars like HD 209458 and the Sun can change considerably on the timescale of years (e.g., Peres et al., 2000; Robrade et al., 2012; Ayres, 2014), the hypothesis in the following will be that all observations shall be explained by the same physical model with identical coronal properties. Specifically, we assume an absorbed, single-temperature thermal APEC model with the interstellar absorption column fixed to the known value. Thus, we end up with two free parameters, viz., the plasma temperature, , and the emission measure, . Besides spectral variability, the cross-calibration of the instruments introduces an additional uncertainty (e.g., Poppenhäger et al., 2009; Robrade et al., 2012).
We proceed by using PyXSPEC to derive model count rates as a function of plasma temperature and emission measure for all available observations and the soft and hard spectral bands. The corresponding response files and auxiliary response files were obtained using CIAO and SAS routines, respectively.
We use the source and background counts obtained for the Chandra HRC-I (Sect. 2.1) and the rates obtained for XMM-Newton in the soft and hard spectral bands (Table 3). Assuming uniform priors on the emission measure () and plasma temperature, , our posterior reads
| (2) |
where the index is meant to run over all observations and the soft and hard spectral bands with the exception of the HRC-I observation, where no spectral information is available. By , we refer to the model source count rate as a function of emission measure and temperature and and denote the number of photons detected in the source and background region referred to by the observation and spectral band indicated by . We use an inverse-rate prior on the background rate (, Jaynes, 1968). The factor is the area scaling between source and background and summarizes all information used in the posterior.
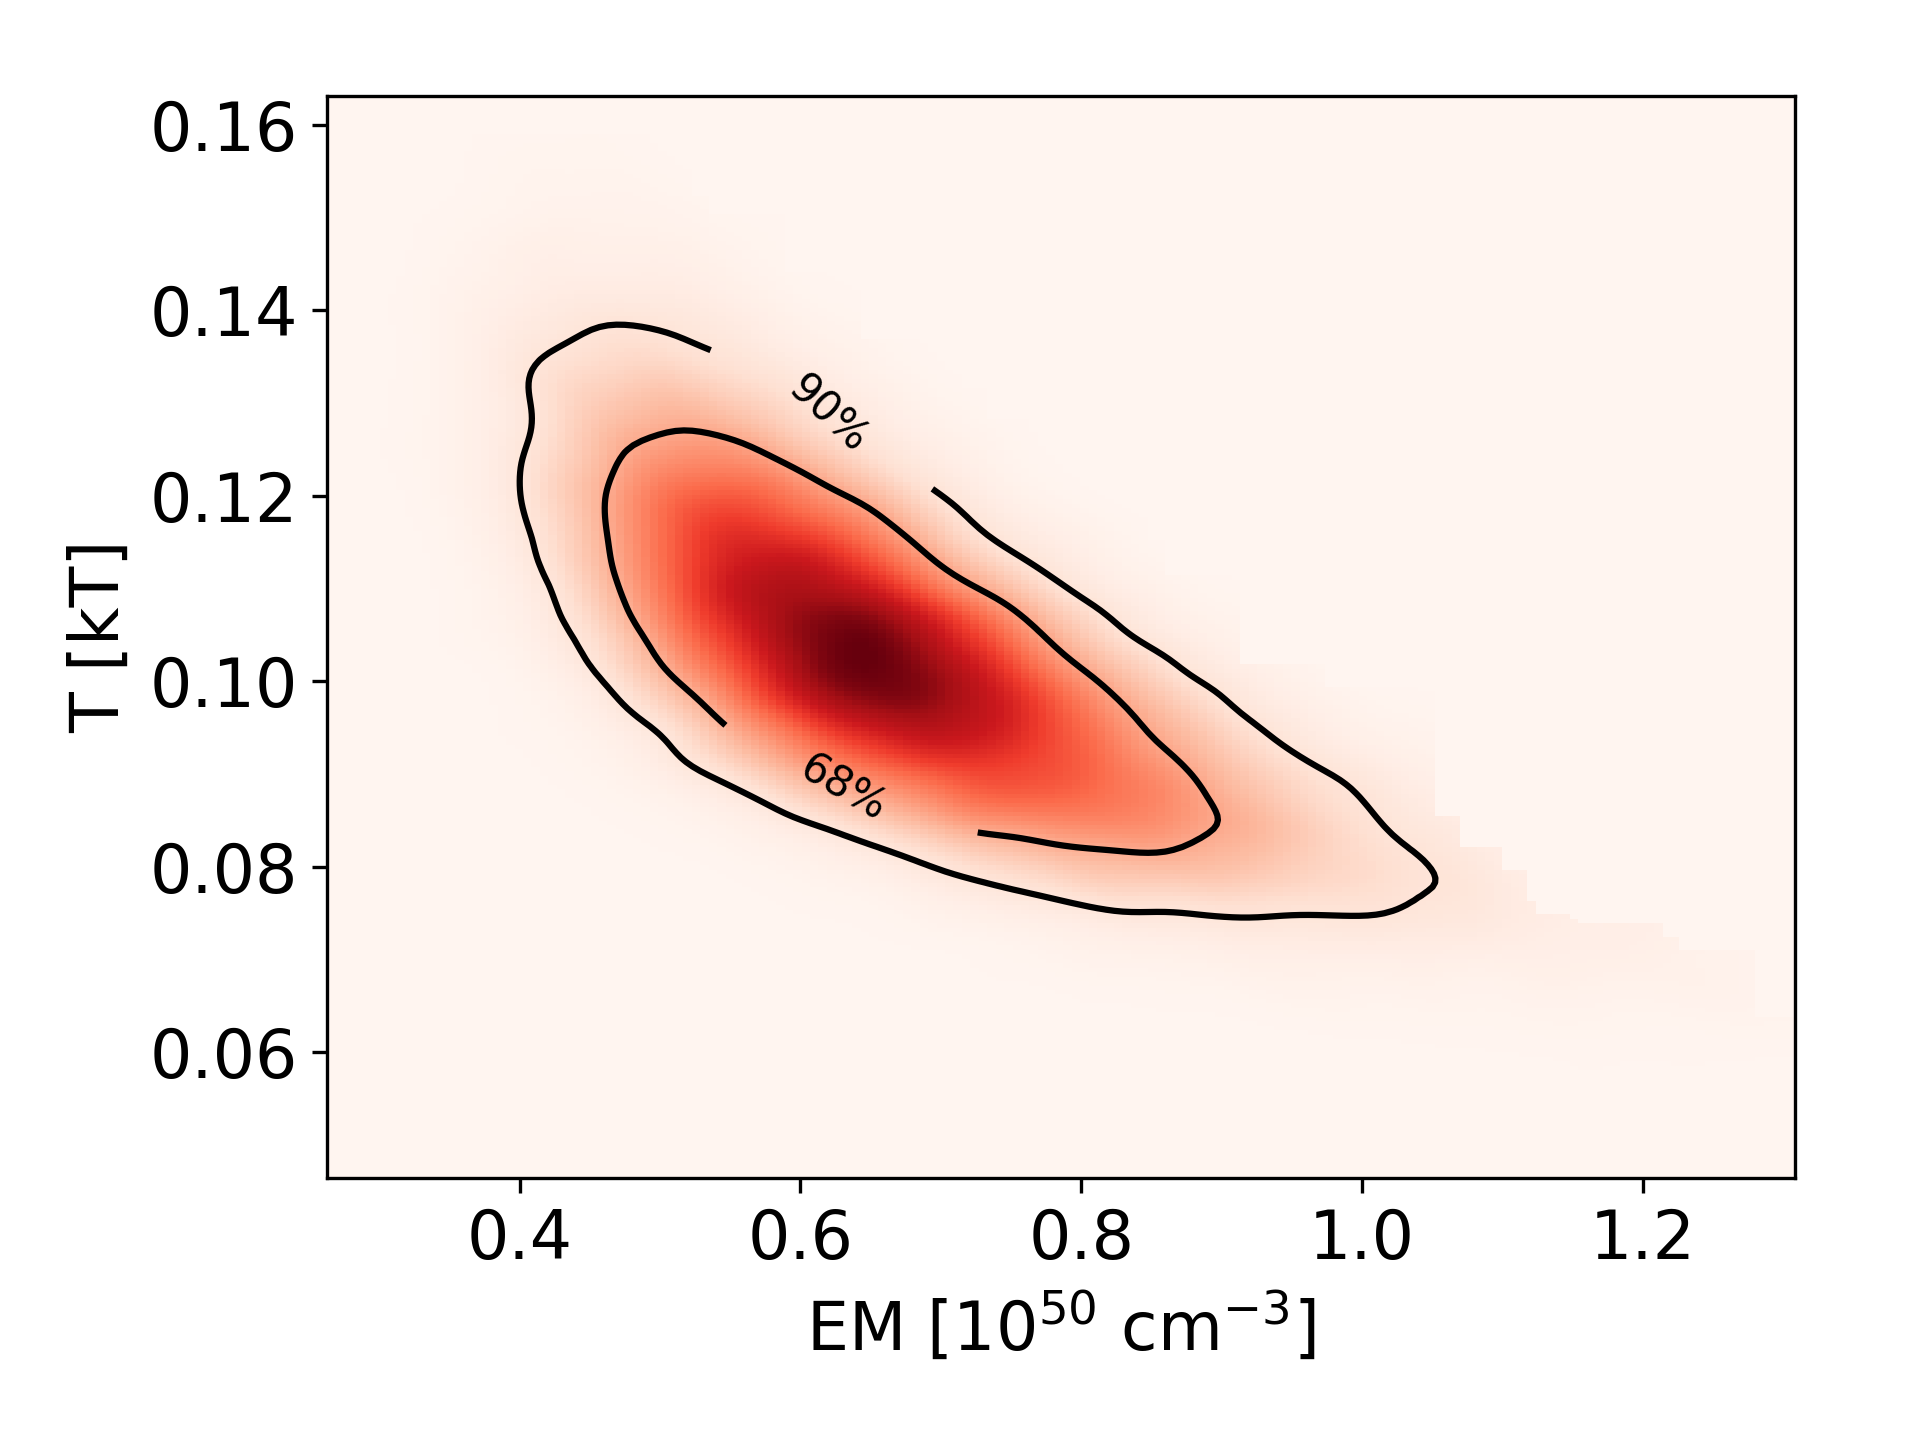
In Fig. 5 we show the posterior density along with the % and % highest probability density credibility regions. The marginal distributions yield a temperature estimate of keV (or ) and an emission measure of cm-3, which corresponds to an X-ray luminosity of erg s-1 in the Å band. In the keV band considered by Louden et al. (2016), we obtain an X-ray luminosity of erg s-1, consistent with their results. In this band, the level of irradiation at the distance of the planet is erg cm-2 s-1.
3.1 Variability
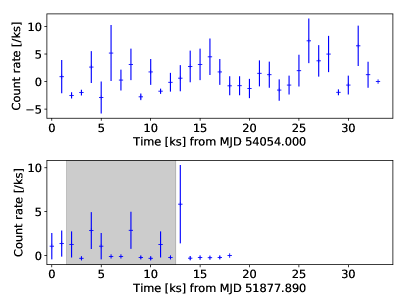
Neither the Chandra HRC-I nor XMM-Newton observations show significant short-term variability such as a flaring (see Sect. 2.1 and Fig. 6). The year 2000 XMM-Newton observation covers a planetary transit, which remains without noticeable effect due to the low count rate. Nonetheless, the X-ray emission of HD 209458 may be variable on the timescales of years. In Table 4, we show the expected number of source counts along with the % credibility limits derived from the combined analysis of the observations; for convenience and reference, the estimated net counts are reproduced.
| Instr. | Band | Net counts | Model counts |
| Year 2000 (XMM-Newton) | |||
| MOS2 | soft | 1.17 (0.8,1.6) | |
| MOS2 | hard | 0.4 (0.1,0.6) | |
| Year 2006 (XMM-Newton) | |||
| MOS1 | soft | 3.2 (2.1, 4.3) | |
| MOS2 | soft | 3.5 (2.4, 4.6) | |
| pn | soft | 23.8 (16.6, 31) | |
| MOS1 | hard | 1 (0.2, 1.8) | |
| MOS2 | hard | 1 (0.2, 1.9) | |
| pn | hard | 5.8 (1.2,10.5) | |
| Year 2016 (Chandra) | |||
| HRC-I | 29.4 (20.8, 37.7) | ||
While we generally find good agreement, the year 2000 observation with XMM-Newton’s MOS2 shows a conspicuous excess of hard-band photons, which is not seen during the year 2006 observation and not accounted for by the model. This may, indeed, indicate a change in the coronal state of HD 209458 between the years 2000 and 2006. In the year 2000 observation, a hotter component may have been present similar to the maximum state of the Sun. However, we consider the supporting evidence too slim to draw a firm conclusion.
4 Comparison to other stars
According to Schmitt (1997), the minimum stellar X-ray surface flux of F, G, and K type stars in the solar vicinity is erg cm-2 s-1. For HD 209458 this translates into a minimum X-ray luminosity of erg s-1 in the ROSAT band, which is comparable to the value found in our analysis. Therefore, the activity level of HD 209458 is certainly at the lower end of the observed range. To check whether it may even be exceptional, e.g., due to its hot Jupiter, we now put the X-ray emission of HD 209458 in the context of other low-activity stars.
4.1 The Centauri system
The Centauri system consists of a G2 V A component, a K1 V B component, and the red dwarf Proxima Centauri, orbiting the AB system in a wide orbit. With an age of Gyr, the system is older than HD 209458 (Eggenberger et al., 2004). The A and B components have extensively been monitored using XMM-Newton (Robrade et al., 2012) and the Chandra HRC-I. A detailed analysis of the Chandra data was presented by Ayres (2014). Specifically, the problem of obtaining factors to convert HRC-I count rates into energy fluxes has been discussed by the author.
According to Ayres (2014), the B component shows an yr solar-like coronal activity cycle. The A component may have remained stuck in a Maunder-Minimum-like state until 2005, but appears to show an elevation in activity levels afterward, which may be indicative of a longer coronal cycle.
In the low activity state of Cen A, Ayres (2014) finds that its corona is dominated by plasma at temperatures slightly above MK, which is comparable to our result for HD 209458. The two coronae may therefore, be similar. Although the intrinsic energy resolution of the HRC-I is insufficient for a meaningful spectral analysis, some information on hardness is available. We test whether the HRC-I spectrum of HD 209458 is consistent with that of the Cen sources, by comparing the photon energy distributions as given by the PI666Pulse Invariant channel. To this end, we downloaded the 2005 HRC-I data of Cen from the Chandra archive and extracted the photons corresponding to the Cen A and B components; both are strong HRC-I sources so that background is negligible. In this period, the B component was observed close to its activity maximum, while the activity level of the A component was low. Using a Kolmogorov-Smirnov test, we compared the nominal photon energy distributions of the Cen components with that of HD 209458. The resulting p-values are for the A component and for the B component. The test thus also provides no evidence against the hypothesis that the Cen A in its low-activity state observed in 2005 and HD 209458 show the same HRC-I spectrum.
Using the energy conversion factor provided by Ayres (2014) (Eq. 2), we estimate an X-ray luminosity of erg s-1 for HD 209458 in the keV band based on the HRC-I count rate alone. Again, this is entirely consistent with our previous analysis.
Compared to Cen A in 2005, the X-ray luminosity of HD 209458 is about a factor of three higher. Both stars have similar radii of R⊙ and R⊙ and thus surface areas (Kervella et al., 2003; Torres et al., 2008), but Cen A rotates with a period of d, i.e., more slowly than HD 209458 (Bazot et al., 2007). Although this is consistent with a lower activity level, both Cen A and HD 209458 may of course show large, potentially cyclic variation in their coronal X-ray emission. While Chandra’s HRC-I is not well-suited to resolve spectral variations in the coronal emission of HD 209458, changes in its luminosity could well be resolved by future observations.
4.2 51 Peg
Similar to HD 209458, the G5V star 51 Peg also hosts a hot Jupiter (Mayor & Queloz, 1995). This star shows a sufficiently low activity level as to qualify as a Maunder-Minimum candidate (Poppenhäger et al., 2009). Baliunas et al. (1995) present a Mount-Wilson S-index time series of 51 Peg ranging from 1977 to 1991, during which the star remained relatively stable with a mean S-index of . Our more recent measurements with TIGRE yield a consistent S-index of (Mittag et al., 2016), providing no indication for a change in the activity state of 51 Peg.
Poppenhäger et al. (2009) studied the X-ray emission of 51 Peg and, among others, analyzed a Chandra HRC-I pointing. Form their analysis, the authors conclude that the coronal temperature of 51 Peg is MK. Scaling the HRC-I count rate of 51 Peg reported by Poppenhäger et al. (2009) to the distance of HD 209458, we calculate a distance-scaled count rate of ct ks-1. This implies that 51 Peg is less luminous in X-rays than HD 209458 by about a factor of two, which is also consistent with the low coronal temperature derived by Poppenhäger et al. (2009).
4.3 The Sun
Due to a lack of appropriate instrumentation, continuous long-term studies of the broad-band soft solar X-ray emission remain difficult. Peres et al. (2000) studied the Sun as an X-ray star, using data taken by Yohkoh’s soft X-ray telescope (SXT), which remained, however, less sensitive at soft photon energies (Tsuneta et al., 1991), increasing the uncertainty at the soft end of the spectrum.
Peres et al. (2000) simulated solar ROSAT spectra corresponding to the minimum and maximum of the solar cycle. During minimum, they found that the ROSAT spectrum can be fitted with a single 1 MK component with an emission measure of cm-3. In solar maximum, a hotter ( MK) component appears and the cooler 1 MK component increases in emission measure by about on order of magnitude. According to Peres et al. (2000), the solar X-ray luminosity in the ROSAT/PSPC band (here keV) varies between about erg s-1 and erg s-1 between solar minimum and maximum.
These values are quite similar to those we find for HD 209458. According to our combined modeling of all available observations, the stellar corona is characterized by a temperature of around MK and an emission measure of cm-3. The coronal temperature of HD 209458 is thus comparable to that observed during solar minimum, but the emission measure corresponds to a value somewhere between solar minimum and maximum. Only a fraction of this can be attributed to the larger radius, leading to a % increase in the surface area compared to the Sun. During the year 2000 observation, HD 209458 may have shown a more active state perhaps similar to a solar maximum. However, the evidence here presented remains insufficient to draw such a conclusion.
5 Conclusion
We analyzed Chandra HRC-I and XMM-Newton data to determine the X-ray properties of HD 209458. Our HRC-I data unequivocally establish HD 209458 as an X-ray source. From the combined analysis of the available XMM-Newton and Chandra data, we determine a coronal temperature of about MK and and emission measure of cm-3.
With respect to coronal temperature, HD 209458 appears to be comparable to the inactive Sun or Cen A. We find that, in terms of HRC-I count rate, HD 209458 is more luminous than Cen A in its low activity state. However, Cen A and HD 209458 may of course both vary in their luminosity, possibly due to cycles, which can only be studied with long-term monitoring programs. HD 209458 rotates faster than the Sun and Cen A, which favors higher activity levels. This is also consistent with the distance-scaled HRC-I count rate of the Maunder-Minimum candidate 51 Peg being lower than that of HD 209458. It appears, however, that HD 209458 is a faint X-ray emitter with respect to its rotation period of d. The relation between period and X-ray luminosity by Pizzolato et al. (2003), for instance, predicts an X-ray luminosity more than an order of magnitude higher than what we observe. Whether this bears some deeper meaning, is merely a coincidence, or a consequence of the relations being uncertain in this regime cannot be decided with the data at hand.
In short, HD 209458 is an inactive star in coronal X-rays, comparable to the Sun itself. The coronal properties of HD 209458 derived in our analysis are consistent with those used by Louden et al. (2016) in their study and thus, demonstrate that the level of planetary atmospheric irradiation is sufficient to drive planetary evaporation at a rate of a few times g s-1.
Acknowledgements.
We thank the anonymous referee for a knowledgeable and helpful report. This work has made use of data from the European Space Agency (ESA) mission Gaia (http://www.cosmos.esa.int/gaia), processed by the Gaia Data Processing and Analysis Consortium (DPAC, http://www.cosmos.esa.int/web/gaia/dpac/consortium). Funding for the DPAC has been provided by national institutions, in particular the institutions participating in the Gaia Multilateral Agreement. SC and MM acknowledge support by UHH. CS and MS acknowledge funding through DFG.References
- Arnaud (1996) Arnaud, K. A. 1996, in Astronomical Society of the Pacific Conference Series, Vol. 101, Astronomical Data Analysis Software and Systems V, ed. G. H. Jacoby & J. Barnes, 17
- Ayres (2014) Ayres, T. R. 2014, AJ, 147, 59
- Baliunas et al. (1995) Baliunas, S. L., Donahue, R. A., Soon, W. H., et al. 1995, ApJ, 438, 269
- Bazot et al. (2007) Bazot, M., Bouchy, F., Kjeldsen, H., et al. 2007, A&A, 470, 295
- Bonfanti et al. (2016) Bonfanti, A., Ortolani, S., & Nascimbeni, V. 2016, A&A, 585, A5
- Boyajian et al. (2015) Boyajian, T., von Braun, K., Feiden, G. A., et al. 2015, MNRAS, 447, 846
- Charbonneau et al. (2000) Charbonneau, D., Brown, T. M., Latham, D. W., & Mayor, M. 2000, ApJ, 529, L45
- Daemgen et al. (2009) Daemgen, S., Hormuth, F., Brandner, W., et al. 2009, A&A, 498, 567
- del Burgo & Allende Prieto (2016) del Burgo, C. & Allende Prieto, C. 2016, MNRAS, 463, 1400
- Eggenberger et al. (2004) Eggenberger, P., Charbonnel, C., Talon, S., et al. 2004, A&A, 417, 235
- Foster et al. (2012) Foster, A. R., Ji, L., Smith, R. K., & Brickhouse, N. S. 2012, The Astrophysical Journal, 756, 128
- Gaia Collaboration et al. (2016a) Gaia Collaboration, Brown, A. G. A., Vallenari, A., et al. 2016a, A&A, 595, A2
- Gaia Collaboration et al. (2016b) Gaia Collaboration, Prusti, T., de Bruijne, J. H. J., et al. 2016b, A&A, 595, A1
- Henry et al. (2000) Henry, G. W., Marcy, G. W., Butler, R. P., & Vogt, S. S. 2000, ApJ, 529, L41
- Isaacson & Fischer (2010) Isaacson, H. & Fischer, D. 2010, ApJ, 725, 875
- Jaynes (1968) Jaynes, E. T. 1968, IEEE Transactions on Systems Science and Cybernetics, 4, 227
- Kervella et al. (2003) Kervella, P., Thévenin, F., Ségransan, D., et al. 2003, A&A, 404, 1087
- Knutson et al. (2010) Knutson, H. A., Howard, A. W., & Isaacson, H. 2010, ApJ, 720, 1569
- Louden et al. (2016) Louden, T., Wheatley, P. J., & Briggs, K. 2016, ArXiv e-prints [arXiv:1605.07987]
- Mamajek & Hillenbrand (2008) Mamajek, E. E. & Hillenbrand, L. A. 2008, ApJ, 687, 1264
- Maxted et al. (2015) Maxted, P. F. L., Serenelli, A. M., & Southworth, J. 2015, A&A, 577, A90
- Mayor & Queloz (1995) Mayor, M. & Queloz, D. 1995, Nature, 378, 355
- Mittag et al. (2011) Mittag, M., Hempelmann, A., González-Pérez, J. N., Schmitt, J. H. M. M., & Hall, J. C. 2011, in Astronomical Society of the Pacific Conference Series, Vol. 448, 16th Cambridge Workshop on Cool Stars, Stellar Systems, and the Sun, ed. C. Johns-Krull, M. K. Browning, & A. A. West, 1187
- Mittag et al. (2016) Mittag, M., Schröder, K.-P., Hempelmann, A., González-Pérez, J. N., & Schmitt, J. H. M. M. 2016, A&A, 591, A89
- Monet et al. (2003) Monet, D. G., Levine, S. E., Canzian, B., et al. 2003, AJ, 125, 984
- Noyes et al. (1984) Noyes, R. W., Hartmann, L. W., Baliunas, S. L., Duncan, D. K., & Vaughan, A. H. 1984, ApJ, 279, 763
- Peres et al. (2000) Peres, G., Orlando, S., Reale, F., Rosner, R., & Hudson, H. 2000, ApJ, 528, 537
- Pizzolato et al. (2003) Pizzolato, N., Maggio, A., Micela, G., Sciortino, S., & Ventura, P. 2003, A&A, 397, 147
- Poppenhäger et al. (2009) Poppenhäger, K., Robrade, J., Schmitt, J. H. M. M., & Hall, J. C. 2009, A&A, 508, 1417
- Raghavan et al. (2006) Raghavan, D., Henry, T. J., Mason, B. D., et al. 2006, ApJ, 646, 523
- Robrade et al. (2012) Robrade, J., Schmitt, J. H. M. M., & Favata, F. 2012, A&A, 543, A84
- Rosen et al. (2016) Rosen, S. R., Webb, N. A., Watson, M. G., et al. 2016, A&A, 590, A1
- Salz et al. (2016a) Salz, M., Czesla, S., Schneider, P. C., & Schmitt, J. H. M. M. 2016a, A&A, 586, A75
- Salz et al. (2016b) Salz, M., Schneider, P. C., Czesla, S., & Schmitt, J. H. M. M. 2016b, A&A, 585, L2
- Santos et al. (2004) Santos, N. C., Israelian, G., & Mayor, M. 2004, A&A, 415, 1153
- Sanz-Forcada et al. (2011) Sanz-Forcada, J., Micela, G., Ribas, I., et al. 2011, A&A, 532, A6
- Sanz-Forcada et al. (2010) Sanz-Forcada, J., Ribas, I., Micela, G., et al. 2010, A&A, 511, L8
- Schmitt (1997) Schmitt, J. H. M. M. 1997, A&A, 318, 215
- Schmitt et al. (2014) Schmitt, J. H. M. M., Schröder, K.-P., Rauw, G., et al. 2014, Astronomische Nachrichten, 335, 787
- Silva-Valio (2008) Silva-Valio, A. 2008, ApJ, 683, L179
- Torres et al. (2008) Torres, G., Winn, J. N., & Holman, M. J. 2008, ApJ, 677, 1324
- Tsuneta et al. (1991) Tsuneta, S., Acton, L., Bruner, M., et al. 1991, Sol. Phys., 136, 37
- Vidal-Madjar et al. (2004) Vidal-Madjar, A., Désert, J.-M., Lecavelier des Etangs, A., et al. 2004, ApJ, 604, L69
- Vidal-Madjar et al. (2003) Vidal-Madjar, A., Lecavelier des Etangs, A., Désert, J.-M., et al. 2003, Nature, 422, 143
- Winn et al. (2005) Winn, J. N., Noyes, R. W., Holman, M. J., et al. 2005, The Astrophysical Journal, 631, 1215
- Wood et al. (2005) Wood, B. E., Redfield, S., Linsky, J. L., Müller, H.-R., & Zank, G. P. 2005, ApJS, 159, 118