Dark matter dynamics in Abell 3827:
new data consistent with standard Cold Dark Matter
Abstract
We present integral field spectroscopy of galaxy cluster Abell 3827, using ALMA and VLT/MUSE. It reveals an unusual configuration of strong gravitational lensing in the cluster core, with at least seven lensed images of a single background spiral galaxy. Lens modelling based on HST imaging had suggested that the dark matter associated with one of the cluster’s central galaxies may be offset. The new spectroscopic data enable better subtraction of foreground light, and better identification of multiple background images. The inferred distribution of dark matter is consistent with being centered on the galaxies, as expected by CDM. Each galaxy’s dark matter also appears to be symmetric. Whilst we do not find an offset between mass and light (suggestive of self-interacting dark matter) as previously reported, the numerical simulations that have been performed to calibrate Abell 3827 indicate that offsets and asymmetry are still worth looking for in collisions with particular geometries. Meanwhile, ALMA proves exceptionally useful for strong lens image identifications.
keywords:
dark matter — astroparticle physics — galaxies: clusters: individual: Abell 3827 — gravitational lensing: strong1 Introduction
Determining the properties of dark matter has become a priority of astrophysics and particle physics. In the standard CDM cosmological model, dark matter has significant interactions with standard model particles through only the gravitational force (e.g. Massey, Kitching & Richard, 2010; Kneib & Natarajan, 2011). It therefore neither emits nor absorbs light, and appears invisible. Nonetheless, over the course of cosmic history, dark matter’s gravitational attraction assembled the Universe’s large-scale structure, and governed the evolution of galaxies. Dark matter has pulled together both ordinary and dark material into a series of collisions – then eventual mergers – between ever-larger structures (Vogelsberger et al., 2014; Schaye et al., 2015).
Several particle physics theories of dark matter predict additional forces between dark matter particles, hidden entirely within the dark sector (Peter et al., 2012; Cyr-Racine & Sigurdson, 2013). The most direct way to measure these hypothesised forces is to observe the trajectory of dark matter during collisions with other dark matter. In effect, astrophysical mergers can be treated as enormous particle colliders (Clowe et al., 2004, 2006; Bradač et al., 2008; Merten et al., 2011; Clowe et al., 2012; Dawson et al., 2012; Gastaldello et al., 2014; Chon & Böhringer, 2015; Ng et al., 2015; Harvey et al., 2015; Jee et al., 2016; Golovich et al., 2016, 2017; Kim, Peter & Wittman, 2017; Monteiro-Oliveira et al., 2017). In simulated mergers assuming CDM, the (non-interacting) dark matter remains tightly bound near stars (Schaller et al., 2015). If dark-sector forces exist, simulations of mergers predict dark matter to temporarily lag behind stars, which serve as collisionless test particles (Randall et al., 2008; Massey, Kitching & Nagai, 2011; Dawson et al., 2013; Harvey et al., 2014; Kahlhoefer et al., 2014; Robertson et al., 2017a, b). In some simulations, the distribution of dark matter is also stretched into asymmetric tails (Kahlhoefer et al., 2014).
Two properties of galaxy cluster Abell 3827 (RA=h , Dec= , =0.099, De Plaa et al. 2007; Carrasco et al. 2010; Williams & Saha 2011), make it uniquely interesting for studies of dark matter dynamics. First, the cluster core contains four similarly-bright galaxies. They must be undergoing a simultaneous, high speed merger, because this amount of substructure is unique: most clusters have reached a steady state with only a single Brightest Central Galaxy. Second, directly behind the cluster core lies a spiral galaxy (; Massey et al. 2015) that is rich in morphological structure. The background spiral galaxy has been gravitationally lensed by the cluster, and its multiple images wrap around all four of the central galaxies. These images can be used to infer the spatial distribution of (dark plus stellar) mass in the cluster and its galaxies.
One of Abell 3827’s central galaxies lies very close to a set of gravitationally lensed images, so the distribution of its mass is particularly well constrained. Analysis of the gravitational lensing in optical imaging suggested that this galaxy’s dark matter is offset by kpc from its stars (Massey et al., 2015), and possibly asymmetric (Taylor et al., 2017). This could have been caused by a dark sector force with interaction cross-section cm2/g, where is the (unknown) mass of the dark matter particle (Kahlhoefer et al., 2015). The most difficult part of this analysis was the identification of features in the faint, background spiral, right next to a very bright foreground galaxy (see Appendix B in Massey et al. 2015).
In this paper, we present new Integral Field Unit (i.e. 2D) spectroscopy of Abell 3827 at near-IR and millimetre wavelengths: where the foreground cluster is faint, but the background spiral galaxy remains bright. We describe the new data in section 2. We describe our analysis techniques in section 3, and reconstruct the spatial distribution of dark matter in section 4. We discuss the consequences of our results in section 5. Throughout this paper, we adopt a cosmological model with , and km/s/Mpc, in which corresponds to kpc at the redshift of the cluster. Adjusting this cosmological model perturbs the inferred physical distances, and the absolute normalisation of inferred masses.
2 Data
2.1 Pre-existing imaging
Broad-band imaging of Abell 3827 has been obtained by the Gemini telescope at optical wavelengths (Carrasco et al., 2010) and by the Hubble Space Telescope (HST; programme GO-12817) in the F336W (UV), F606W and F814W (optical) and F160W (IR) bands (Massey et al., 2015).
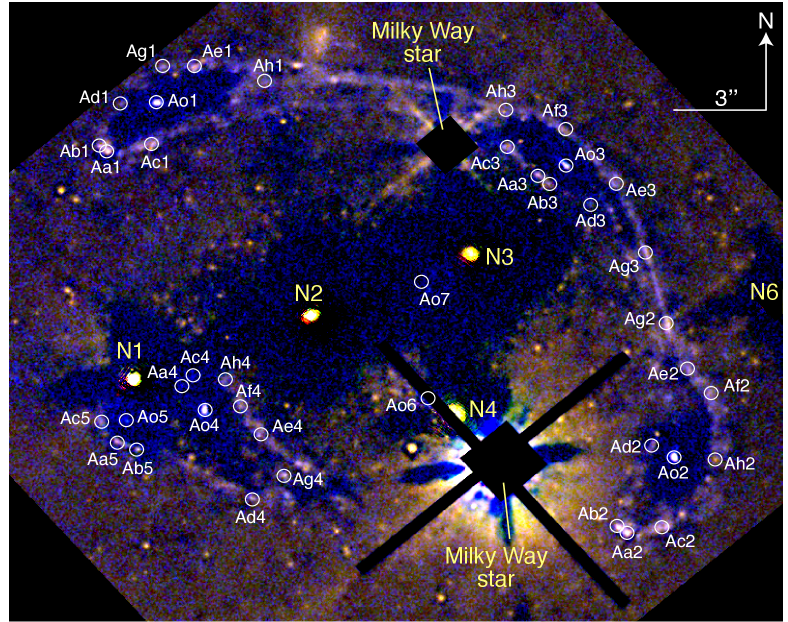
This revealed four similarly-bright elliptical galaxies (N1–N4) within 10 kpc radius, and a background lensed spiral galaxy (with a red bulge and blue spiral arms), whose multiple images are threaded throughout the cluster core. In this paper, we exclusively use the HST imaging. As described in Taylor et al. (2017), we reveal the background lensed galaxy by fitting and subtracting foreground emission from the five brightest cluster galaxies and two Milky Way stars using the MuSCADeT method (Joseph, Courbin & Starck, 2016) (figure 1).
2.2 ALMA integral field spectroscopy

In October 2016, we obtained a 5.2 hour observation of Abell 3827 with the Atacama Large Millimetre Array (ALMA; programme 2016.1.01201.S). The band 3 data sample frequencies - GHz and - GHz with spectral resolution MHz ( km/s). Observations were conducted with 44 12 m antennae in the C40-6 configuration. Flux and bandpass calibration were obtained from J20564714, and the phase calibrator was J22086325.
Data were reduced using casa software v4.7.2 (McMullin et al., 2007). Spectral data cubes were created using the clean algorithm, with channel averaging and natural weighting to maximise sensitivity. This yielded a synthesised beam of , and a noise level of 0.08 mJy/beam for each MHz channel. In addition, to minimise potential extended flux being resolved out, we created a second spectral cube with a taper applied that yielded a synthesised beam of 0.87 0.82′′ and noise level of 0.15 mJy/beam.
The background galaxy is visible in emission from the GHz CO(2-1) transition, redshifted to GHz (figure 2). However, the emission is fainter than expected from an extrapolation of near-IR emission (a somewhat indirect chain using [Oii] emission to estimate star formation rate and hence far-infrared luminosity, then using the Solomon & Vanden Bout 2005 relation to predict CO luminosity). Our exposure time was therefore only just sufficient to detect spatial structure in the line emission; no continuum emission is detected beneath the foregrounds.
2.3 VLT/MUSE integral field spectroscopy
In June 2016, we obtained a hour integration of Abell 3827 using the Multi-Unit Spectroscopic Explorer (MUSE) Integral Field Unit (IFU) spectrograph (Bacon et al., 2010) on the European Southern Observatory (ESO) Very Large Telescope (VLT). We combined these data (programme 295.A-5018) with a pre-existing hour exposure from programme 294.A-5014. All the observations were obtained in dark time, with -band seeing better than ″and good atmospheric transparency. The data sample wavelengths - nm with nm binning and spectral resolution at the red end.
Data were reduced using v1.0 of the esorex pipeline, which extracts the spectra, applies wavelength and flat-field calibration, then forms the data cube. Each hour on sky included minute exposures, dithered by . We aligned the individual exposures by registering the images of stars, then removed cosmic rays and pixel defects, and stacked the exposures using the exp_combine routine. Flux calibration was achieved using ESO standard stars which were reduced in an identical manner.
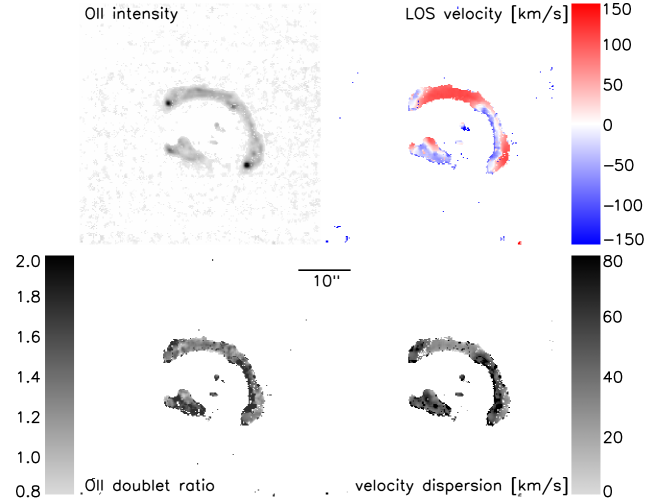
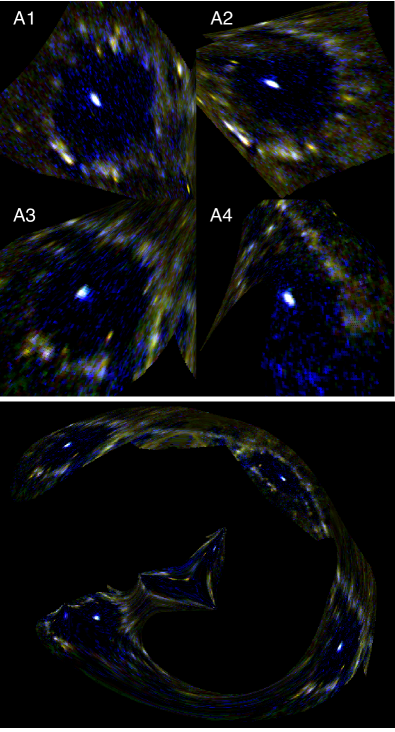
The background galaxy is visible in emission from the [Oii] 3726.8, 3729.2 line doublet, redshifted to 835.5 nm. In each spatial pixel, we model the spectrum of foreground continuum emission as a low-order polynomial either side of nm. We subtract this foreground emission, then integrate the remaining line flux as an [Oii] narrow-band image (figure 3). We also use a two-Gaussian model to fit the [Oii] doublet line ratio (3728.9/3726.2), line-of-sight velocity, and line width. Both components of the line are assumed to have the same width, and the measurement of spectral line width is corrected for instrumental broadening.
3 Analysis
3.1 Strong lens image identifications
The multiply-imaged background source is a spiral galaxy consisting of a red bulge ‘Ao’ inside a blue ring of star formation knots ‘Aa’–‘Ah’. Its rotational support is apparent from the km/s velocity gradient apparent across the galaxy in the MUSE data (and present at low S/N in ALMA data, but not shown in figure 2).
Features in the observed image have been variously identified as multiple versions of the background galaxy’s bulge or star forming regions (Williams & Saha, 2011; Massey et al., 2015; Taylor et al., 2017). Many of these features are deeply embedded within the light from foreground galaxies. After foreground subtraction using galfit (Peng et al., 2010), and based on its apparent colour and morphology, Massey et al. (2015) identified a point-like source immediately south of galaxy N1 as the fifth (sorted by arrival time in the best-fit mass model) multiple image of knot Aa.
Our new data indicate that this identification was incorrect. Our ALMA data show that the feature south of N1 is at the same systemic velocity and similar CO(2-1) flux as the source’s central bulge. The feature’s line-of-sight velocity is also inconsistent with that of star formation knot Aa. Our MUSE data also support a new interpretation that the feature is an additional image of the bulge, which we now call Ao5. This identification of the source’s central bulge implies that images of knots Aa and Ac must be further southeast. The ALMA data is too low S/N to detect them, and the MUSE data have only barely sufficient angular resolution, but candidate features can be seen in HST imaging after our improved foreground subtraction using MuSCADeT (Joseph, Courbin & Starck, 2016). These features were hidden behind the foreground emission from N1, and are fainter than the foreground cluster’s many globular clusters. Indeed, the chain of three or four sources between Ao4 and Ao5 appears to be an unfortunate alignment of foreground globular clusters, confusingly unrelated to the background source.
Building upon this new hypothesis, and incorporating additional features resolved by ALMA and ordered by MUSE, a new set of multiple-image identifications Ao and Aa–h become clear (Table 1). This configuration of multiple image identifications was not amongst those considered in Appendix B of Massey et al. (2015). We shall now demonstrate that this new configuration yields a model of the lens’s mass distribution with higher Bayesian evidence and better consistency with observed lensed image positions.
| Name | RA | Dec |
|---|---|---|
| Ao1 | ||
| Ao2 | ||
| Ao3 | ||
| Ao4 | ||
| Ao5 | ||
| Ao6 | ||
| Ao7 | ||
| Aa1 | ||
| Aa2 | ||
| Aa3 | ||
| Aa4 | ||
| Aa5 | ||
| Ab1 | ||
| Ab2 | ||
| Ab3 | ||
| Ab5 | ||
| Ac1 | ||
| Ac2 | ||
| Ac3 | ||
| Ac4 | ||
| Ac5 | ||
| Ad1 | ||
| Ad2 | ||
| Ad3 | ||
| Ad4 | ||
| Ae1 | ||
| Ae2 | ||
| Ae3 | ||
| Ae4 | ||
| Af2 | ||
| Af3 | ||
| Af4 | ||
| Ag1 | ||
| Ag2 | ||
| Ag3 | ||
| Ag4 | ||
| Ah1 | ||
| Ah2 | ||
| Ah3 | ||
| Ah4 |
3.2 Mass model
To ensure that we can draw robust conclusions, we use two independent algorithms to infer the mass distribution in the lens. Both have been tested in a blind analysis of strong lensing data for which the true mass distribution is known (Meneghetti et al., 2017). First, we use lenstool v6.8.1 (Jullo et al., 2007). Its parametric mass models may not capture all the complexity of a real mass distribution, but it allows quantities of scientific interest (such as the position of dark matter) to be parameterised explicitly and to be fitted directly from data. Second, we use grale (Liesenborgs, De Rijcke & Dejonghe, 2006). This ‘freeform’ method possesses more flexibility to represent a real mass distribution and, by inferring unphysical distributions, to highlight errors in e.g. source image identification. However, interpretation is later required to extract quantities of scientific interest.
3.2.1 LENSTOOL
Our lenstool mass model consists of dark matter in one cluster-scale Pseudo-Isothermal Elliptical Mass Distribution (PIEMD; Limousin et al. 2005; Elíasdóttir et al. 2007), plus the four bright galaxies’ stellar and dark matter with respectively Hernquist and Pseudo-Isothermal Skewed Potential (PISP; Taylor et al. 2017) distributions. A PISP distribution reduces to a PIEMD if its skewness . We also fit a PISP component to the dark matter associated with faint member galaxy N6, but assume it has negligible stellar mass and skewness to reduce parameter space. Including mass associated with galaxies farther from the cluster core yields indistinguishable results but slows the analysis dramatically, so we omit them. Finally, we allow an external shear (e.g. Hogg & Blandford, 1994).
Parameters of the dark matter components are adjusted to reduce the rms of distances between the source galaxy’s predicted and observed positions in the image plane, rmsi. The parameters’ posterior probability distribution function (PDF) is explored by a Markov Chain Monte Carlo (MCMC) iteration, with a constant proposal distribution after a burn-in phase (lenstool’s runmode=3) and priors identical to those in Taylor et al. (2017). For example, the location and amount of each galaxy’s dark matter is given a flat prior either side of its stars. Taylor et al. (2017) reported failed convergence of skewness parameters; this has been solved by a much longer Markov Chain that samples the PDF 100,000 times, and by ensuring that the skewness angle wraps far from any peak in the PDF. We assume statistical uncertainty of 0.5″ on the location of Ao6 and Ao7, which are detected only in ground-based data, and 0.15″ on the location of every other image.
Parameters of the stellar mass components are derived from Galfit fits to flux in the F606W band, with the flux converted into mass via Bruzual & Charlot (2003) models, assuming a Chabrier (2003) initial mass function, solar metallicity, and a single burst of star formation at redshift . These parameters are fixed during the optimisation.
3.2.2 GRALE
Our grale mass model incorporates a grid of approximately 1300 Plummer spheres (Plummer, 1911) in a region centered on (RA: , Dec: ). An iterative procedure adaptively refines the grid in dense regions, and uses a genetic algorithm to adjust the mass in each Plummer sphere. The genetic algorithm optimises the product of (a) the fractional degree of overlap between multiple images of the same source in the source plane and (b) a fitness measure penalising the presence of false counter-images in regions where they are not observed.
We run twenty mass reconstructions with different random seeds. n total, this produces 26786 optimised Plummer spheres. We average the inferred mass distributions; their rms provides an estimate of statistical error.
4 Results
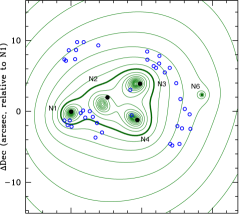
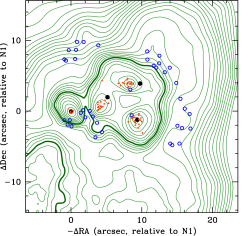
Inferred mass maps are presented in figure 4. Results from lenstool and grale are now more consistent with each other. They also provide a better fit to the data than they were when assuming the source identifications of Massey et al. (2015) (whose lenstool model had rms=). The new parameters of lenstool’s best-fit model are presented in Table 2. This model achieves rms=, or = with degrees of freedom, likelihood log()=, and Bayesian evidence log()=.
| [″] | [″] | Mass [] | [″] | [∘] | [∘] | ||||||||||||||
|---|---|---|---|---|---|---|---|---|---|---|---|---|---|---|---|---|---|---|---|
| [″] | [″] | [km/s] | | ||||||||||||||||
| N1 | stars | [ | ] | [ | ] | [] | [] | [ | ] | [ | ] | ||||||||
| dark matter | [] | [] | |||||||||||||||||
| N2 | stars | [ | ] | [ | ] | [] | [] | [ | ] | [ | ] | ||||||||
| dark matter | [] | [] | |||||||||||||||||
| N3 | stars | [ | ] | [ | ] | [] | [] | [ | ] | [ | ] | ||||||||
| dark matter | [] | [] | |||||||||||||||||
| N4 | stars | [ | ] | [ | ] | [] | [] | [ | ] | [ | ] | ||||||||
| dark matter | [] | [] | |||||||||||||||||
| N6 | stars | [ | ] | [ | ] | [0] | |||||||||||||
| dark matter | [ | ] | [ | ] | [] | [] | [ | ] | [ | ] | [ | ] | [ | ] | |||||
| Cluster | dm | [] | [ | ] | [ | ] | |||||||||||||
Central images Ao6 and Ao7 have split grale’s previous reconstruction of a bimodal cluster (consisting of N1 plus everything else) into four distinct mass concentrations around each galaxy. There is no reason for the genetic algorithm to prefer either, yet the new model is more physical. Adding the central images also creates a prediction (from both lenstool and grale) for a diffuse trail of source emission southwest of Ag4, including counter-images of Ab, Ad, and Ag. These are possibly demagnified and observed, but the whole area is unclear in HST imaging because of the bright foreground star and confusion with globular clusters. Both models predict demagnified images of the star formation knots tightly packed around Ao6, and loosely packed around Ao7, as are visible in MUSE data but with insufficient confidence to be used as input constraints.
Our lenstool analysis suggests a statistical significance for the offset of N1. However, the absolute value of the offset is far smaller than in Massey et al. (2015), and its significance disappears entirely when combining with our grale analysis and allowing for systematic, model-induced biases of up to for this configuration of lenses (Massey et al., 2015). The mass peak reconstructed by grale outside the cluster core imposes an external shear near N1 consistent with that fitted by lenstool.
Statistical errors on the position of dark matter associated with N2, N3 and N4 are tightened by our new detection of central images Ao6 and Ao7. They would be dramatically improved if more of the source galaxy’s structure could be seen in the central images (e.g. with deeper ALMA data). However, the position of N2’s dark matter shows a large scatter in our current grale analysis, and can change in a lenstool analysis if the prior is adjusted on the position of the cluster-scale halo. In the MCMC chain of our lenstool analysis, the positions of N3 and N4 are degenerate with each other. Furthermore, we have an a priori expectation that only N1 is sufficiently close to space-resolution lensed images to be constrained with kiloparsec accuracy (even when the lens identifications are unambiguous Harvey, Kneib & Jauzac 2016, and they may still not all be correct here).
The inferred location of the dark matter associated with each galaxy N1–N4 appears consistent with the location of its stars. Deeper ALMA or HST observations would clarify the status of N2, N3 and N4. However, given various parameter degeneracies in our current analysis, and the potential for systematic errors at a level comparable to their offsets, we cannot here conclude that any offset is physically significant.
The total mass of the dark matter components of galaxies N1–N4 is formally , , and , and that of the cluster-scale halo is (see equation 10 of Limousin et al., 2005). However, these calculations depend approximately linearly on our unconstrained choice of .
De-lensed images of the background galaxy, assuming the best-fit lenstool model, are presented in figure 5; results from grale are similar. It is a ring galaxy reminiscent of the lensed source in Zwicky cluster Cl0024+1654 (Colley, Tyson & Turner, 1996; Jones et al., 2010). Its central component is by far the brightest in CO(2-1) emission. A large reservoir of dusty, molecular gas in a galaxy’s bulge would be unusual at , but not at , when bulges are still forming stars. Assuming lenstool’s best-fit mass model, the luminosity-weighted amplification of its [Oii] emission is , summing over all the images. Taking into account this amplification, its apparent [Oii] luminosity implies an total star-formation rate of /yr, using the Kennicut (1998) calibration and a Chabrier (2003) initial mass function. Canonical dust extinction of about magnitude could raise this by a factor –. Other than its role in gravitational lensing due to its location behind a cluster, it is not an intrinsically unusual galaxy.
5 Conclusions
Previous studies of galaxy cluster Abell 3827 (Williams & Saha, 2011; Massey et al., 2015) imaging suggested that the dark matter associated with at least one of its galaxies is offset from its stars. This is predicted by simulations of self-interacting dark matter in which the exchange particle is light (Harvey et al., 2014; Kahlhoefer et al., 2014; Robertson et al., 2017b). Prompted by this potentially exciting result, further simulations (Kahlhoefer et al., 2015) suggested that the offset could be observable in (rare) systems where a massive galaxy intersects a cluster’s Einstein radius, and its 3D motion happens to be near the plane of the sky. A strongly lensing merger between two field galaxies has shown a similar offset (Shu et al., 2016).
In this paper, ALMA has proved an exceptional tool to identify background lensed images, with high spatial resolution at wavelengths where foreground galaxy clusters are virtually transparent. Whilst there is no guarantee that we have perfected the source identifications in Abell 3827, it is now possible to construct lens models with residuals that are consistent with noise, and robust between very different modelling approaches. The consistency between parametric and non-parametric lens models lends confidence to the conclusions. Indeed, both ALMA data and deviations from physically expected mass distributions in a free-form mass reconstruction could be a powerful discriminator between future source identifications.
Our new analysis shows that there is no statistically significant offset between galaxies and their dark matter in Abell 3827, projected onto the plane of the sky. Galaxy N1 is best constrained. Assuming statistical errors only, its offset in our lenstool model is arcseconds or kpc. Following Kahlhoefer et al. (2015)’s reasoning that any offset requires dark matter self-interactions to balance a gravitational restoring force that can be calculated, this measurement implies an interaction cross-section cm2/g, where is the inclination of the galaxy’s 3D motion with respect to the plane of the sky. That this angle is unknown makes it difficult to infer an upper limit on from this system without further information.
Nonetheless, the unusual configuration of Abell 3827, with four bright central galaxies and a background spiral galaxy with complex morphology is multiply-imaged between them, makes it still interesting for studies of dark matter dynamics. Regardless of possible particle interactions, as a galaxy enters a cluster, its dark matter halo is gradually stripped via tidal gravitational forces. Simulations disagree about the timescale and the orbits on which dark matter stripping occurs in the inner tens of kiloparsecs (Diemand, Kuhlen & Madau, 2007; Peñarrubia, McConnachie & Navarro, 2008; Wetzel, Cohn & White, 2009; Bahé et al., 2012), but this dissipation is a key ingredient in semi-analytic models of galaxy formation (e.g. Dariush et al., 2010). Observations of dark matter mass loss in galaxies entering a galaxy cluster from the field (Mandelbaum et al., 2006; Limousin et al., 2007, 2012; Parker et al., 2007; Natarajan et al., 2009; Gillis et al., 2013; Niemiec et al., 2017) have never been followed inside Mpc, and measurements of strong lensing clusters with multiple central galaxies, like those in table 2, could constrain this for the first time.
Acknowledgments
The authors are grateful for helpful conversations with Jean-Paul Kneib, Subir Sarkar, and Felix Kahlhoefer. RM and TDK are supported by Royal Society University Research Fellowships. Durham authors were also supported by the UK Science and Technology Facilities Council (grant numbers ST/P000541/1, ST/H005234/1, ST/I001573/1 and ST/N001494/1). JL acknowledges the computational resources and services provided by the VSC (Flemish Supercomputer Center), funded by the Research Foundation Flanders (FWO) and the Flemish Government, department EWI. LLRW would like to acknowledge the computational resources of the Minnesota Supercomputing Institute. JM has received funding from the European Union’s FP7 and Horizon 2020 research and innovation programmes under Marie Skłodowska-Curie grant agreement numbers 627288 and 664931.
Facilities: This paper uses ALMA observations ADS/ JAO.ALMA#2016.1.01201.S. ALMA is a partnership of ESO (representing its member states), NSF (USA) and NINS (Japan), together with NRC (Canada), NSC and ASIAA (Taiwan), and KASI (Republic of Korea), in cooperation with the Republic of Chile. The Joint ALMA Observatory is operated by ESO, AUI/NRAO and NAOJ. This paper uses data from observations made with ESO Telescopes at the La Silla Paranal Observatory under programmes 093.A-0237 and 294.A-5014. We thank the Director General for granting discretionary time, and Paranal Science Operations for running the observations. This paper uses data from observations GO-12817 with the NASA/ESA Hubble Space Telescope, obtained at the Space Telescope Science Institute, which is operated by AURA Inc, under NASA contract NAS 5-26555. All data are available from the telescopes’ archives. This paper used the DiRAC Data Centric system at Durham University, operated by the Institute for Computational Cosmology on behalf of the STFC DiRAC HPC Facility (www.dirac.ac.uk). This equipment was funded by BIS National E-infrastructure capital grant ST/K00042X/1, STFC capital grant ST/H008519/1, and STFC DiRAC Operations grant ST/K003267/1 and Durham University. DiRAC is part of the UK National e-Infrastructure.
References
- Bacon et al. (2010) Bacon R. et al. 2010, SPIE 7735, 773508
- Bruzual & Charlot (2003) Bruzual G. & Charlot S., 2003, MNRAS 344, 1000
- Bahé et al. (2012) Bahé Y., McCarthy I., Crain R. & Theuns T. 2012 MNRAS 424, 1179
- Bradač et al. (2008) Bradač M. et al. 2008 ApJ 687, 959
- Carrasco et al. (2010) Carrasco E. et al. 2010 ApJ 715, 160
- Chabrier (2003) Chabrier G. 2003 PASP 115, 763
- Chon & Böhringer (2015) Chon G. & Böhringer H. 2015, A&A 574, 132
- Clowe et al. (2004) Clowe D., Gonzalez A. & Markevitch M. 2004 ApJ 604, 596
- Clowe et al. (2006) Clowe D., Bradač M., Gonzalez A., Markevitch M., Randall S., Jones C. & Zaritsky D. 2006 ApJL 648, 109
- Clowe et al. (2012) Clowe D. Markevitch M., Bradač M., Gonzalez A., Massey R. & Zaritsky D. 2012 ApJ 758, 128
- Colley, Tyson & Turner (1996) Colley W., Tyson J. & Turner E. 1996 ApJL 461, 83
- Cyr-Racine & Sigurdson (2013) Cyr-Racine F.-Y. & Sigurdson K. 2013 PhRvD 87, 3515
- Dariush et al. (2010) Dariush A., Raychaudhury S., Ponman T., Khosroshahi H., Benson A., Bower R. & Pearce F. 2010 MNRAS 405, 1873
- Dawson et al. (2012) Dawson W. et al. 2012 ApJL 747, 42
- Dawson et al. (2013) Dawson W. 2013, ApJ, 772, 131
- De Plaa et al. (2007) De Plaa J., Werner N., Bleeker J., Vink J., Kaastra J. & Méndez M. 2007 A&A 465, 345
- Diemand, Kuhlen & Madau (2007) Diemand J., Kuhlen M. & Madau P. 2007 ApJ 667, 859
- Elíasdóttir et al. (2007) Elíasdóttir Á. et al. 2007, arXiv:0710.5636
- Gastaldello et al. (2014) Gastaldello F. et al. 2014 MNRAS Lett. 442, 76
- Gao et al. (2004) Gao L., De Lucia G., White S. & Jenkins A. 2004 MNRAS 352, L1
- Gillis et al. (2013) Gillis B. et al. 2013 MNRAS 431, 1439
- Golovich et al. (2016) Golovich N., Dawson W., Wittman D., Ogrean G., van Weeren R. & Bonafede A. 2016 ApJ 831, 110
- Golovich et al. (2017) Golovich N., van Weeren R., Dawson W., Jee W. & Wittman D. 2017, ApJ in press (arXiv:1703.04803)
- Harvey et al. (2014) Harvey D. et al. 2014 MNRAS 441, 404
- Harvey et al. (2015) Harvey D. Massey R., Kitching T., Taylor A. & Tittley E. 2015 Science 347, 1462
- Harvey, Kneib & Jauzac (2016) Harvey D., Kneib J.-P. & Jauzac M. 2016 MNRAS 456
- Hogg & Blandford (1994) Hogg D. & Blandford R. 1994 MNRAS 268, 889
- Jauzac et al. (2014a) Jauzac M. et al. 2014 MNRAS 443, 1549
- Joseph, Courbin & Starck (2016) Joseph R., Courbin F. & Starck J.-L. 2016 A&A 589, 2
- Jee et al. (2016) Jee M., Dawson W., Stroe A., Wittman D., van Weeren R., Brüggen M., Bradac M. & Röttgering H. 206 ApJ 817, 179
- Jones et al. (2010) Jones T., Swinbank A., Ellis R., Richard J. & Stark D. 2010 MNRAS 404, 1247
- Jullo et al. (2007) Jullo E., Kneib J.-P., Limousin M., El asdóttir Á., Marshall P. & Verdugo T. 2007 NJPh 9, 447
- Kahlhoefer et al. (2014) Kahlhoefer F., Schmidt-Hoberg K., Frandsen M. & Sarkar S. 2014 MNRAS 437, 2865
- Kahlhoefer et al. (2015) Kahlhoefer F., Schmidt-Hoberg K., Kummer J. & Sarkar S. 2015 MNRAS Lett. 452,54
- Kennicut (1998) Kennicutt, R. C. 1998 ARA&A 36, 189
- Kim, Peter & Wittman (2017) Kim S., Peter A. & Wittman D. 2017 MNRAS 469, 1414
- Kneib & Natarajan (2011) Kneib J.-P. & Natarajan P. 2011 A&A Rev. 19, 47
- Liesenborgs, De Rijcke & Dejonghe (2006) Liesenborgs J., De Rijcke S. & Dejonghe H. 2006 MNRAS 367, 1209
- Limousin et al. (2005) Limousin M., Kneib J.-P. & Natarajan P., 2005 MNRAS 356, 309
- Limousin et al. (2007) Limousin M., Kneib J.-P., Bardeau S., Natarajan P., Czoske O., Smail I., Ebeling H. & Smith G. 2007 A&A 461, 881
- Limousin et al. (2012) Limousin M. et al. 2012 A&A 544, 71
- Mahdavi et al. (2007) Mahdavi A., Hoekstra H., Babul A., Balam D. & Capak P. 2007 ApJ 668, 806
- Mandelbaum et al. (2006) Mandelbaum R. Seljak U., Kauffmann G., Hirata C. & Brinkmann J. 2006 MNRAS 368, 715
- Massey, Kitching & Richard (2010) Massey R., Kitching T. & Richard J. 2010 Rep. Prog. Phys. 73, 086901
- Massey, Kitching & Nagai (2011) Massey R., Kitching T. & Nagai D. 2011 MNRAS 413, 1709
- Massey et al. (2015) Massey R. et al. 2015 MNRAS 449, 3393
- McMullin et al. (2007) McMullin J. P. , Waters B., Schiebel D., Young W. & Golap K. 2007 Astronomical data analysis software and systems XVI 376, 127
- Meneghetti et al. (2017) Meneghetti M. et al. 2017 MNRAS submitted, arXiv:1606.04548
- Merten et al. (2011) Merten J. et al. 2011 MNRAS 417, 333
- Monteiro-Oliveira et al. (2017) Monteiro-Oliveira R., Cypriano E., Machado R., Lima Neto G., Ribeiro A., Sodré L. & Dupke R. 2017 MNRAS 466, 2614
- Nagai et al. (2005) Nagai D. & Kravtsov A. 2005 ApJ 618, 557
- Natarajan et al. (2009) Natarajan P. , Kneib J.-P., Smail I., Treu T., Ellis R., Moran S., Limousin M. & Czoske O. 2009 ApJ 693, 970
- Ng et al. (2015) Ng K. et al. 2015 MNRAS 453, 1531
- Niemiec et al. (2017) Niemiec A. et al. 2017 arXiv:1703.03348
- Parker et al. (2007) Parker L., Hoekstra H., Hudson M., van Waerbeke L. & Mellier Y. 2007 ApJ 669, 21
- Peñarrubia, McConnachie & Navarro (2008) Peñarrubia J., McConnachie A. & Navarro J. 2008 ApJ 672, 904
- Peng et al. (2010) Peng C., Ho L., Impey C. & Rix H.-W. 2010 AJ 139, 2097
- Peter et al. (2012) Peter A. et al. 2012 arXiv:1208.3026
- Plummer (1911) Plummer H. 1911 MNRAS 71, 460
- Randall et al. (2008) Randall S., Markevitch M., Clowe D., Gonzalez A. & Bradač M. 2008 ApJ 679, 1173
- Robertson et al. (2017a) Robertson A., Massey R. & Eke V. 2017a, MNRAS 465, 569
- Robertson et al. (2017b) Robertson A., Massey R. & Eke V. 2017b, MNRAS 467, 4719
- Schaller et al. (2015) Schaller M., Robertson A., Massey R., Bower R. & Eke V. 2015, MNRAS Lett. 453, 58
- Schaye et al. (2015) Schaye J. et al. 2015, MNRAS 446, 521
- Shu et al. (2016) Shu Y., Bolton A., Moustakas L., Stern D., Dey A., Brownstein J., Burles S. & Spinrad H. 2016, ApJ 820, 43
- Solomon & Vanden Bout (2005) Solomon P. & Vanden Bout P. 2005 ARA&A 43, 677
- Taylor et al. (2017) Taylor P., Massey R., Jauzac M., Courbin F., Harvey D., Joseph R. & Robertson A. 2017 MNRAS 468, 5004
- Vogelsberger et al. (2014) Vogelsberger M. et al. 2014 Nature 509, 177
- Wetzel, Cohn & White (2009) Wetzel A., Cohn J. & White M. 2009 MNRAS 395, 1376
- Williams & Saha (2011) Williams L. & Saha P. 2011 MNRAS 415, 448