Quasiparticle spectra from molecules to bulk
Abstract
A stochastic cumulant GW method is presented, allowing us to map the evolution of photoemission spectra, quasiparticle energies, lifetimes and emergence of collective excitations from molecules to bulk-like systems with up to thousands of valence electrons, including Si nanocrystals and nanoplatelet. The quasiparticle energies rise due to their coupling with collective shake-up (plasmon) excitations, and this coupling leads to significant spectral weight loss (up to 50% for the low energy states), shortening the lifetimes and shifting the spectral features to lower energy by as much as 0.6 eV. Such features are common to all the systems studied irrespective of their size and shape. For small and low dimensional systems the surface plasmon resonances affect the frequency of the collective excitation and position of the satellites.
Recent developments in Green’s function (GF) techniques have allowed for the description of charge excitations, i.e., quasiparticles (QPs) FetterWalecka ; Gross1991 , in the bulk, over a wide range of QP energies. Band-edge excitations are well-described by the so called approximation Hedin1965 ; HybertsenLouie ; martin2016interacting , while at higher QP energies corrections are required to account for charge-density fluctuations and hole-plasmon coupling Aryasetiawan1996 ; Guzzo2011valence ; kas2014cumulant ; martin2016interacting . Photoemission experiments on solids reveal significant QP lifetime shortening and coupling to other collective excitations, manifested by satellite structures in the photoemission spectra langreth1970singularities ; Aryasetiawan1996 ; lischner2015satellite . The satellite structure and the QP lifetime shortening is often captured by the cumulant expansion (CE) ansatz to Aryasetiawan1996 ; Guzzo2011valence ; kas2014cumulant ; lischner2015satellite ; caruso2015band ; vigil2016dispersion ; McClain2016 ; Mayers2016 .
In confined systems, the QP spectrum near the band-edge is governed by the quantum confinement of electrons and holes. Higher energy, satellite-excitations are attributed to simultaneous ionization and excitation of the valence electrons (“shake-up” excitations) Schirmer1983 ; Cederbaum1986 ; Deleuze1997 ; McClain2016 ; Krylov2017 . Transition and differences between the satellite spectral features of molecules and nanostructures with “shake-up” signatures and bulk with collective plasmon resonances have been difficult to assess, as they require many-body treatment of systems with hundreds and thousands of electrons. In fact, the quantum confinement effect on the satellite transitions has received little attention if any.
In this letter, we address this challenge by combining the well-known cumulant expansion (CE) ansatz lundqvist1967single ; langreth1970singularities ; kas2014cumulant ; martin2016interacting ; Lischner2013 ; caruso2015band ; Guzzo2011valence with the recent stochastic GW approach (sGW Neuhauser2014 ; vlcek2016stochastic ), to obtain a nearly linear-scaling algorithm that reveals the changes of the QP spectra from a single molecule to covalently bonded nanocrystals (NCs) of unprecedented size (here up to 5288 valence electrons). The formalism is presented and assessed for the two size extremes (molecule and bulk), followed by the study of the effects of quantum confinement on the satellite structure in silicon NCs of different size and shape. In small NCs the satellite features are affected by the changes in the plasmon energy. For large NCs, we find observable quantum confinement effects on the satellite features below the exciton Bohr radius, where the position of the satellite peak and the QP lifetime show small dependence on the size of the system.
The central theoretical quantity for quasiparticles is the spectral function, which in the sudden approximation is directly linked to the photoemission current Aryasetiawan1998 ; OnidaReiningRubio2002 ; martin2016interacting . The spectral function of the QP state is , where the Green’s function fulfills the Dyson equation , where is the non-interacting Green’s function and is the self-energy. All the quantities are non-local in space and all the higher terms in the equation represent a convolution integral, but for brevity we omit the spatial dependence in the notation.
As usual, the non-interacting system is described by the Kohn-Sham DFT HohenbergKohn ; KohnSham (see details in 111The LDA DFT calculation used a real-space grid and Troullier-Martins pseudopotentials. The QP energies were calculated by the approach detailed in Neuhauser2014 ; vlcek2016stochastic . The grid spacings were 0.6 for the Si nanocrystals, 0.4 for the PH3 and NH3 molecules and 0.5 for the C2H2 molecule. The self-energy is approximated to be diagonal in the basis of KS eigenstates.). The self energy is then given in the diagonal approximation as Hedin1965 : , where is infinitesimally after , is the KS eigenstate, , is the Coulomb kernel and is the inverse dielectric function. Quantities in frequency ( and ) and time domains ( and ) are simply related by their Fourier transforms. From the calculated the spectral function is given by:
| (1) |
where is the KS eigenstate energy and is the expectation value of the mean-field exchange-correlation potential. has peaks at the quasi-particle energies, , that fulfill the fixed-point equation,
| (2) |
In this GW approximation, the inverse lifetime of the QP is given by the imaginary part of the self-energy at the peak. However, the actual plasmon-hole coupled excitations are not in general represented by the isolated poles in Eq. (1) and thus does not yield a proper description of satellite structures. In addition, spurious secondary peaks arise if Eq. (2) has multiple solutions Aryasetiawan1996 ; Lischner2013 ; Guzzo2011valence .
The CE formulation is required to account for the effect of hole-plasmon coupling. For the occupied state, the Green’s function in the CE ansatz reads lundqvist1967single ; langreth1970singularities ; martin2016interacting :
| (3) |
where is the cumulant, obtained from the Dyson series expansion. Further, following Ref. Aryasetiawan1996 the cumulant contribution is separated into two components. The first is a QP cumulant, , derived explicitly in Ref. Aryasetiawan1996 and associated with a portion of the spectral function describing the main QP peak:
| (4) |
where the renormalization factor, due to redistribution of the spectral weight into the satellite peaks, is with . The lifetime of the QP is .
By itself, does not include any satellite contributions – it is a single Lorentzian-shaped peak around the QP energy. The satellite peaks stem from resonances identified as poles in (i.e., zeros of ) and appear as strong maxima in the imaginary part of the self-energy; they are introduced by the second part of the exponential in Eq. (3) that derives from the spectral representation of lundqvist1967single ; langreth1970singularities ; Aryasetiawan1996 :
| (5) |
We solve for using , obtained from the stochastic calculation. The computed satellite cumulant, , is inserted to Eq. (3) which is Fourier transformed to yield , and thereby 222In principle, the total spectral function requires the calculation of for all occupied states, but this is numerically prohibitive except for very small systems. However, since the quasiparticle energies and the spectral functions vary smoothly with frequency [Vlcek et al. 2017, ArXiv:1701.02023] for the extended system studied here, we compute the spectral function for several selected states and interpolate the result. The number of states is increased till the interpolation is converged to within 0.1 eV To evaluate the total spectral function of the large systems in Fig. 3, a single Lorentzian peak was used to describe the satellites. We found that a third order polynomial fit to the quasiparticle energies and the parameters of the Lorentzian peaks is sufficient to yield QP energies and satellite positions within 0.4 eV, i.e. way better than the resolution of the predicted spectral functions. For systems up to Si705H300, we found that calculations for 5 independent states provide converged results. For Si1201H484 3 calculations were performed. .
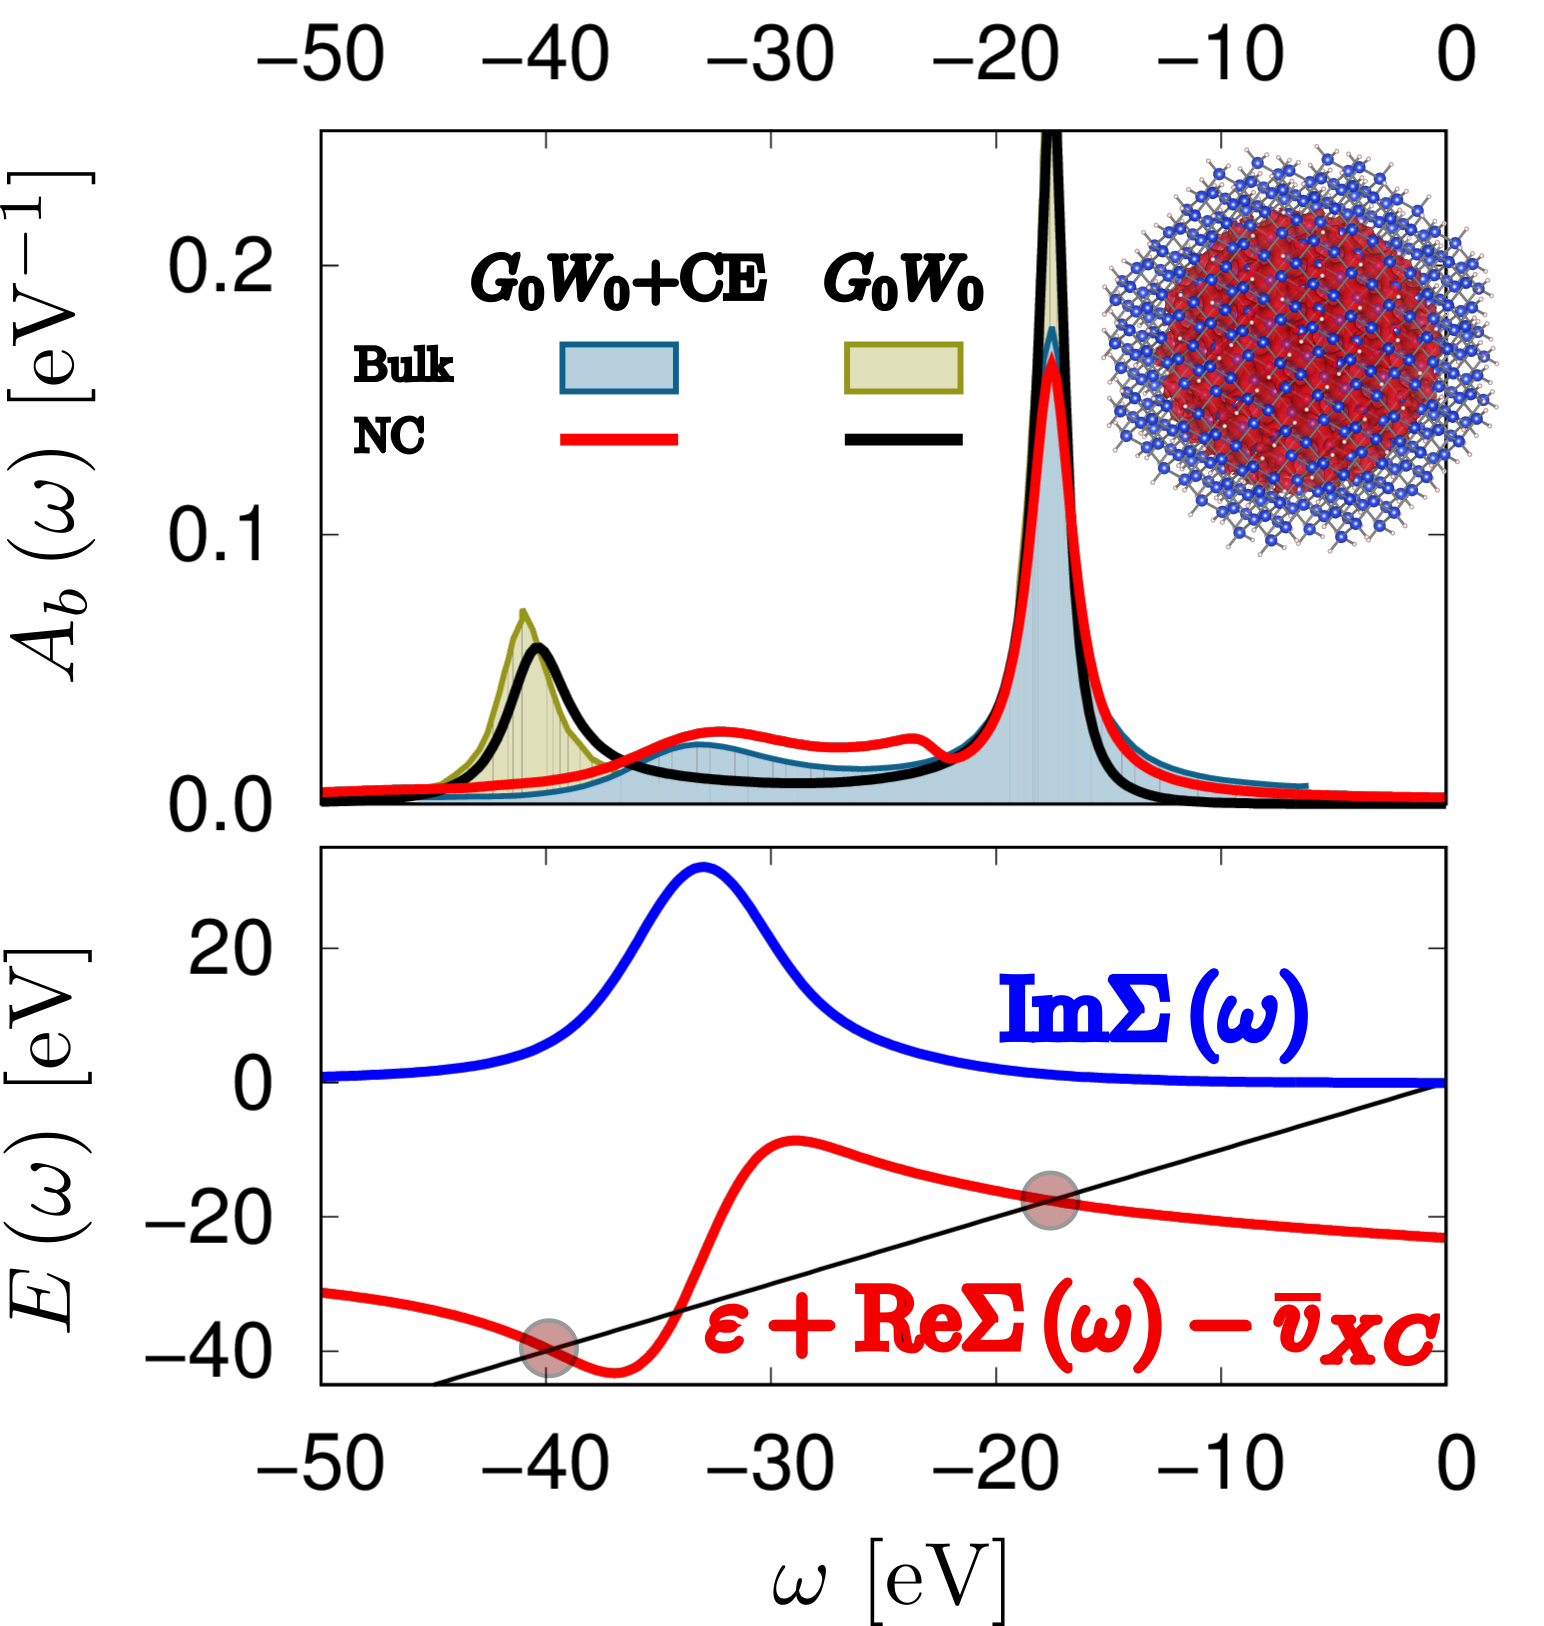
We next verify our approach using a large NC, Si705H300, that is close to the bulk limit. Fig. 1 shows the spectral function of the bottom valence band (VB - denoted ) with a pronounced QP peak at eV. If a cumulant expansion is not used, shows an additional maximum at eV. This is in excellent agreement with previous GW calculations for bulk systems, but is not observed experimentally, and is attributed to spurious secondary solutions to Eq. (2) Aryasetiawan1996 ; Guzzo2011valence ; kas2014cumulant ; caruso2015band ; lischner2015satellite .
With the cumulant (Eq. (3)) the spectrum changes drastically and an additional peak is obtained at eV in excellent agreement with a result for bulk Si lischner2015satellite . This peak is physically meaningful as it corresponds to the maximum of associated with a collective excitation of the valence electrons (plasmon). The appearance of the satellite structure is accompanied by reduction of the intensity of the main QP peak, so that the renormalization factor is , i.e., 39% of the intensity is transferred to the satellites. The asymmetry of the satellite is due to the difference between the effective masses of the QP and the plasmon vigil2016dispersion . The pronounced transfer of the spectral weight to the plasmon satellite for the bottom valence excitations is a consequence of their high energy and spatial extent (leading to large overlaps with other states). An isosurface of the bottom valence orbital of Si705H300 indeed exhibits spherical symmetry and lacks nodal planes as seen from the inset of Fig. 1.
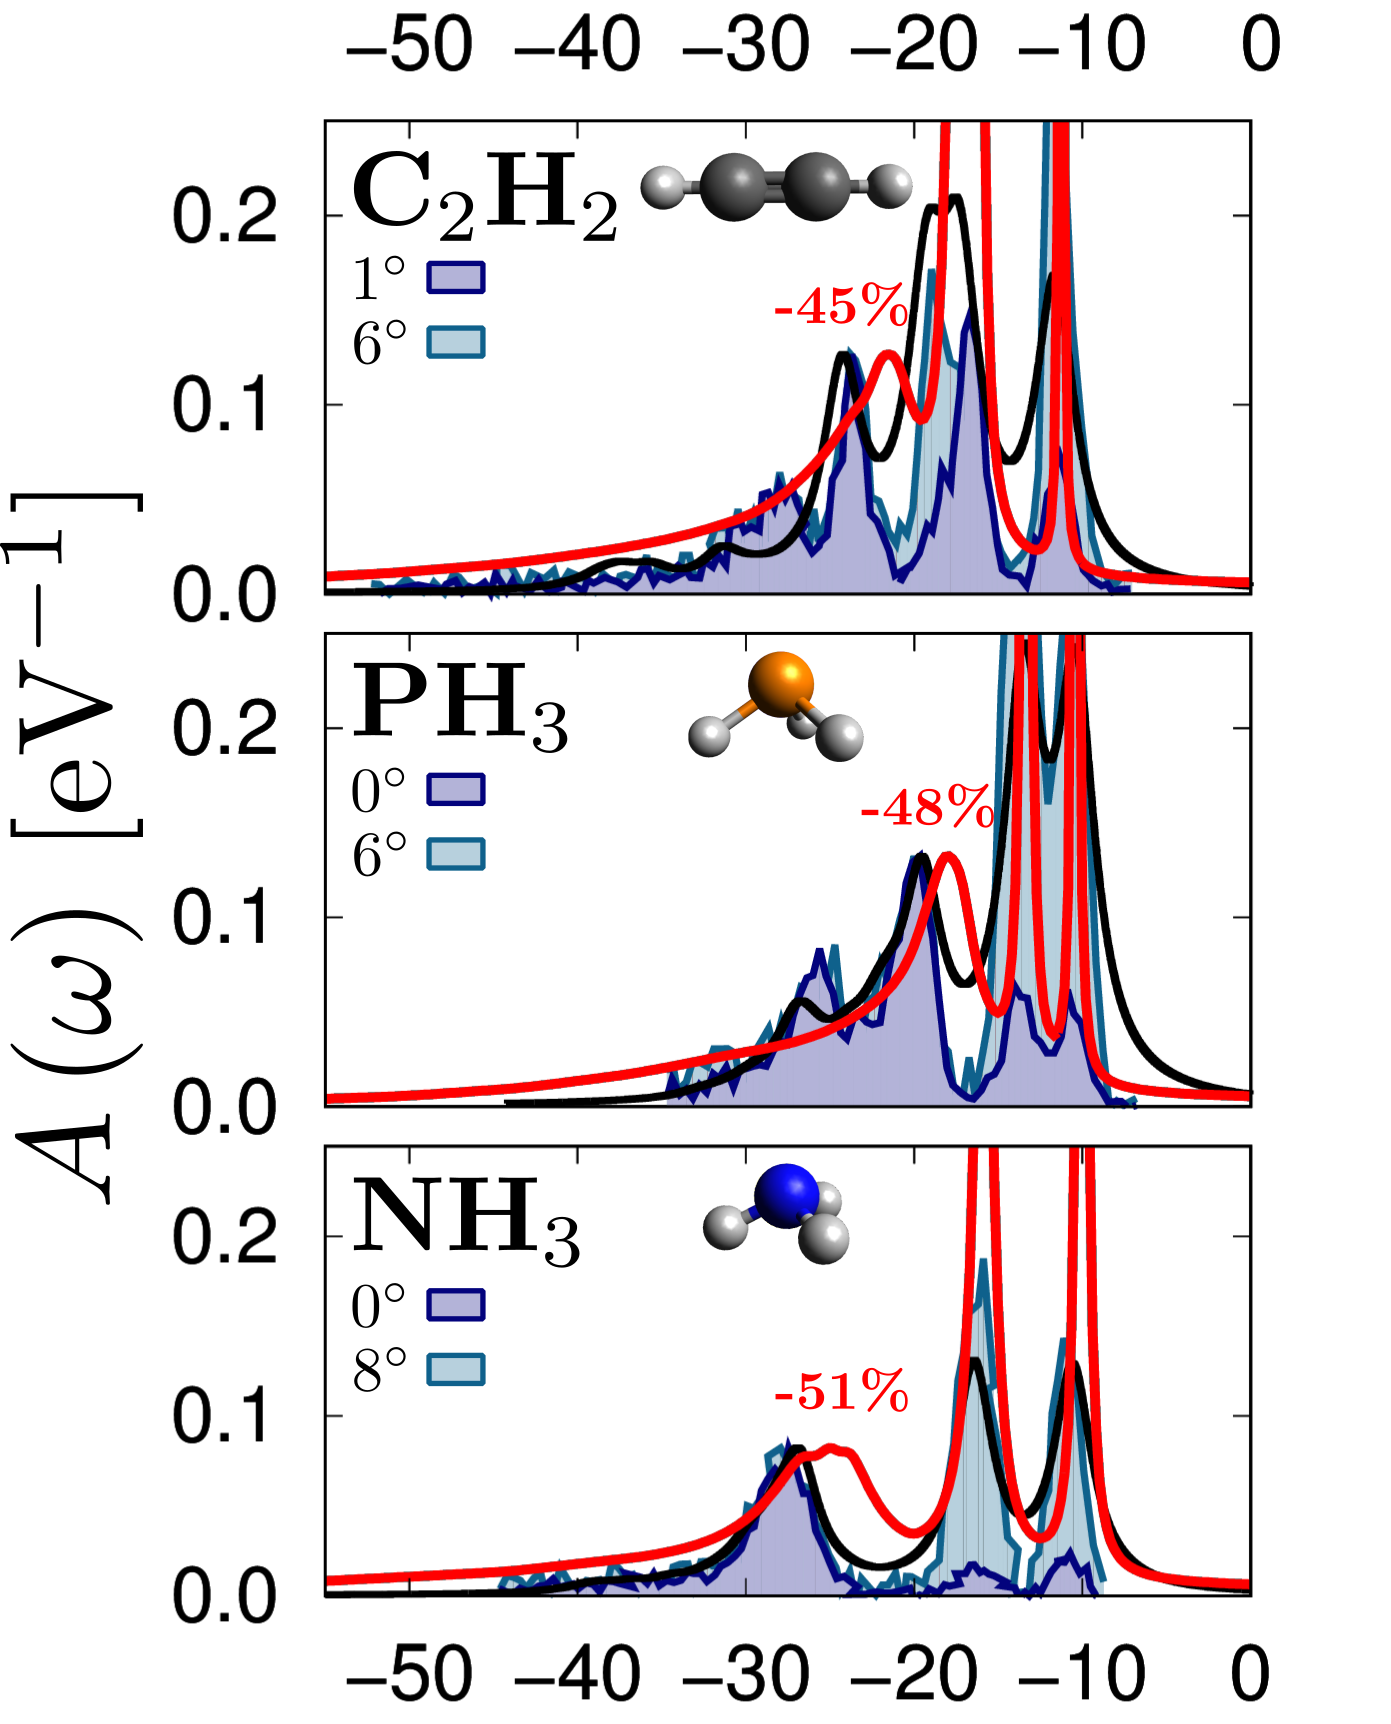
To further test our approach on finite systems, we applied (Fig. 2) the stochastic approximation with CE to a series of small molecules for which experimental photoemission spectra are available. The results in Fig. 2 were further scaled so that the bottom valence state peak has the same intensity as the +CE curve. The +CE description relies on the concept of plasmon, valid for extended systems. It is thus surprising that this approach provides a qualitative description for such small systems. Indeed, the stochastic with damped real-time propagation of the exited state Neuhauser2014 ; vlcek2016stochastic is in qualitative agreement with experiment and with high level SAC-CI (symmetry-adapted-cluster configuration interaction) calculations, computationally feasible for small molecules 333Similar to Ref. Ishida2002 , the SAC-CI results were convoluted with a Lorentzian peak with 2 eV broadening. We note that:
(i) the QP energies at the top valence band are captured well by . This is the energy region where DFT is a good starting point. But fails, however, to reproduce the bottom end of the valence band, where it underestimates the position of the peaks by a significant amount of 2 eV. For these states, DFT is not a good starting point and the “single-shot” procedure is inaccurate.
(ii) Most importantly, the +CE description captures the satellite overall decay, although without the fine structure peaks in the satellite region. The pronounced satellite spectral weight comes at the expense of the QP peaks which transfer up to of their intensity to the satellite tails. The broadening of the satellite peaks observed in +CE is a consequence of an intrinsic decay of the density–density correlation function in time (). The peak width is independent of the maximal time used to simulate the screening (we have varied the propagation time from 1 to 24 fs without affecting the lifetime), leading to a set of broad poles in the dielectric function. In theory, an infinite propagation time would result in sharp poles due to recurrences in the correlation function. As clearly can be seen in Fig.2, accounting only for yields a photoelectron spectrum in good agreement with experiment, likely due to other mechanism suppressing the recurrences in photoelectron spectroscopy.
Further, the +CE spectral function has maxima that are shifted with respect to the QP energies. The shift is large for the bottom valence states; e.g., for NH3 the peak is at eV while the +CE maximum is at eV. The eV difference is significant as it is 17% of the GW correction to the LDA energy ( eV). Thus, the usual practice where results are directly compared to photoionization experiment is problematic, especially for low energy states, as it does not include the coupling of these states to the shake-up excitations.
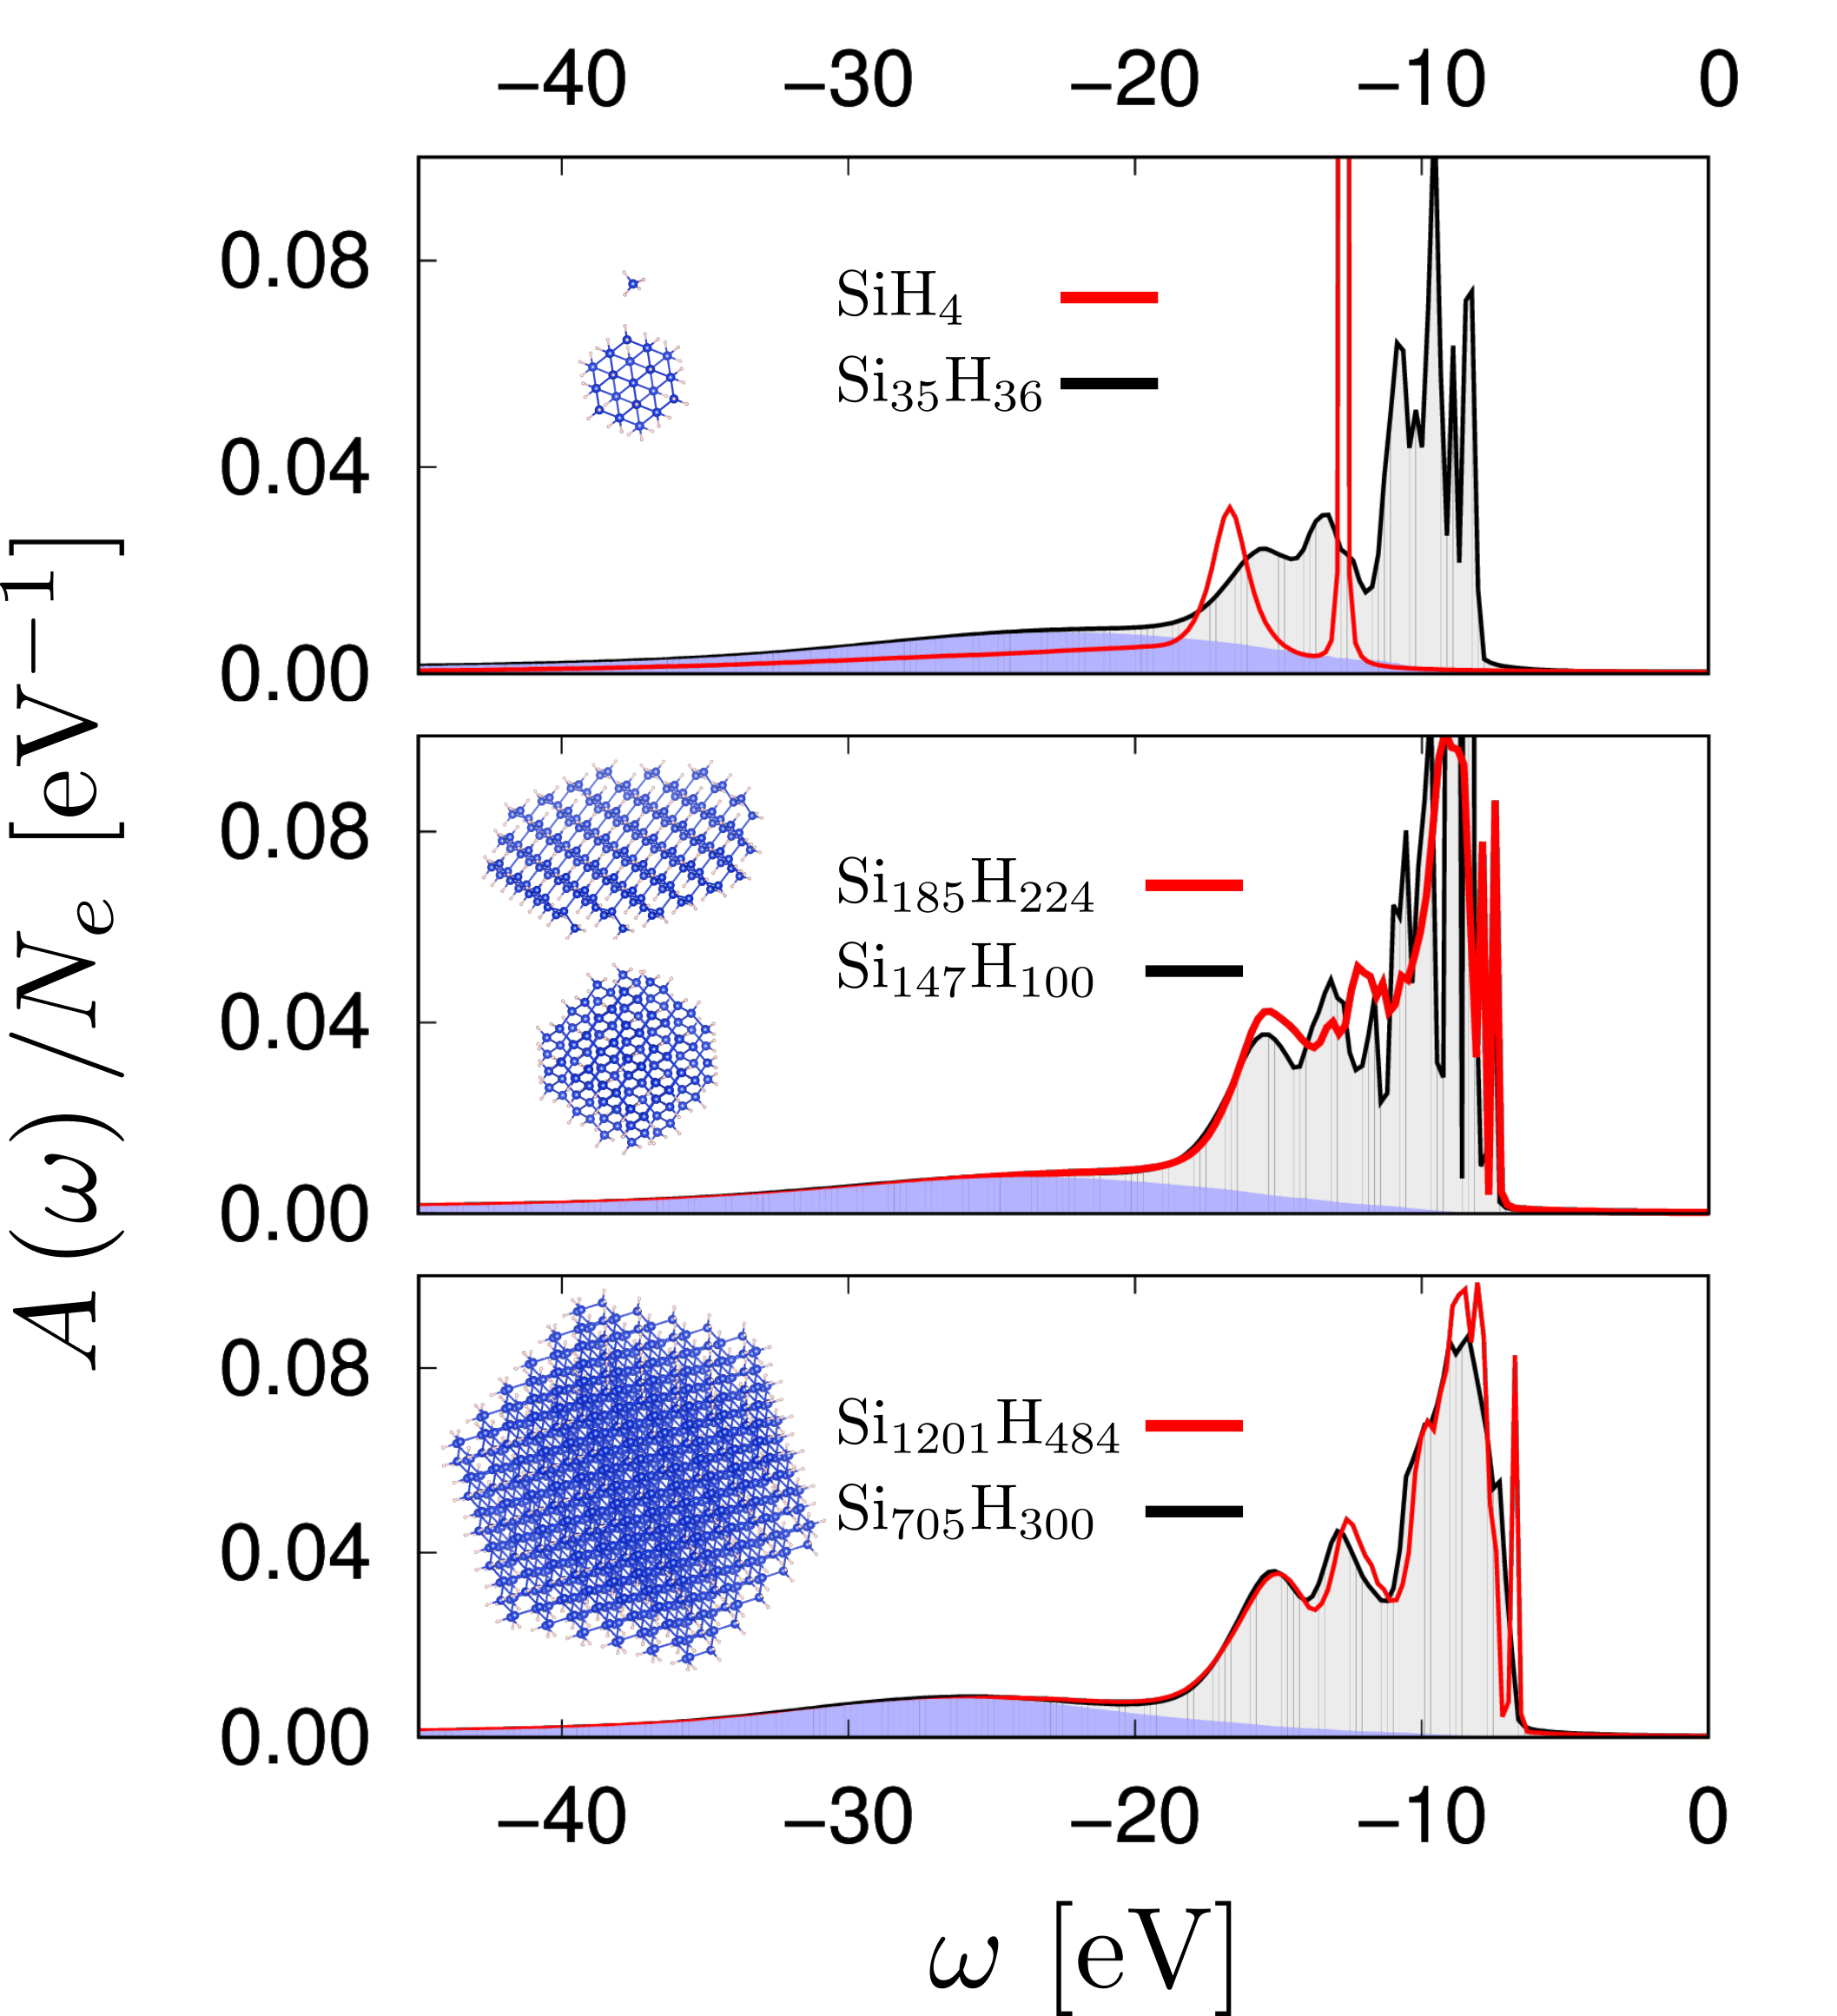
In the next, main, part of this letter we investigate the evolution of the spectral function with system size; the results for a series of Si NCs (normalized by the number of electrons) are shown in Fig. 3. All NCs exhibit a discrete and narrow spectrum near the top of the VB. Due to the quantum confinement effect, the top of the VB shifts to higher energies with increasing size; the highest occupied state has energies of -8.1 eV and -6.4 eV for for Si35H36 and for Si1201H484, respectively. For deeper hole excitations, the sharp features merge into a semi-continuous spectral response with significant life-time shortening. This is accompanied by significant spectral weight transfer () to the satellites. The bottom of the VB depends weakly on the system size, spanning an energy between -17.3 and -17.7 eV for the range of NCs studied. The QP peak also overlaps with the emerging satellite, which is already well-developed into its bulk shape for Si35H36 and found in the range typical for bulk silicon Guzzo2011valence . This result is rather surprising, since both the QP spectrum near the band edge and the plasmonic excitations are sensitive to the system size. We further observe that the dimensionality does not strongly affect the main QP peaks: the silicon platelet has of the Si atoms on the surface, yet its spectral function is similar to the NCs.
On closer inspection, we observe that the satellite maximum exhibits non-monotonic shifts: First it shows a strong decrease in energy for systems from Si35H36 to Si705H300 (from to eV, respectively), which is followed by slight move back to higher energies by 0.6 eV. The initial regime stems from the decrease in the plasmon resonance frequency () discussed below in detail. Once converges, the satellite maximum follows the changes in the QP DOS of the valence states governed by quantum confinement, i.e. the spectrum moves to higher energies (c.f., Fig. 3).
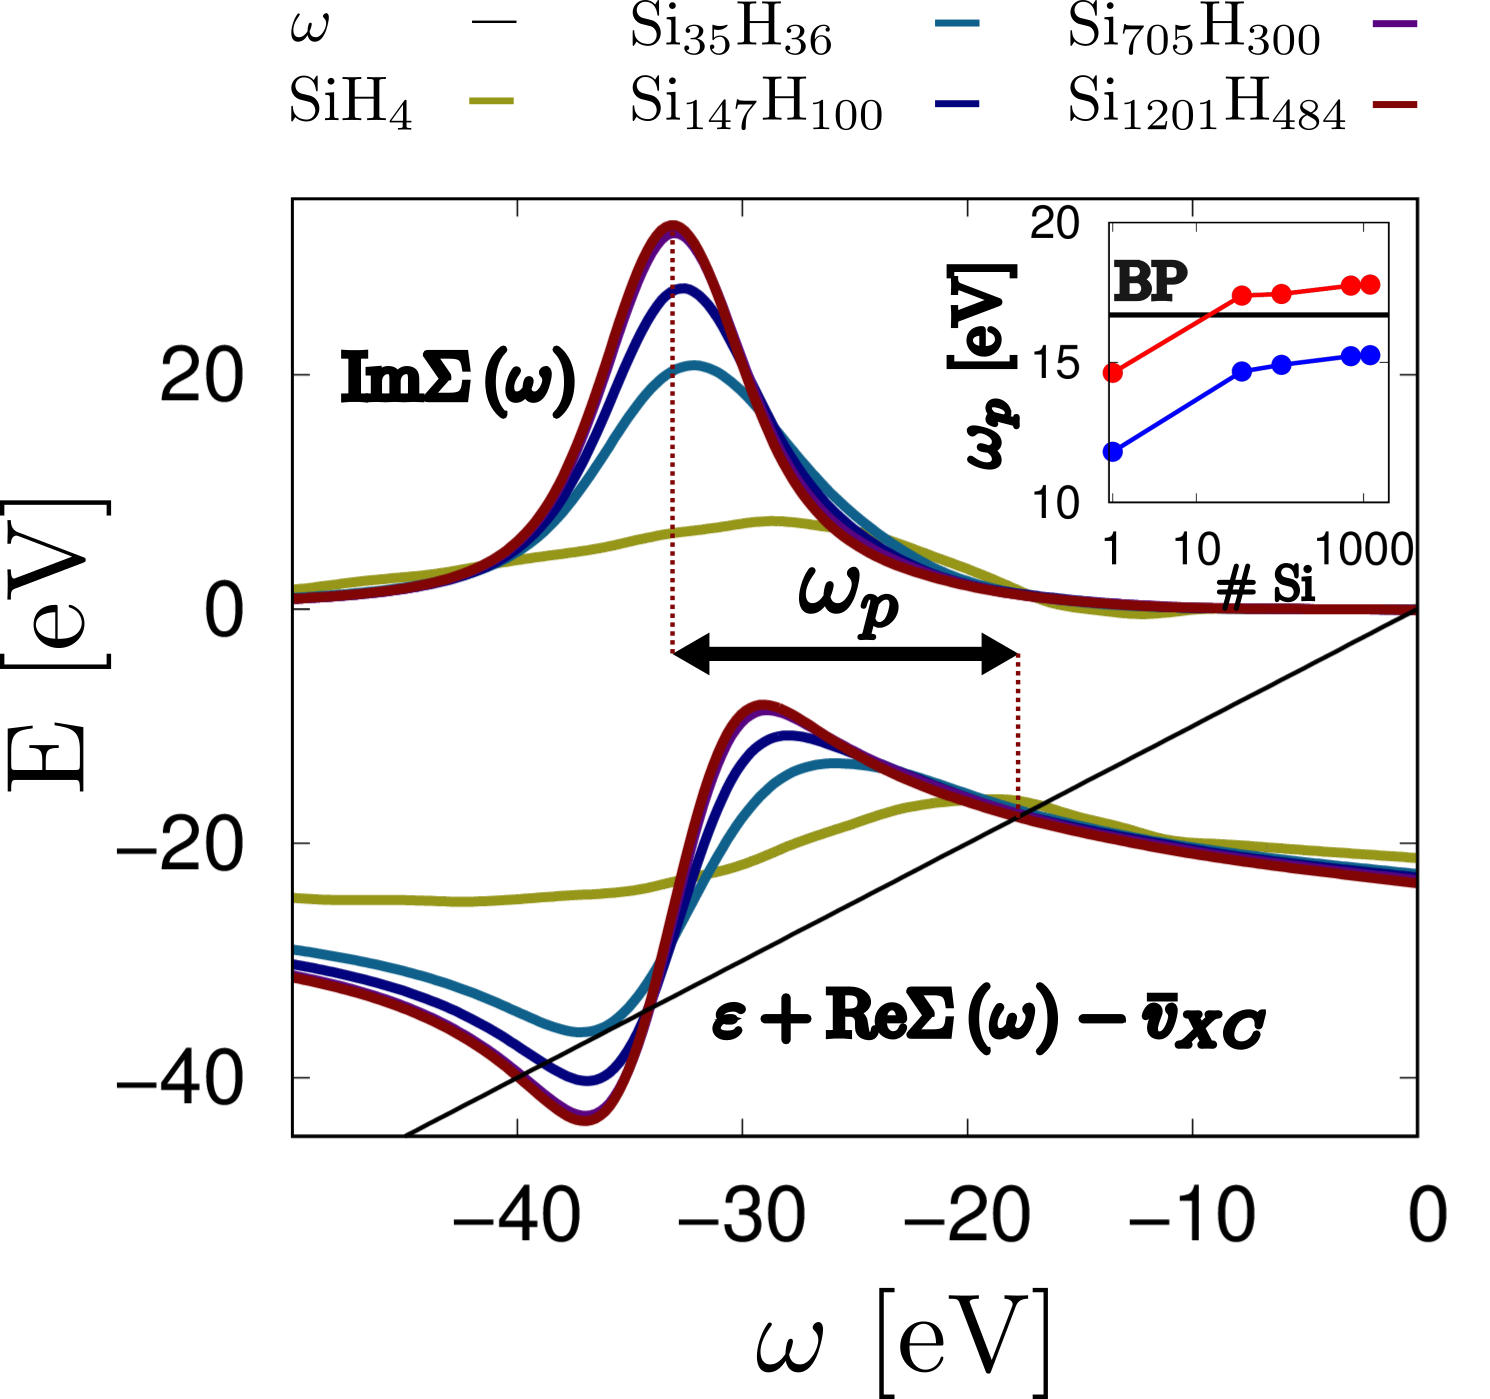
In Fig. 4 we show together with the graphical solution to Eq. 2 (which also depicts spurious secondary solutions found already for Si35H36 at eV). The plasmon peak in the curve changes till the asymptotic limit is reached; ultimately the curve for NCs with 3120 electrons (Si705H300) and 5288 electrons (Si1201H484) have practically identical height, width and position. The distance between the maximum of and the QP energy corresponds to coupled to the bottom valence hole; for the largest system eV. Convergence of with system size is shown in the inset for the top and the bottom VBs.
Unlike in solids, the holes in finite systems couple to two types of plasmon resonances: low energy surface plasmon and high energy bulk plasmon. For small NCs, both contribute and lead to a broad peak in . The surface plasmon resonances also strongly contribute in low dimensional structures – the plasmon satellite of the large Si platelet has a maximum at eV which is almost identical to the smallest NC (Si35H36). For big systems, the hole becomes more localized inside the NC (c.f., inset of Fig. 1) and the coupling to the bulk plasmon dominates, leading to increase in . The distribution of the resonances becomes more narrow and the peak in decreases in width.
In summary, our calculations are the first ab-initio theoretical predictions of the photoemission spectra, quasiparticle energies and lifetimes covering the wide region between molecules and solids. The calculations show that the QP energies gradually increase with system size and this is accompanied by changes in the position of the satellite peaks which corresponds to a simultaneous ionization of the system and creation of a collective (shake-up or plasmon) excitation. The characteristic frequency of the plasmon has a narrower energy distribution in comparison to the shake-up but both are similar in nature and significantly alter the spectrum at low energies. Further, we have shown that for small systems the satellite region merges with the QP peak and shifts the apparent photoemission peak maximum to lower energies. The QP energies and photoemission maxima thus differ for the systems studied by as much as 0.6 eV.
The position of the satellite region is dictated by the QP energies and the frequency of the collective excitation. For small and low dimensional systems, surface and bulk plasmon resonances contribute to the satellites (leading to inhomogeneous broadening of the satellites). With increasing size the higher energy bulk plasmon coupling dominates. For small and intermediate systems, the maximum of the satellite decreases in energy and is affected by the plasmon resonance energy. For big systems, the maximum shows a slight increase due to changes in the main part of the QP spectrum.
Acknowledgements.
This work was supported by the Center for Computational Study of Excited-State Phenomena in Energy Materials (C2SEPEM) at the Lawrence Berkeley National Laboratory, which is funded by the U.S. Department of Energy, Office of Science, Basic Energy Sciences, Materials Sciences and Engineering Division under Contract No. DE-AC02-05CH11231, as part of the Computational Materials Sciences Program. The calculations were performed as part of the XSEDE computational project TG-CHE160092 towns2014xsede . This research used resources of the National Energy Research Scientific Computing Center, a DOE Office of Science User Facility supported by the Office of Science of the U.S. Department of Energy under Contract No. DE-AC02-05CH11231.References
- [1] Alexander L Fetter and John Dirk Walecka. Quantum Theory of Many-Particle Systems. Dover Publications, 2003.
- [2] E.K.U. Gross, E Runge, and O Heinonen. Many-particle Theory. A. Hilger, 1991.
- [3] Lars Hedin. New Method for Calculating the One-Particle Green’s Function with Application to the Electron-Gas Problem. Phys. Rev., 139(3A):A796—-A823, aug 1965.
- [4] M S Hybertsen and S G Louie. Electron correlation in semiconductors and insulators: Band gaps and quasiparticle energies. Phys. Rev. B, 34:5390, 1986.
- [5] Richard M Martin, Lucia Reining, and David M Ceperley. Interacting Electrons. Cambridge University Press, 2016.
- [6] Ferdi Aryasetiawan, Lars Hedin, and Krister Karlsson. Multiple plasmon satellites in Na and Al spectral functions from ab initio cumulant expansion. Phys. Rev. Lett., 77(11):2268, 1996.
- [7] Matteo Guzzo, Giovanna Lani, Francesco Sottile, Pina Romaniello, Matteo Gatti, Joshua J Kas, John J Rehr, Mathieu G Silly, Fausto Sirotti, and Lucia Reining. Valence electron photoemission spectrum of semiconductors: Ab initio description of multiple satellites. Phys. Rev. Lett., 107(16):166401, 2011.
- [8] JJ Kas, John J Rehr, and Lucia Reining. Cumulant expansion of the retarded one-electron Green function. Phys. Rev. B, 90(8):085112, 2014.
- [9] David C Langreth. Singularities in the x-ray spectra of metals. Phys. Rev. B, 1(2):471, 1970.
- [10] Johannes Lischner, GK Pálsson, Derek Vigil-Fowler, S Nemsak, J Avila, MC Asensio, CS Fadley, and Steven G Louie. Satellite band structure in silicon caused by electron-plasmon coupling. Phys. Rev. B, 91(20):205113, 2015.
- [11] Fabio Caruso, Henry Lambert, and Feliciano Giustino. Band structures of plasmonic polarons. Phys. Rev. Lett., 114(14):146404, 2015.
- [12] Derek Vigil-Fowler, Steven G Louie, and Johannes Lischner. Dispersion and line shape of plasmon satellites in one, two, and three dimensions. Phys. Rev. B, 93(23):235446, 2016.
- [13] James McClain, Johannes Lischner, Thomas Watson, Devin A Matthews, Enrico Ronca, Steven G Louie, Timothy C Berkelbach, and Garnet Kin-Lic Chan. Spectral functions of the uniform electron gas via coupled-cluster theory and comparison to the GW and related approximations. Phys. Rev. B, 93(23):235139, 2016.
- [14] Matthew Z Mayers, Mark S Hybertsen, and David R Reichman. Description of quasiparticle and satellite properties via cumulant expansions of the retarded one-particle Green’s function. Phys. Rev. B, 94(8):081109, 2016.
- [15] J Schirmer, LS Cederbaum, and O Walter. New approach to the one-particle Green’s function for finite Fermi systems. Phys. Rev. A, 28(3):1237, 1983.
- [16] LS Cederbaum, W Domcke, J Schirmer, and W Von Niessen. Correlation effects in the ionization of molecules: breakdown of the molecular orbital picture. Adv. Chem. Phys, 65:115–159, 1986.
- [17] Michael S Deleuze and Lorenz S Cederbaum. Correlation effects in the valence x-ray photoionization spectra of ethylene, butadiene, and hexatriene. Int. J. Quantum Chem., 63(2):465–481, 1997.
- [18] Anna I Krylov. The quantum chemistry of open-shell species. Rev. Comput. Chem., 30, 2017.
- [19] BI Lundqvist. Single-particle spectrum of the degenerate electron gas. Physik der kondensierten Materie, 6(3):193–205, 1967.
- [20] Johannes Lischner, Derek Vigil-Fowler, and Steven G Louie. Physical origin of satellites in photoemission of doped graphene: An ab initio GW plus cumulant study. Phys. Rev. Lett., 110(14):146801, 2013.
- [21] Daniel Neuhauser, Yi Gao, Christopher Arntsen, Cyrus Karshenas, Eran Rabani, and Roi Baer. Breaking the Theoretical Scaling Limit for Predicting Quasiparticle Energies: The Stochastic GW Approach. Phys. Rev. Lett., 113(7):076402, aug 2014.
- [22] Vojtěch Vlček, Eran Rabani, Daniel Neuhauser, and Roi Baer. Stochastic GW calculations for molecules. arXiv preprint arXiv:1612.08999, 2016.
- [23] F Aryasetiawan and O Gunnarsson. The GW method. Reports Prog. Phys., 61(3):237–312, mar 1998.
- [24] G Onida, L Reining, and A Rubio. Electronic excitations: Density-functional versus many-body Green’s-function approaches. Rev. Mod. Phys., 74:601, 2002.
- [25] P Hohenberg and W Kohn. Inhomogeneous electron gas. Phys. Rev., 136:864, 1964.
- [26] W Kohn and L J Sham. Self-consistent equations including exchange and correlation effects. Phys. Rev., 140:A1133, 1965.
- [27] The LDA DFT calculation used a real-space grid and Troullier-Martins pseudopotentials. The QP energies were calculated by the approach detailed in [21, 22]. The grid spacings were 0.6 for the Si nanocrystals, 0.4 for the PH3 and NH3 molecules and 0.5 for the C2H2 molecule. The self-energy is approximated to be diagonal in the basis of KS eigenstates.
- [28] In principle, the total spectral function requires the calculation of for all occupied states, but this is numerically prohibitive except for very small systems. However, since the quasiparticle energies and the spectral functions vary smoothly with frequency [Vlcek et al. 2017, ArXiv:1701.02023] for the extended system studied here, we compute the spectral function for several selected states and interpolate the result. The number of states is increased till the interpolation is converged to within 0.1 eV To evaluate the total spectral function of the large systems in Fig. 3, a single Lorentzian peak was used to describe the satellites. We found that a third order polynomial fit to the quasiparticle energies and the parameters of the Lorentzian peaks is sufficient to yield QP energies and satellite positions within 0.4 eV, i.e. way better than the resolution of the predicted spectral functions. For systems up to Si705H300, we found that calculations for 5 independent states provide converged results. For Si1201H484 3 calculations were performed.
- [29] H Wasada and K Hirao. Computational studies of satellite peaks of the inner-valence ionization of C2H4, C2H2 and S using the SAC CI method. Chem. Phys., 138(2-3):277–290, 1989.
- [30] Mayumi Ishida, Masahiro Ehara, and Hiroshi Nakatsuji. Outer-and inner-valence ionization spectra of NH3, PH3, and AsH3: symmetry-adapted cluster configuration interaction general-R study. J. Chem. Phys, 116(5):1934–1943, 2002.
- [31] Erich Weigold, K Zhao, and W Von Niessen. Study of the valence electronic structure of ethyne by electron momentum spectroscopy and Green function methods. J. Chem. Phys, 94(5):3468–3478, 1991.
- [32] Similar to Ref. [30], the SAC-CI results were convoluted with a Lorentzian peak with 2 eV broadening.
- [33] J Stiebling. Optische Eigenschaften des einkristallinen Siliziums aus Elektronenenergieverlustmessungen. Z. Phys., 31(4):355–357, 1978.
- [34] John Towns, Timothy Cockerill, Maytal Dahan, Ian Foster, Kelly Gaither, Andrew Grimshaw, Victor Hazlewood, Scott Lathrop, Dave Lifka, and Gregory D Peterson. XSEDE: accelerating scientific discovery. Comput. Sci. Eng., 16(5):62–74, 2014.