Effects of equatorial chorus wave normal azimuthal distribution on wave propagation
The non-ducted propagation characteristics of the VLF waves in the inner magnetosphere were studied with respect to their frequency, source localization, and initial angle , between the wave-normal and the background magnetic field. The ray tracing software based on multi-components cold plasma approach was developed by use of the IGRF magnetic field model and the GCPM model of plasma density. We described dynamics of the wave-normals direction during its propagation and magnetospheric reflection. We showed that whistler waves can be reflected when lower hybrid resonance frequency becomes greater than the wave frequency: . It corresponds to magnetic latitude . The simulation results confirmed the inapplicability of the quasi-longitudinal approximation to describe the propagation of magnetospheric whistlers. The simulation results of chorus emissions propagation, which used realistic distributions of waves on the initial parameters was presented. Particularly, we obtained distributions of chorus emission waves in dependence on the wave-normal directions for different magnetic latitudes. It is required for studying diffusive processes in the radiation belts. The results were found to be in a good agreement with the CLUSTER STAFF-SA measurements.
Key words: MHD waves and instabilities, Plasma waves and instabilities, Nonlinear phenomena
1LPC2E/CNES and University of Orleans, France
2STUDIUM, Loire Valley Institute for Advanced Studies,
Orleans-Tours, France
3Taras Shevchenko National University
of Kyiv, Glushkova ave., 4, 03127, Kyiv, Ukraine
introduction
The most intense electromagnetic plasma waves observed in Earth’s radiation belts and outer magnetosphere, discrete ELF/VLF chorus emissions, are characterized by rising and falling tones in the few hundred to several thousand Hertz frequency range Burton and Holzer (1974); Tsurutani and Smith (1974). See also reviews by Omura et al. (1991) and Sazhin and Hayakawa (1992) and references therein. Critical to radiation belt dynamics, these emissions have been studied intensively because they play a crucial role in the acceleration of energetic electrons in the outer radiation belt. Typically ELF/VLF chorus emissions are observed near the magnetic equatorial plane in the dawn and dayside outer magnetosphere Omura et al. (1991). They have attracted special attention recently because they were observed as waveforms, allowing determination of their wave normal vector distributions. Burton and Holzer (1974) were the first who determined chorus normal vector distributions using the search coil magnetometer aboard OGO5, near the equator, at geosynchronous altitude. Chorus wave normal directions at magnetic latitudes and -shells 7.6 were later studied by Hayakawa et al. (1984). Analysis of wave normals and Poynting fluxes for separate emission elements has shown that the emissions are generated in proximity to the geomagnetic equator and propagate to higher latitudes in a non-ducted whistler mode Burton and Holzer (1974); Hayakawa et al. (1984) or duct mode Yearby et al. (2011). Chorus emissions are usually observed in the Earth’s dawn sector between 23:00 and 13:00 MLT Tsurutani and Smith (1974). These emissions, which propagate in the whistler mode, consist of two broad frequency bands on either side of half local equatorial gyrofrequency at the geomagnetic equator along the magnetic field line on which the waves are observed Tsurutani and Smith (1977, 1974). If present, the upper band exists in the frequency range and contains discrete chorus elements rising at a few kHz/s. The lower band exists in the frequency range and contains both elements rising at a few kHz/s and diffuse elements. In the inner magnetosphere, -shell is 2–6, wave generation onset has been shown to be associated with substorm electron injections Goldstein and Tsurutani (1984). Chorus in the radiation belts is believed to be generated through electron cyclotron instability when the distribution of energetic electrons in the 5 to 150 keV range is strongly anisotropic Trakhtengerts (1999). This has been shown to be the case in recent studies of such waves during electron injections. Chorus waves in the outer dayside region have received further attention recently, especially as the THEMIS mission was able to extend previous observations beyond to . Dayside quiet-time chorus cannot be explained in the absence of injections, however, and remains an area of active study. Other chorus generation occurs in the local minimum magnetic field regions near the dayside magnetopause on the magnetic latitude near Tsurutani and Smith (1977). The spatial and temporal dependencies of high-latitude chorus parameters are considerably different from those of the chorus generated near the magnetic equator. The frequency range of the high-latitude chorus is similar to chorus waves generated near the magnetic equator at but their spectral power distribution exhibits two maxima: and (0.25–0.30). These emissions are mainly detected within 1–2 from the magnetopause Tsurutani and Smith (1977).
Before the Cluster mission, observations of ELF/VLF chorus emissions were mainly made by single spacecraft, such as ISEE 1 and ISEE 2, which observed many similar events Gurnett et al. (1979). Recent Poynting flux and polarization measurements aboard Cluster spacecraft confirmed that the chorus source is located close to the equatorial plane Agapitov et al. (2011b, 2012); SantolÃk et al. (2005); Parrot et al. (2003). Measurements around the magnetic equator demonstrate the change in sign of the parallel component of the Poynting vector when the satellites cross the equator region. Poynting vector flux analysis indicates that the central position of the chorus source fluctuates along the background magnetic field within 1000–2000 km of the geomagnetic equatorial plane in the timescale of minutes. In studies of chorus emission generation mechanisms, Helliwell (1967) and Trakhtengerts (1999) gave theoretical estimates of the scale size of the wave generation region. Attempts to estimate the scale size experimentally were made using coordinated CLUSTER Agapitov et al. (2010); SantolÃk et al. (2005) and more recently THEMIS Agapitov et al. (2011c, a) observations in the radiation belt region.
Although the magnetospheric reflection of whistler chorus is discussed and simulated in a number of papers, such as Helliwell (1967) and Burton and Holzer (1974), experimental confirmation is scarce. Continuous increase in the angle between the wave vector and background magnetic field for several cases of reflected chorus in the outer magnetosphere, based on Ogo 5 measurements, was shown in Burton and Holzer (1974). In Parrot et al. (2003) the Poynting vector and wave normal directions of chorus waves were analyzed using Cluster STAFF-SA measurements of spectral matrices with a 4 s time resolution Agapitov et al. (2011b). Another Cluster spacecraft observed waves propagating from the geomagnetic equator region and reflected waves that reached a lower hybrid resonance reflection at low altitudes and returned to the equator at another location with a lower intensity Agapitov et al. (2010). Parrot et al. (2003) corroborated this interpretation using ray tracing analysis. Bortnik et al. (2008) demonstrated wave reflection, refraction and resultant inward radial propagation across -shells and MLT over several . The agreement between models and THEMIS data in the above study Bortnik et al. (2008) encourages use of the ray tracing technique to determine evolution and consequences of chorus waves outside the plasmasphere. To this end it is necessary to develop a numerical ray tracing code that can reproduce wave distributions based on direct measurements and then to fill up the observed distributions by the distributions obtained from simulations.
In this paper we obtain the distribution of chorus wave parameters, taking as a basis Cluster observations and to study influence of the equatorial azimuthal wave normal distribution to wave properties at high latitudes.
model description
In this section, we present the numerical model which computes ray trajectories of chorus emissions (ELF/VLF whistler modes) in the inner magnetosphere using the approximation of the cold collision-less multi-components plasma. The calculation is carried out making use of realistic plasma density parameters and pre-selected initial wave distributions.
The electromagnetic field should be presented in the following form , where field amplitude varies slowly compared with the eikonal (written as a four-dimensional line integral). In such approximation and the equations are transformed into a system of eikonal equations. The Maxwell’s equations give the equation system for components:
| (1) |
Then, the condition of solvability gives the dispersion relation:
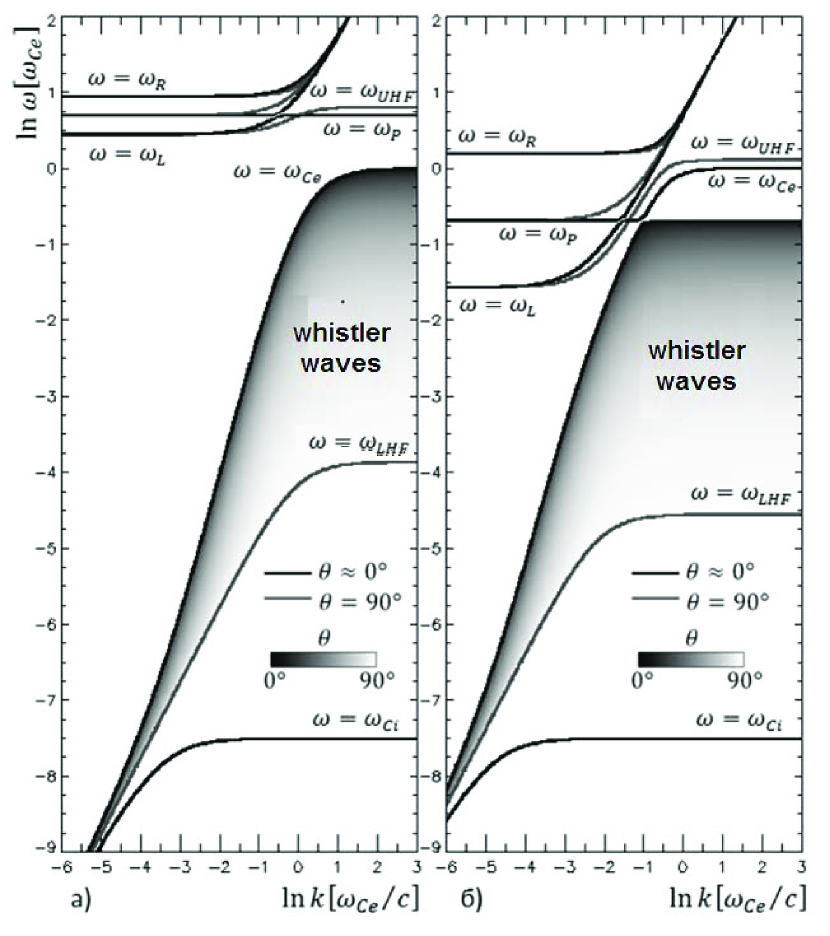
By use of the approximation of cold collisionless plasma in the background magnetic field in the field aligned coordinate system where is along with the angle between wave normal and the background magnetic field , the dispersion relation has the form Stix (1962):
| (2) |
where is the local electron gyrofrequency, , . The solutions of the dispersion relation are shown in Fig. 1 for two cases and respectively. This dispersion relation is used to solve numerically the equation system for the ray tracing:
| (3) |
in the following form:
| (4) |
The absolute value of the -vector can be obtained from the dispersion relation for whistler waves in a form:
| (5) |
where , , , and are the polarization parameters, following the notation by Stix (1962):
where is the local plasma frequency.
Magnetospheric chorus emissions are commonly observed between 2.5 and 10 . Near 2.5 the Earth’s core magnetic field is assumed to have a tilted dipolar structure with the dipole magnetic momentum corresponding to year 2005 epoch, and an analytical model includes the contribution of sources external to the Earth (namely magnetopause, tail and ring currents) at larger altitudes Olson and Pfitzer (1974). It is valid for all tilts of the Earth’s dipole axis during rather quiet magnetosphere (), and has been optimized for the near-Earth region (from 2 to 15 ). To obtain densities of the magnetospheric plasma species throughout the entire volume of the inner magnetosphere we use the Global Core Plasma Model Gallagher et al. (2000) (more detailed description of the used models see in Breuillard et al. (2012)).
chorus wave normal properties
in the outer radiation belt
The behavior of the numerical distribution of poleward rays is thus very consistent with the observed distribution presented in Fig. 2e from Agapitov et al. (2011b), where the similar wave normal angle distribution is constructed using the CLUSTER STAFF-SA measurements from years 2001 to 2009. The good agreement is confirmed Breuillard et al. (2012). The distributions obtained from experimental data and as a result of numerical simulations both exhibit the same tendency, i. e. a rapid increase of the mean value and variance with the growth of . It was shown that starting with direction close to the direction of the background magnetic field near the equator, wave-normals diverge from field aligned direction very fast and already on became close to the resonance cone (Fig.2, LABEL:fig3). When the wave frequency becomes less than the background lower hybrid frequency (), whistler wave transforms to the quasi-electrostatic mode, wave-normal comes to transverse direction, group velocity changes its sign and wave can be reflected Agapitov et al. (2011b). From the numerical simulation of chorus emissions propagation we obtained distributions of chorus emission waves in dependence on the wave-normal directions for different magnetic latitudes. The deviation of wave-normal direction from the direction of the background magnetic field tends to significant increase of the efficiency of wave-particle interaction in the radiation belts Artemyev et al. (2012b, a). Due to particle scattering on chorus waves the electron life-time decreases Mourenas et al. (2012b, a). The wave normal distributions obtained using hot plasma approximations are described in Breuillard et al. (2012).
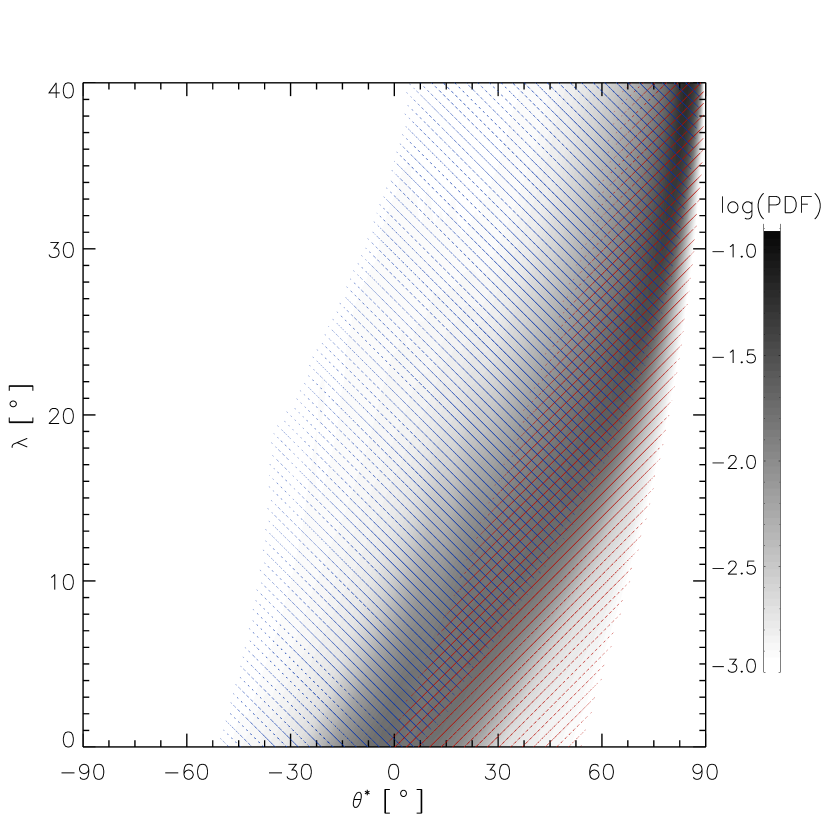
The Fig.LABEL:fig3 shows the wave power distribution of as a function of , where , for chorus waves generated at the equator. Thus, the rays that are initially oriented towards the Earth (i.e. , in blue lines) have a negative initial at the equator, whereas rays initially directed outward (i.e., , in red lines) have a positive . From this figure it can be seen that rays quickly defer outward during their propagation, as none is directed towards the Earth above . Therefore, the majority of rays generated inward intersect the direction of the local magnetic field for , which explains the observed strong population of quasi-parallel waves at these low latitudes. For large initial angles, these rays () can also propagate quasi-parallel to the magnetic field up to latitudes , whereas rays initially launched outward quickly tend to resonance cone (). However, the two ray populations quickly merge and this overlapping forms the major part of the distribution, especially at high latitudes, that propagates obliquely, which is consistent with Cluster observations Agapitov et al. (2012).
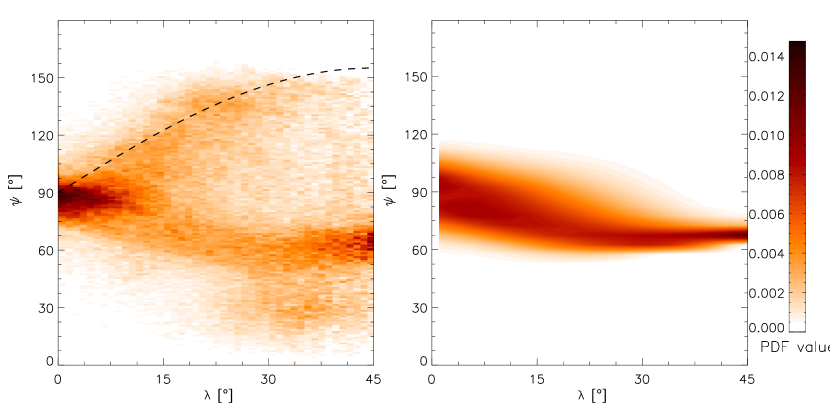
The field aligned population of waves is seen in the spacecraft data at . The ray tracing does not shows such a group of waves. This can be seen also from the angle between the spacecraft position vector and wave normal shown in Fig. 4. is distributed near at the equator, and from ray tracing decreases with to (Fig. 4b). Ray tracing well reproduces distribution from the spacecraft observations shown in Fig.4a. Chorus wave normals tend to rotate outward from the Earth due to magnetic field lines curvature and magnetic field absolute value gradient. The field aligned direction is indicated with black dashed line and the field aligned wave population is observed in distribution at . These field aligned waves cannot be obtained from the geometric optics approximation used in our paper. The Landau damping is more effective for the oblique waves and wave amplification is more effective for field aligned waves. The wave amplification and wave damping during the propagation can result in the observed differences between spacecraft observations and numerical simulations and they have to be taken into account, that will be the subject of the future work.
conclusions
In this paper we present a ray tracing technique for the cold magnetized multi-components collision-less plasma that has been developed including realistic plasma density and magnetic field models. Ray tracing was carried out assuming that the wave source is situated at equator. The initial distribution of waves in frequencies and in -vectors in the source region was chosen to correspond to statistical distribution dependencies on -vectors and frequencies obtained from observations. To this end the weight functions corresponding to distributions inferred from observations were applied to initial set of rays Breuillard et al. (2012).
Then, making use of our numerical database we show that it is possible to reconstruct chorus wave-normal distributions as a function of magnetic latitude using weight functions on equator (obtained from experiment). The results of our calculations are in good agreement with statistical distributions found using ten years observational data measured onboard Cluster spacecrafts in Agapitov et al. (2012, 2011b).
Chorus wave normal angle distribution at the equator peaks at and tends to increase fast with latitude reaching the resonance cone at and can be reflected at where the wave frequency becomes less than the local lower hybrid frequency. Chorus wave normals tend to rotate outward from the direction to the Earth due to the background magnetic field lines curvature and gradients of magnetic field and plasma density. The differences of distributions obtained from the spacecraft observations and from ray tracing can be explained by the Landau damping of the wave during the propagation which is much more effective for oblique wave normal angles. This damping tends to decrease amplitude of oblique chorus waves and results in the concentration of the wave normal distribution near field aligned direction at . Therefore the existence of oblique wave population in the outer radiation belts tends to more effective electron scattering Artemyev et al. (2012b) and decreasing of electron life-time, especially in the -shell range from 3 to 5.5 Mourenas et al. (2012c).
references
- Agapitov et al. (2010) Agapitov, O., Krasnoselskikh, V., Zaliznyak, Y., Angelopoulos, V., Le Contel, O., and Rolland, G. (2010). Chorus source region localization in the Earth’s outer magnetosphere using THEMIS measurements. In Annales Geophysicae, volume 28, pages 1377–1386. URL https://hal-insu.archives-ouvertes.fr/insu-01180462/.
- Agapitov et al. (2011a) Agapitov, O., Krasnoselskikh, V., Dudok de Wit, T., Khotyaintsev, Y., Pickett, J. S., SantolÃk, O., and Rolland, G. (2011a). Multispacecraft observations of chorus emissions as a tool for the plasma density fluctuations’ remote sensing. Journal of Geophysical Research: Space Physics (1978–2012), 116(A9).
- Agapitov et al. (2011b) Agapitov, O., Krasnoselskikh, V., Khotyaintsev, Y. V., and Rolland, G. (2011b). A statistical study of the propagation characteristics of whistler waves observed by Cluster. Geophysical Research Letters, 38(20).
- Agapitov et al. (2011c) Agapitov, O., Krasnoselskikh, V., Zaliznyak, Y., Angelopoulos, V., Le Contel, O., and Rolland, G. (2011c). Observations and modeling of forward and reflected chorus waves captured by THEMIS. Annales Geophysicae-Atmospheres Hydrospheresand Space Sciences, 29(3), 541.
- Agapitov et al. (2012) Agapitov, O., Krasnoselskikh, V., Khotyaintsev, Y. V., and Rolland, G. (2012). Correction to ???A statistical study of the propagation characteristics of whistler waves observed by Cluster??? Geophysical Research Letters, 39(24).
- Artemyev et al. (2012a) Artemyev, A., Agapitov, O., Breuillard, H., Krasnoselskikh, V., and Rolland, G. (2012a). Distribution of the electron pitch-angle diffusion rates in the radiation belts. In EGU General Assembly Conference Abstracts, volume 14, page 5192.
- Artemyev et al. (2012b) Artemyev, A., Agapitov, O., Breuillard, H., Krasnoselskikh, V., and Rolland, G. (2012b). Electron pitch-angle diffusion in radiation belts: The effects of whistler wave oblique propagation. Geophysical Research Letters, 39(8).
- Bortnik et al. (2008) Bortnik, J., Thorne, R. M., and Meredith, N. P. (2008). The unexpected origin of plasmaspheric hiss from discrete chorus emissions. Nature, 452(7183), 62–66. ISSN 0028-0836. URL http://www.nature.com/nature/journal/v452/n7183/full/nature06741.html.
- Breuillard et al. (2012) Breuillard, H., Mendzhul, D., and Agapitov, O. (2012). Effects of equatorial chorus wave normal azimuthal distribution on wave propagation. Advances in Astronomy and Space Physics, 2(2), 167–172.
- Burton and Holzer (1974) Burton, R. K. and Holzer, R. E. (1974). The Origin and Propagation of Chorus in the Outer Magnetosphere. \jgr, 79, 1014–1023.
- Gallagher et al. (2000) Gallagher, D. L., Craven, P. D., and Comfort, R. H. (2000). Global core plasma model. Journal of Geophysical Research: Space Physics, 105(A8), 18 819–18 833. ISSN 2156-2202. URL http://onlinelibrary.wiley.com/doi/10.1029/1999JA000241/abstract.
- Goldstein and Tsurutani (1984) Goldstein, B. E. and Tsurutani, B. T. (1984). Wave normal directions of chorus near the equatorial source region. \jgr, 89, 2789–2810.
- Gurnett et al. (1979) Gurnett, D. A., Anderson, R. R., Scarf, F. L., Fredricks, R. W., and Smith, E. J. (1979). Initial results from the ISEE-1 and -2 plasma wave investigation. Space Science Reviews, 23(1), 103–122. ISSN 0038-6308, 1572-9672. URL http://link.springer.com/article/10.1007/BF00174114.
- Hayakawa et al. (1984) Hayakawa, M., Yamanaka, Y., Parrot, M., and Lefeuvre, F. (1984). The wave normals of magnetospheric chorus emissions observed on board GEOS 2. \jgr, 89, 2811–2821.
- Helliwell (1967) Helliwell, R. A. (1967). A theory of discrete VLF emissions from the magnetosphere. Journal of Geophysical Research, 72(19), 4773–4790. ISSN 2156-2202. URL http://onlinelibrary.wiley.com/doi/10.1029/JZ072i019p04773/abstract.
- Mourenas et al. (2012a) Mourenas, D., Artemyev, A., Agapitov, O., and Krasnoselskikh, V. (2012a). Acceleration of radiation belts electrons by oblique chorus waves. Journal of Geophysical Research: Space Physics, 117(A10), A10 212. ISSN 2156-2202. URL http://onlinelibrary.wiley.com/doi/10.1029/2012JA018041/abstract.
- Mourenas et al. (2012b) Mourenas, D., Artemyev, A., Agapitov, O., and Krasnoselskikh, V. (2012b). Consequences of oblique chorus waves on the loss and acceleration of trapped electrons. AGU Fall Meeting Abstracts, 1, 2374.
- Mourenas et al. (2012c) Mourenas, D., Artemyev, A. V., Ripoll, J.-F., Agapitov, O. V., and Krasnoselskikh, V. V. (2012c). Timescales for electron quasi-linear diffusion by parallel and oblique lower-band chorus waves. Journal of Geophysical Research: Space Physics, 117(A6), A06 234. ISSN 2156-2202. URL http://onlinelibrary.wiley.com/doi/10.1029/2012JA017717/abstract.
- Olson and Pfitzer (1974) Olson, W. P. and Pfitzer, K. A. (1974). A quantitative model of the magnetospheric magnetic field. Journal of Geophysical Research, 79(25), 3739–3748. ISSN 2156-2202. URL http://onlinelibrary.wiley.com/doi/10.1029/JA079i025p03739/abstract.
- Omura et al. (1991) Omura, Y., Matsumoto, H., Nunn, D., and Rycroft, M. J. (1991). A review of observational, theoretical and numerical studies of VLF triggered emissions. Journal of Atmospheric and Terrestrial Physics, 53, 351–368.
- Parrot et al. (2003) Parrot, M., Santolik, O., Cornilleau-Wehrlin, N., Maksimovic, M., Harvey, C. C., and others (2003). Source location of chorus emissions observed by Cluster. In Annales Geophysicae, volume 21, pages 473–480. URL http://hal-obspm.ccsd.cnrs.fr/docs/00/32/92/34/PDF/angeo-21-473-2003.pdf.
- SantolÃk et al. (2005) SantolÃk, O., Gurnett, D. A., Pickett, J. S., Parrot, M., and Cornilleau-Wehrlin, N. (2005). Central position of the source region of storm-time chorus. Planetary and Space Science, 53(1–3), 299–305. ISSN 0032-0633. URL http://www.sciencedirect.com/science/article/pii/S0032063304001965.
- Sazhin and Hayakawa (1992) Sazhin, S. S. and Hayakawa, M. (1992). Magnetospheric chorus emissions: A review. Planetary and Space Science, 40(5), 681–697. ISSN 0032-0633. URL http://www.sciencedirect.com/science/article/pii/003206339290009D.
- Stix (1962) Stix, T. H. (1962). The Theory of Plasma Waves.
- Trakhtengerts (1999) Trakhtengerts, V. Y. (1999). A generation mechanism for chorus emission. Annales Geophysicae, 17, 95–100.
- Tsurutani and Smith (1974) Tsurutani, B. T. and Smith, E. J. (1974). Postmidnight chorus: A substorm phenomenon. \jgr, 79, 118–127.
- Tsurutani and Smith (1977) Tsurutani, B. T. and Smith, E. J. (1977). Two types of magnetospheric ELF chorus and their substorm dependences. \jgr, 82, 5112–5128.
- Yearby et al. (2011) Yearby, K., Balikhin, M., Khotyaintsev, Y. V., Walker, S., Krasnoselskikh, V., Alleyne, H., and Agapitov, O. (2011). Ducted propagation of chorus waves: Cluster observations. Annales Geophysicae, 29(9), 1629–1634.