Relaxation Dynamics of a Granular Pile on a Vertically-Vibrating Plate
Abstract
Nonlinear relaxation dynamics of a vertically-vibrated granular pile is experimentally studied. In the experiment, the flux and slope on the relaxing pile are measured by using a high-speed laser profiler. The relation of these quantities can be modeled by the nonlinear transport law assuming the uniform vibro-fluidization of an entire pile. The fitting parameter in this model is only the relaxation efficiency, which characterizes the energy conversion rate from vertical vibration into horizontal transport. We demonstrate that this value is a constant independent of experimental conditions. The actual relaxation is successfully reproduced by the continuity equation with the proposed model. Finally its specific applicability toward an astrophysical phenomenon is shown.
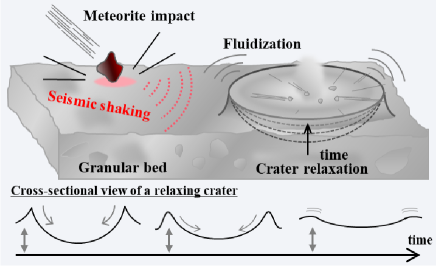
A granular pile is usually stable when its slope is less than the angle of repose . However, the structure of a pile can be relaxed by adding perturbations such as vibration. In this sense, granular-heap structure is metastable. The truly stable state under gravitational field must have a horizontally flat surface. Therefore, when subjected to perturbations, a pile shows relaxation toward horizontal structure. This type of granular relaxation is ubiquitous in many natural phenomena. For instance, the terrain development on astronomical objects covered with granular beds called regolith (e.g., asteroid Itokawa) is governed by the granular-heap relaxation Michel et al. (2009). As illustrated in Fig. 1, meteorite-impact-induced seismicity is considered as a main perturbation source, which could erase characteristic terrains such as craters Richardson et al. (2004).
In general, relaxation itself has long been an important process in complex soft matter physics Ngai (2011). One of the simplest modeling for relaxation is Fickian (liner) diffusion, which cannot explain the granular-heap relaxation Roering et al. (2001); Sánchez et al. (2007). While several models have been proposed so far Roering et al. (1999, 2001); Sánchez et al. (2007), the parameter dependence of the relaxation process has not been investigated systematically. Obviously, the relaxation property depends on various experimental conditions such as perturbation strength. Revealing the parameter dependence is necessary for both the fundamental understanding of the relaxation process and its application to natural phenomena. In this study, we perform systematic experiments and build a model which can quantitatively describe the granular-heap relaxation including the experimental parameter dependence. Besides, this paper briefly addresses the relaxation of craters by seismic shaking on a small asteroid.
So far, steady granular flows on a pile with angle steeper than have mainly been studied GDR MiDi (2004); Jop et al. (2005, 2006); Katsuragi et al. (2010). Instead, this study directly investigates the (non-steady) relaxation of a vibro-fluidized granular pile. Using a high-speed laser profiler, spatiotemporally-resolved surface profiles of a relaxing pile are precisely obtained. Based on the experimental data, a granular transport law called the Nonlinear Diffusion Transport (NDT) model is derived. We show that the NDT model can explain the entire relaxation process of the pile with only one universal parameter representing the relaxation efficiency.
| Material | (mm) | (g/cm3) | tan | Note |
|---|---|---|---|---|
| 1. Almina ball | 3.9 | A.O. | ||
| 2. Almina ball | 3.9 | A.O. | ||
| 3. Zirconia ball | 5.9 | A.O. | ||
| 4. Rough sand | 2.6 | JIS |
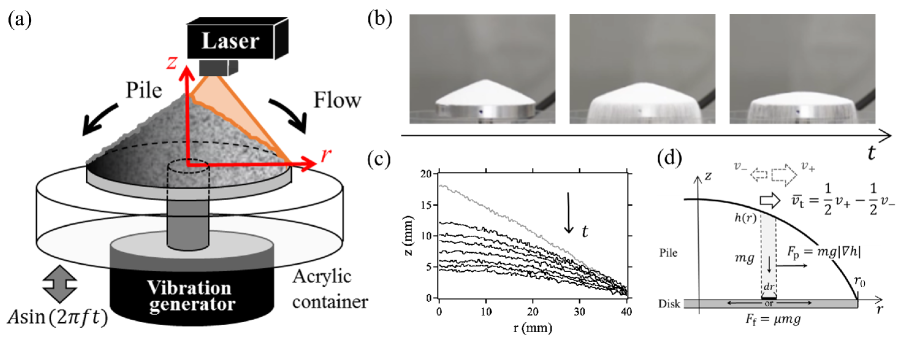
A schematic illustration of the experimental system is given in Fig. 2(a). A conical pile with the angle of repose is created on a disk using each set of granular materials with diameter mm, density g/cm3, and (Table 1). The experimental system is mounted on an electromechanical vibrator (EMIC 513-B/A). The radius of the disk is mm, and a layer of the same grain is glued on its surface. Then, sinusoidal vertical vibration is continuously applied to the disk. The amplitude and frequency are varied in the range of mm and Hz such that granular piles are destabilized. Actually, it is difficult to precisely determine the onset criterion of the fluidization. Although the maximum acceleration scaled by the gravitational acceleration seems to be the most relevant, the critical value fluctuates around depending on Tennakoon and Behringer (1998); King et al. (2000). To avoid such complexity and focus only on clearly fluidized regimes, in this study a pile is subjected to relatively strong vibration of . We perform experiments for each set of conditions three times to check the reproducibility. Once granular media begin to flow, the shape of the pile is relaxed (Fig. 2(b)). Outflowed grains are collected by an acrylic container surrounding the disk. As a unique advantage of this setup, the sidewall effect, which is difficult to be removed in usual quasi-2D flows Jop et al. (2005, 2006), does not appear at all. To measure the flow properties during the relaxation, surface profiles of the pile are continuously recorded by a high-speed laser profiler (KEYENCE LJ-V7080). Figure 2(c) shows profiles taken in the experimental condition of and () with Material 1 in Table 1. The measurement ranges are from the center to the edge of the pile along the radial direction (). The origin of the height coordinate is calibrated to the surface of the disk. In this experiment, the amplitude of vibration is gradually increased during the initial s to calmly get to stable vibration conditions without burst signals. The time when the vibration achieves a stable state is defined as s. Henceforth, these experimental conditions are used for subsequent plots unless otherwise noted.
In the analysis, to investigate the flow property, the flux and slope are measured at four points with interval mm ( mm) for a variety of time. Since the pile is relaxed axisymmetrically, the flux at and is calculated as
| (1) |
where is the height of the pile at position and time , which is measured from SM . Since the relaxation dynamics slows down as time goes on, logarithmically-increasing time bins are employed for SM , i.e., . The slope at position is calculated by the linear least-squares method using profiles from to . The relation between and is shown in Fig. 3(a). Following the simplest assumption, Fick’s law of diffusion, is proportional to . The data trend, however, suggests nonlinearity and that is not scaled only by but also depends on . To explain this complex dependence and reproduce the granular-heap relaxation, the transport model will be derived below.
First of all, let us consider the dynamics of a thin annular slice of granular media with width and height (Fig. 2(d)). For the sake of simplicity, we assume that the pile is uniformly fluidized throughout the layer due to relatively strong vibration with ; and the slice is horizontally transported on a vibrating plate like a solid block (cf. Sánchez et al. (2007)). This idea is contrastive to the shear-band structure assumed by Roering et al. Roering et al. (1999), i.e., the fluidized layer is localized only around the surface. The forces applied to a slice in motion consist of two factors: the force due to the pressure gradient and the frictional force between the slice and disk , where , is the bulk density of granular media, and is a coefficient of friction. The former always works along the positive direction of the -axis, while the latter is applied along the opposite direction of the motion. Note that hydrostatic pressure is assumed as the pile is completely fluidized; the effects of air drag and cohesion are neglected as constitutive grains are sufficiently large, dense, and dry.
As a next step, based on the idea proposed by Roering et al. Roering et al. (1999), we assume that the oscillating disk supplies energy to the pile during infinitesimal time isotropically such that the slice is able to move along both directions with equal probabilities. In other words, during the vibration attempts to transport the slice to the positive direction of the -axis with velocity and probability , while to the negative direction with velocity and probability as well. This process continues as long as vibration is applied. The similar modeling has also been developed for coarsening dynamics in a vibro-fluidized compartmentalized granular gas van der Meer et al. (2004). The important point in this modeling is that is larger than because the resistant force against the motion to the positive direction is smaller than that against the negative direction . As a result, the average transport velocity along the -axis can be written as
| (2) | |||||
where means the average work done per unit time. Here, let us suppose that a certain percentage of the vibration energy inputted vertically is used for the horizontal transport of the slice. This idea allows to take the following simple form:
| (3) |
where is a constant, and represents a characteristic vibration velocity. Using the above expressions, can finally be rewritten as
| (4) |
In this model, when , is almost proportional to , which can be interpreted as Fick’s law of diffusion. On the other hand, diverges rapidly as approaches , indicating strong nonlinearity. In the following, we call Eq. (4) the Nonlinear Diffusion Transport (NDT) model.
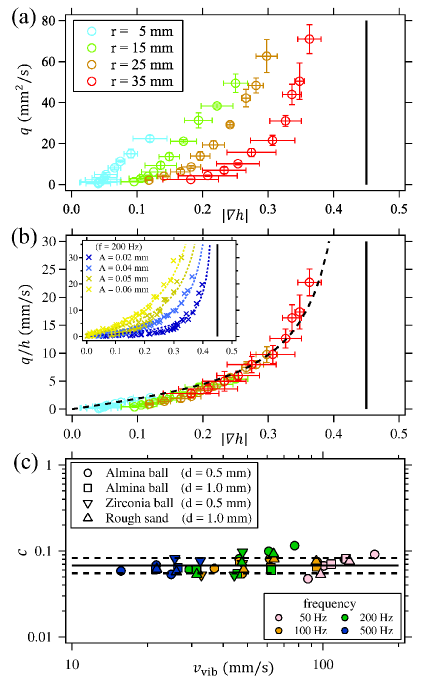
Let us verify whether the NDT model can consistently explain the experimental data. According to the above modeling, corresponds to which obeys Eq. (4). If the NDT model is correct, must be a function of only in contrast to which depends on both and (Fig. 3(a)). Figure 3(b) shows the relation between and . As expected, all the data are collapsed into a single curve, which can be fitted by Eq. (4), where the fitting parameter is only . is fixed at tan in Table 1. In spite of this simplification, the scaling of Fig. 3(b) is universal to all experimental data. The evidence is given in the inset of Fig. 3(b), which shows analysis results for various vibration conditions. All the data are also fitted well by Eq. (4).
Another point that needs to be confirmed is the parameter dependence of . The values of , which are calculated by the least-squares fitting to Eq. (4), are plotted as a function of for four granular materials (Table 1) in Fig. 3(c). seems to be independent of any experimental conditions and shows the constant value . Since indicates a velocity conversion rate from the input vertical vibration to the horizontal transport, it is natural that is less than and uniquely determined by the system itself. However, one can speculate that might depend on the mechanical properties of constituent grains (e.g., softness) and/or boundary conditions of the system. Additional studies to evaluate these effects are important future works.
Next, in order to reproduce the relaxation process of the pile, we numerically solve the equation of continuity with given by the NDT model:
| (5) |
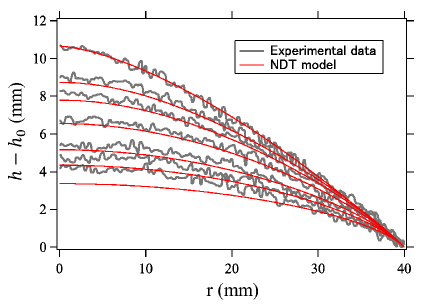
Note that the following boundary conditions are imposed from the experimental configuration: s at and , where is the thickness of a granular layer flowing out of a disk at a given time, which typically consists of a few grain diameters. The comparisons between profiles taken by a laser profiler and those computed by the NDT model are shown in Fig. 4, which are in good agreement with each other. These facts support the validity of the NDT model. Interestingly, Eq. (5) does not include the dependence on grain size . This is because the relevant length scale governing the relaxation dynamics is the height rather than in a fully-fluidized pile.
Here, limitations of the NDT model are briefly discussed. First, according to the rheological models for dense fluidized flows, granular temperature could also affects the transport velocity (e.g., Jenkins and Berzi (2012)). Although this effect is expected to be dominantly linked to vibration velocity, the correspondence has not yet been reached. The detail comparison with such rheological models is necessary to improve the model. Second, we observed that the pile reaches a “jammed” state leaving a finite slope even if submitted to vibration for a long time. As can be seen in both Figs. 3(b) and 4, model curves exhibit misfits with experimental data when slopes approach zero. These jammed states become more apparent as decreases. In this regime, inertial energy supplied to grains is insufficient to overcome potential barriers of their neighbors Jaeger et al. (1989); Roering (2004). Conversely, when the vibration is too strong, the transition into a granular-gas phase Jaeger et al. (1996) must occur, in which the NDT model is no longer suitable. The best we can say at present is that the NDT model can be applied only in the restricted range (at least ) except for low-angle conditions.
Finally we show a simple application of the NDT model toward the crater relaxation process caused by impact-induced seismic shaking (Fig. 1). Let us consider the crater erasure by a meteorite impact with diameter m onto asteroid Itokawa. By this impact, the entire surface of Itokawa is shaken with Yamada et al. (2016). The expected typical vibration velocity and duration are and s Yamada et al. (2016); SM . Then, the crater of diameter and depth is erased when the mass flow exceeds the crater volume. The order estimate of this mass balance is expressed as . By neglecting the nonlinear term in Eq. (4) which is important only for steep slopes, holds, where the typical value is tan Fujiwara et al. (2006) and Hirata et al. (2009); Katsuragi (2016). Substituting specific values into this relation, the maximum crater diameter erased by this impact-induced shaking is estimated as m. This value is comparable with actual grain (regolith) size Fujiwara et al. (2006), which means that the the accumulation of multiple impacts is necessary to erase large craters. To estimate the relaxation time scale more precisely, much more careful computation as discussed in Ref. Yamada et al. (2016) must be performed.
In summary, we have performed experiments to understand the relaxation dynamics of granular-heap structure on a vertically-vibrated plate. To explain the experimental results, we have proposed the Nonlinear Diffusion Transport (NDT) model, which describes the flux of granular particles including the dependence on experimental parameters. The fitting parameter is only the relaxation efficiency , which does not depend on experimental conditions. Considering this universality, from a rheological point of view, our experimental setup could provide a new insight to characterize frictional properties of flowing granular media under vibration. We also believe that the framework of our modeling for relaxation is potentially applicable to other experimental configurations with different heap sizes or perturbation types.
Acknowledgements.
We would like to thank S. Watanabe, H. Kumagai, S. Sirono, and T. Morota for fruitful discussions. This study has been supported by JSPS KAKENHI No. 15H03707, No. 16H04025, No. 17H05420, and No. 17J05552.References
- Michel et al. (2009) P. Michel, D. O’Brien, S. Abe, and N. Hirata, Icarus 200, 503 (2009).
- Richardson et al. (2004) J. E. Richardson, H. J. Melosh, and R. Greenberg, Science 306, 1526 (2004).
- Ngai (2011) K. L. Ngai, Relaxation and Diffusion in Complex Systems (Springer, 2011).
- Roering et al. (2001) J. J. Roering, J. W. Kirchner, L. S. Sklar, and W. E. Dietrich, Geology 29, 143 (2001).
- Sánchez et al. (2007) I. Sánchez, F. Raynaud, J. Lanuza, B. Andreotti, E. Clément, and I. S. Aranson, Phys. Rev. E 76, 060301 (2007).
- Roering et al. (1999) J. J. Roering, J. W. Kirchner, and W. E. Dietrich, Water Resour. Res 35, 853 (1999).
- GDR MiDi (2004) GDR MiDi, Eur. Phys. J. E 14, 341 (2004).
- Jop et al. (2005) P. Jop, Y. Forterre, and O. Pouliquen, J. Fluid Mech. 541, 167 (2005).
- Jop et al. (2006) P. Jop, Y. Forterre, and O. Pouliquen, Nature 441, 727 (2006).
- Katsuragi et al. (2010) H. Katsuragi, A. R. Abate, and D. J. Durian, Soft Matter 6, 3023 (2010).
- Tennakoon and Behringer (1998) S. G. K. Tennakoon and R. P. Behringer, Phys. Rev. Lett. 81, 794 (1998).
- King et al. (2000) P. J. King, M. R. Swift, K. A. Benedict, and A. Routledge, Phys. Rev. E 62, 6982 (2000).
- (13) See Supplemental Material (SM) for how to: derive Eq. (1); choose ; and assume the typical impact condition, in which each explanation is given from Sec. 1 to Sec. 3 in order. If you need the SM, please contact the corresponding author.
- van der Meer et al. (2004) D. van der Meer, K. van der Weele, and D. Lohse, J. Stat. Mech.: Theor. Exp. 2004, P04004 (2004).
- Jenkins and Berzi (2012) J. T. Jenkins and D. Berzi, Granul. Matter 14, 79 (2012).
- Jaeger et al. (1989) H. M. Jaeger, C.-h. Liu, and S. R. Nagel, Phys. Rev. Lett. 62, 40 (1989).
- Roering (2004) J. J. Roering, Earth Surf. Process. Landforms 29, 1597 (2004).
- Jaeger et al. (1996) H. M. Jaeger, S. R. Nagel, and R. P. Behringer, Rev. Mod. Phys. 68, 1259 (1996).
- Yamada et al. (2016) T. M. Yamada, K. Ando, T. Morota, and H. Katsuragi, Icarus 272, 165 (2016), and references therein.
- Fujiwara et al. (2006) A. Fujiwara, J. Kawaguchi, D. K. Yeomans, M. Abe, T. Mukai, T. Okada, J. Saito, H. Yano, M. Yoshikawa, D. J. Scheeres, O. Barnouin-Jha, A. F. Cheng, H. Demura, R. W. Gaskell, N. Hirata, H. Ikeda, T. Kominato, H. Miyamoto, A. M. Nakamura, R. Nakamura, S. Sasaki, and K. Uesugi, Science 312, 1330 (2006).
- Hirata et al. (2009) N. Hirata, O. S. Barnouin-Jha, C. Honda, R. Nakamura, H. Miyamoto, S. Sasaki, H. Demura, A. M. Nakamura, T. Michikami, R. W. Gaskell, and J. Saito, Icarus 200, 486 (2009).
- Katsuragi (2016) H. Katsuragi, Physics of Soft Impact and Cratering (Springer, Tokyo, 2016).