The Emergence and Role of Dipolar Dislocation Patterns in Discrete and Continuum Formulations of Plasticity
Abstract
The plasticity transition at the yield strength of a crystal typically signifies the tendency of dislocation defects towards relatively unrestricted motion. For an isolated dislocation the motion is in the slip plane with velocity proportional to the shear stress, while due to the long range interaction dislocation ensembles move towards satisfying emergent collective elastoplastic modes. Such collective motions have been discussed in terms of the elusively defined backstress. In this paper, we develop a two-dimensional stochastic continuum dislocation dynamics theory that clarifies the role of backstress and demonstrates a precise agreement with the collective behavior of its discrete counterpart, as a function of applied load and with only three essential free parameters. The main ingredients of the continuum theory is the evolution equations of statistically stored and geometrically necessary dislocation densities, which are driven by the long-range internal stress, a stochastic flow stress term and, finally, two local “diffusion” like terms. The agreement is shown primarily in terms of the patterning characteristics that include the formation of dipolar dislocation walls.
Crystals mainly deform through the motion of dislocations Asaro and Lubarda (2006), extended line-like defects in the crystal lattice. This sole fact can provide key explanations for the magnitude and character of uniaxial and shear strength, as well as the plastic crystalline behavior. However, the complex spatio-temporal dynamics of dislocations is elusive: It has long been known that many aspects of the stress-strain response of deformed metals are associated to collective and emergent dislocation patterning that cannot be predicted by single-dislocation features, e.g., dense dipolar wall (DDW) formation and corresponding dislocation cell walls (see for example, Refs. Chen et al. (2010a); Mughrabi et al. (1986); Schwink (1992); Hähner et al. (1998); Hughes et al. (1997, 1998); Laufer and Roberts (1966)). Also, failure due to mechanical fatigue is preceded by the formation of complex dislocation patterns that have been labeled as “vein structures”, typically observed after multiple thousands of fatigue cycles Suresh (1998); Mughbrabi et al. (1979); Walgraef and Aifantis (1985a); Kuhlmann-Wilsdorf and Laird (1980); Tabata et al. (1983). Dislocation patterning is, therefore, not only interesting in relation to analogous phenomena in statistical mechanics Goldenfeld (1992), but also it correlates with the vital technological interest of characterizing and predicting the lifetime of mechanical components Suresh (1998).
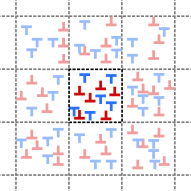
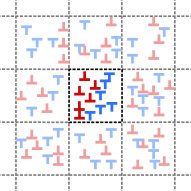
Although during the past five decades several attempts have been proposed to model pattern formation Holt (1970); Walgraef and Aifantis (1985b); Pontes et al. (2006); Salazar et al. (1995); Hansen and Kuhlmann-Wilsdorf (1986); Kratochvil and Sedlacek (2008) most of them are based on purely phenomenological arguments, so they are not derived from the properties of individual dislocations. Very recently, however, models based on statistical physics considerations have been derived establishing a direct link between a micro and mesoscale descriptions of the collective motion of dislocations Groma et al. (2003, 2006, 2010, 2015, 2016); Valdenaire et al. (2016). Yet, neither the dynamical or energetic origin of DDWs (or that of the vein structures or other specific dislocation patterns) was clarified, nor their relation to back-stress terms (induced by dislocation correlations schematically shown in Fig. 1) appearing in continuum dislocation dynamics. These latter dislocation force components are typically associated with the Bauschinger effect (the asymmetry of deformation upon reversed loading) and represent key ingredients of kinematic hardening theories Prager (1955); Asaro and Lubarda (2006); Prager (1956). In dislocation dynamics and strain-gradient plasticity theories Fleck et al. (1994), such terms involve non-linear derivatives of the local dislocation density, however their precise form has been elusive Groma et al. (2003); Zaiser et al. (2007); Dogge et al. (2015).
In this paper, we develop a stochastic continuum model based on the deterministic approach proposed by Groma et. al. Groma et al. (2016) that is able to display the spontaneous formation of dislocation walls through a dynamical transition Goldenfeld (1992), and can be used to establish basic constitutive rules for continuum dislocation plasticity theories. The key ingredients are: a particular form of dislocation backstress, a ”diffusion“ like stress term proportional to the gradient of the statistically stored dislocation density, and the flow stress being proportional to the square root of the statistically stored dislocation density (Taylor relation). Each terms arise from a consistent coarse-graining procedure and contain dimensionless prefactors (for details see below). We show that realistic DDW formation occurs only when the back and diffusion stresses are obtained from a convex functional, and in this case our continuum model becomes consistent with lower scale discrete dislocation dynamics (DDD) simulations Zhou et al. (2015). Our results, therefore, shed new light on the origin of the backstress as well as its role in dislocation patterning of bulk single crystals, and provide a successful multi-scale description of the dynamics in single-slip edge dislocation systems.
| Quantity | Unit |
|---|---|
| Distance () | |
| Stress () | |
| Plastic strain () | |
| Time () | |
| Dislocation density () |
The emergence of dislocation patterns has been investigated numerically using multiple approaches, including two-dimensional(2D) Zhou et al. (2014, 2015); Ispánovity et al. (2014, 2010); Szabó et al. (2015); Laurson et al. (2010); Rosti et al. (2010); Papanikolaou et al. (2017a); Gómez-García et al. (2006), three-dimensional (3D) DDD Papanikolaou et al. (2017b); Devincre et al. (2008), as well as continuum dislocation dynamics (CDD) El-Azab (2000); Xia and El-Azab (2015); Chen et al. (2010b, 2013). Realistic 3D-DDD have been too expensive and remain below strain in bulk conditions, while CDD has not yet captured local entanglement and backstress interactions that are expected to play critical role in patterning Hochrainer et al. (2014); Hochrainer (2016). In contrast, 2D-DDD methods not only are numerically tractable at large strains, but also a rigorous coarse graining procedure has been developed for the special case of edge dislocations in single slip Groma et al. (2003, 2010, 2016). In this paper, we will investigate the continuum description of patterns in this case.
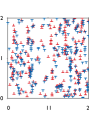
We consider a configuration of straight parallel edge dislocations, lying along the axis with their Burgers vectors pointing in the direction. We assume to track the motion of dislocations on the plane. To emulate an infinite crystalline medium, periodic boundary conditions (PBC) are applied at the borders of the square shaped simulation area of size . The Burgers vector can be written as , where , , and , with being the total number of dislocations. Throughout of this paper dimensionless units summarized in Table 1 are used where is the average total dislocation density and is an elastic constant (where and is the shear modulus and Poisson’s number, respectively). To mimic easy glide a linear relationship is assumed between the projection of the Peach-Koehler force to the glide plane ( denoted by hereafter) and the dislocation velocity in the glide direction as , where is the dislocation mobility Amodeo and Ghoniem (1990). For further details on our 2D-DDD simulations see the Supplemental Material.
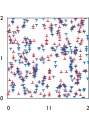
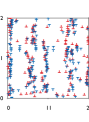
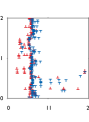
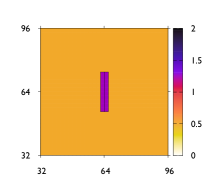
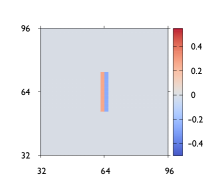
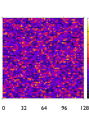
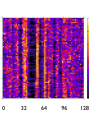
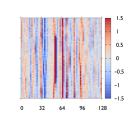
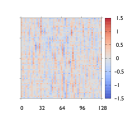
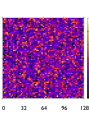
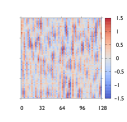
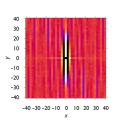
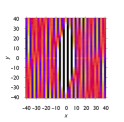
The typical evolution of a dislocation configuration can be seen in the left column of Fig. 2. At zero applied shear stress no clear pattern can be observed even though there are specific local (low energy) configurations: Opposite sign dislocations organize into short dipoles whereas those of identical sign form short vertical walls. As increases, dislocation patterns become increasingly heterogeneous with predominant long dense vertical walls Zhou et al. (2015). These DDWs are induced by the external shear stress and represent the most stable configuration that can be formed in this 2D system. Recently, it has been shown that orientation of the slip system with respect to the simulation box strongly influences the correlation properties of the dislocation network at large strains Kapetanou et al. (2015). This type of boundary condition sensitivity is common to patterning instabilities in condensed matter systems with long-range interactions Luijten et al. (2002). In all such systems, the local interaction that causes the instability is believed to be independent of the particular boundary condition to be investigated. Thus, in the present system, the emergent local order is not expected to be affected by boundary conditions at small strains.
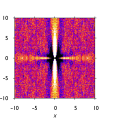
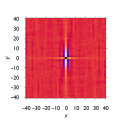
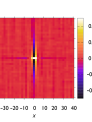
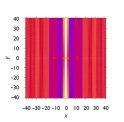
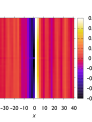
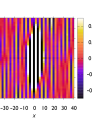
To characterize the pattern evolution in a quantitative manner the two-point spatial correlation functions are computed at different strain levels. These functions are defined as
| (1) |
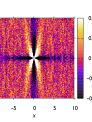
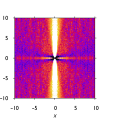
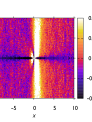
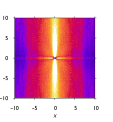
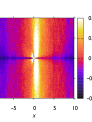
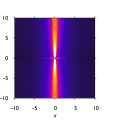
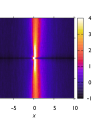
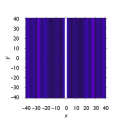
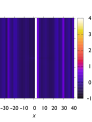
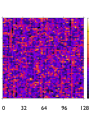
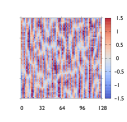
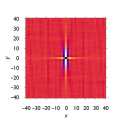
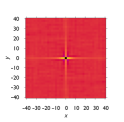
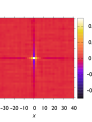
where denotes the two-point density of a sign dislocation at and a sign dislocation at Zaiser et al. (2001). In the definition the averaging with respect to is introduced since the system due to the PBC is homogeneous, so, can only depend on the relative coordinate . The correlation function for the opposite sign dislocations is defined accordingly. The numerically obtained correlation functions and their evolution with increasing strain can be seen in the center and right column of Fig. 2. These functions were averaged over 200 individual realizations, so, they represent the average patterning behavior of the DDD system. At zero strain the microstructure is dominated by vertical walls of same sign dislocations and short dipoles of opposite sign dislocations having a angle with the horizontal glide plane. The function has a slow type power-law decay along the axis, signalling a broad distribution of the wall lengths Groma et al. (2006). With increasing strain
-
(i)
the walls get longer and denser (see the change in the magnitude of the correlation function ) and
-
(ii)
the function becomes asymmetric due to the polarization of the microstructure, that is, the sign dislocations tend to be positioned to the right with respect to the sign dislocations. In addition, with accumulating strain the function extends in the vertical direction similarly to the signalling the build-up of the DDWs seen in the left column of Fig. 2.
In order to identify the precise continuum form of the DDW instability in the 2D-DDD simulations, we consider the theory that has been directly derived from the equations of motion (see SI) using a rigorous coarse graining procedure Groma et al. (2016), and is based on the continuous density fields of dislocations with identical ( or ) sign, and the corresponding total dislocation density and geometrically necessary dislocation (GND) density . The recently revisited form of the evolution equations are as follows:
| (2) | |||
| (3) |
where
| (4) |
is the long-range (or “self-consistent”) stress field of GNDs which together with the external field represents the experimentally measurable average shear stress in a small volume around . This is complemented by the gradient stress components
| (5) |
and friction stress that is as big as necessary to prevent dislocation flow and it cannot be larger than the flow stress . In the equations above, , and are dimensionless constants.
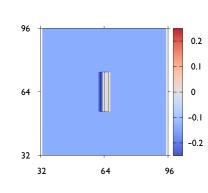
The origin of the friction stress and local gradient terms (back-stress) and (diffusion stress) is clear from the formal derivation of the theory Groma et al. (2016): They stem from the fact that dislocations are not positioned randomly but are spatially correlated, a fact that has been already postulated by Wilkens based on energetic considerations Wilkens (1969), also demonstrated in numerical simulations Zaiser et al. (2001) and in Fig. 2. Dislocation patterns themselves are also a manifestation of these correlations (see, for example, Fig. 1 for a schematic). As of the physical meaning of these terms, friction stress, and so the flow stress, is the result of the small-scale correlated substructures (most importantly, dislocation dipoles in the 2D system being studied) that may be stable against external load. Indeed, in Eqs. (2,3) is multiplied by expressing that dislocations can only be withheld by dislocations of opposite sign. Interpretation of gradient terms are more subtle: In the flowing regime they can be envisaged as a correction to the flow stress. In particular, due to the back-stress term local strength may depend on the gradient of the GND density as depicted in the sketch of Figure 1. According to the sign of parameter , the strength of the local volume in Fig. 1(b) may be larger (for ) or smaller (for ) than that of Fig. 1(a). Similar explanation can be given for the diffusion stress .
The importance of our formulation becomes transparent when one aims at building a multiscale connection and understanding of traditional plasticity theories of constitutive formulations of backstress fields to discrete dislocation formulations Asaro and Lubarda (2006). In traditional formulations, the most common approach involves the modeling of backstress in a particular slip system, as a correction to the shear stress , that displays a typical evolution equation with direct hardening and dynamic recovery coefficients respectively (see for example Ref. Morrissey et al. (2001)):
| (6) |
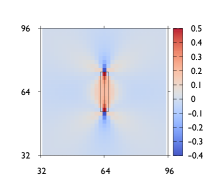
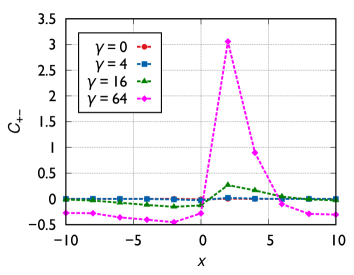
where are the shear strain and strain rates in the slip system. This equation has a natural, intuitive and experimentally verifiable explanation in terms of polycrystalline, grain-boundary dominated plasticity, since it is transparent that dislocations that “cross” grain-boundaries should face an opposite-signed, discontinuous resistance when loaded in the opposite direction. However, in dislocation ensembles, such explanations were elusive and vague, especially since continuum dislocation density theories desire continuous, analytic terms if not required otherwise. Nevertheless, in the single-slip theory we have developed, it is transparent how the -term in Eq. (6) emerges, without the particular need of non-analytic mathematical terms. As shown in Fig. 3, the response of a continuum dipolar wall in our theory contains all the ingredients that were constitutively assumed in traditional multiscale formulations: If a positive-signed dislocation moves across the wall, it would have an opposite-signed resistance if moved in opposite directions.


The numerical implementation is based on the phase-field functional:
| (7) |
where is the mean-field stored elastic energy of the system (measured in units of ) Groma et al. (2016), and is a constant that does not appear in the evolution equations. It was shown before that Eqs. (2,3) can be derived from Eq. (7) assuming that and that can only decrease during the evolution of the system Groma et al. (2016). In the present implementation, densities are discretized on a regular grid of cell size , and the flow stress is replaced by a local stochastic variable (representing the fluctuations of the underlying dislocation microstructure at every cell). For the distribution of the flow stress, in accordance with recent DDD results, a Weibull distribution is used with shape parameter 1.4 and scale parameter Ispánovity et al. (2017). We apply extremal dynamics: At every timestep, dislocation activity takes place at the site where decrease in is the largest and this consists of a quantum of dislocation flux (of either positive or negative dislocations) flowing through the cell boundary. If no such cell exists, external stress is increased until one cell is triggered. Further details of the implementation are summarized in the Supplemental Material. In the rest of this paper this model is refered to as stochastic continuum dislocation dynamics (SCDD).
The continuum theory does not yield exact values for the parameters , , and ; one must, therefore, consider them as fitting parameters. The results of DDD simulations summarized above, however, give insight on possible values. As seen in Fig. 2 the strongest possible dislocation configuration is the dipolar wall structure. According to Fig. 1 this might imply the necessity of the back-stress term and that . However, according to the linear stability analysis of Eqs. (2,3), in the absence of stochastic terms, which is discussed in Ref. Groma et al. (2016), one may conclude that if or either or is negative, then all perturbations are unstable, and the fastest growing perturbation is seemingly the largest possible wave-vector where is the minimum-possible Burgers vector magnitude. This implies that in such cases the wavelength of the instability approaches the lattice scale, and one would expect a dislocation pattern where positive/negative dislocation walls arrange in a type instability. In the following, that is exactly what we observe. Moreover, if and , resulting that the phase field functional given by Eq. (7) is convex, then the linear stability analysis of Ref. Groma et al. (2016) concludes that there is an emergent wavelength selection for a periodic pattern that should appear. However, in the presence of quenched stochastic terms, such as the ones considered both in the presented DDD and SCDD models, it is expected that such instabilities would be suppressed by the quenched disorder, which typically takes the form of a stochastic flow stress term. The inclusion of a stochastic flow stress term (such as the one in this work) is critical to suppress non-linear dynamical instabilities that are tied to the particular deterministic dynamical equations and thus, non-generic, and probably this difference may explain particularly different conclusions of our work compared to prior efforts on analogous questions Wu et al. (2018).
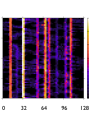
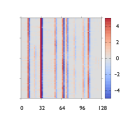
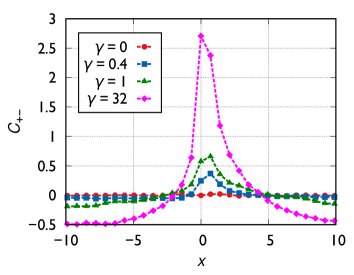
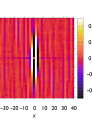
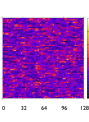
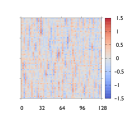
In accordance with our 2D-DDD simulations, at a random pattern of and is assumed, and initially a relaxation step is performed at . Then, the external stress is quasi-statically increased. The two left columns of Fig. 4 depict this evolution in terms of the total and GND densities ( and , respectively) for a given parameter set (, , , ). Analogous behavior is obtained between DDD and SCDD in the evolution of both total and GND profiles: short vertical DDWs form in the initial phases of deformation which then merge and extend in the vertical direction upon increasing strain. To descibe the patterns in more detail, the correlation functions and were also calculated and can be seen in the right two columns of Fig. 4. Although fine details of the correlation functions cannot be reproduced with a continuum method defined on a coarse mesh, the evolution of these functions is remarkably similar to the DDD case (seen in Fig. 2), however, pattern development is somewhat delayed in the SCDD (also note the difference in the spatial scale between DDD and SCDD results). In particular, at strain the configuration consists of short vertical walls of same sign dislocations and short dislocation dipoles of opposite sign having an angle of 45 degrees with the axis. As the stress and strain increases the vertical walls become more extended and strong asymmetry develops in the correlation function signaling the presence of DDWs. To quantitatively compare the polarization due to the asymmetry in between DDD and SCDD we consider the spatial average of along the vertical direction as
| (8) |
which measures the polarization of individual configurations. Indeed Fig. 5 shows that a strong asymmetry emerges upon plastic deformation for both models. In addition, a quick, exponential decay follows the peak in the domain, with a characteristic distance of approx. 5 average dislocation spacings. This length scale can be identified with the characteristic width of the DDWs. We identify this asymmetry as the most basic origin of the Bauschinger effect Abel and Muir (1972) as it will be discussed below.
We now address the role of SCDD parameters in the patterning instability. Figure 6 plots the dependence of typical patterns and the corresponding correlation functions on the coefficients of the gradient terms and and the average strength of the yield threshold . As seen, in the absence of gradient terms () the -type instability discussed above can be clearly observed (second row). This behavior is, in agreement with the theory, induced by the friction stress term and is at odds with the patterns of DDD and demonstrates the necessity of the inclusion of gradient terms. The third row of Fig. 6 shows the effect of : the increased strength of the GND gradient depicted in Fig. 1 leads to even stronger instability, again in agreement with the linear stability analysis of Ref. Groma et al. (2016). As of the role of the other parameters, we first recall that is a diffusive term in the total dislocation density , so increasing the value of leads to smoothening of the dislocation patterns (see the 4th row of Fig. 6) while would lead to anti-diffusion and the immediate blow-up of the pattern (not shown). The effect of decreased yield strength is seen in the last row of Fig. 6: one observes weaker patterns and polarization and the increase of would lead to the strengthening of the instability. To summarize, it is evident that in order to obtain realistic patterns and is required and both too large and too small values of should be avoided. A more detailed analysis will be published elsewhere.


It is instructive to compare the continuum plasticity theory with general elastoplastic constitutive models and in particular, with those of kinematic hardening Asaro and Lubarda (2006). The backstress term appearing therein has the phenomenological role of modeling the Bauschinger effect observed at reversed loading with the appropriate translation of the yield surface. In this paper, we showed that there is an explicit correspondence: since in Eqs. (2,3) can also be considered as an asymmetric correction to , and using the identity , with the GND density connected to the shear component of the plastic strain rate, one arrives at that is analogous to the phenomenological rate equation of Melan and Prager () Melan (1938); Prager (1961) (the appearance of the second derivative reflects the strain-gradient origin of the Bauschinger effect and the backstress in microscopically derived continuum theories of dislocation behavior). The simulations presented above, therefore, emphasize the microscopic origin of the backstress: The asymmetry of the yield surface in kinematic hardening is the result of the bulid-up of asymmetric dislocation sub-structures (polarized walls in the present set-up). Furthermore, backstress terms are also used in gradient plasticity theories to account for the short-range interactions in pile-ups close to grain boundaries Shizawa and Zbib (1999). Such terms exhibit the same form as Eq. (5) also with a positive dimensionless prefactor.
In the case of SCDD the picture that emerges is as follows: the DDWs formed during plastic deformation are in fact two GND pile-ups piling up against each other. The instability at the center is due to the flow stress which also provides the great strength of such structures. However, backstress terms are also required to suppress the instability discussed in the paper and to provide a length-scale for the pile-up widths.
In summary, SCDD does not only provide precise description of its microscopic DDD counterpart, thus representing a successful multi-scale step, but it also synthesizes previous theoretical approaches of dislocation pattern formation, kinematic hardening, and strain gradient plasticity in a simple 2D setting. By identifying the physical interpretation and key role of the strain gradient terms our results may serve as a starting point for more complex 3D implementations.
We thank Michael Zaiser for fruitful discussions. This work has been supported by the National Research, Development and Innovation Office of Hungary (PDI and IG, project Nos. NKFIH-K-119561 and NKFIH-KH-125380), the Czech Science Foundation (PDI, project No. 15-10821S) and by the U.S. Department of Energy, Office of Sciences, Basic Energy Sciences, DE-SC0014109 (SP). This work was completed in the ELTE Institutional Excellence Program (1783-3/2018/FEKUTSRAT) supported by the Hungarian Ministry of Human Capacities. PDI is also supported by the ÚNKP-18-4 New National Excellence Program of the Hungarian Ministry of Human Capacities and by the János Bolyai Scholarship of the Hungarian Academy of Sciences.
References
- Asaro and Lubarda (2006) R. Asaro and V. Lubarda, Mechanics of solids and materials (Cambridge University Press, 2006).
- Chen et al. (2010a) Y. S. Chen, W. Choi, S. Papanikolaou, and J. P. Sethna, Physical review letters 105, 105501 (2010a).
- Mughrabi et al. (1986) H. Mughrabi, T. Ungar, W. Kienle, and M. Wilkens, Philosophical magazine A 53, 793 (1986).
- Schwink (1992) C. Schwink, Scripta metallurgica et materialia 27, 963 (1992).
- Hähner et al. (1998) P. Hähner, K. Bay, and M. Zaiser, Physical review letters 81, 2470 (1998).
- Hughes et al. (1997) D. Hughes, Q. Liu, D. Chrzan, and N. Hansen, Acta materialia 45, 105 (1997).
- Hughes et al. (1998) D. Hughes, D. Chrzan, Q. Liu, and N. Hansen, Physical review letters 81, 4664 (1998).
- Laufer and Roberts (1966) E. Laufer and W. Roberts, Philosophical Magazine 14, 65 (1966).
- Suresh (1998) S. Suresh, Fatigue of materials (Cambridge university press, 1998).
- Mughbrabi et al. (1979) H. Mughbrabi, F. u. Ackermann, and K. Herz, “Persistent slipbands in fatigued face-centered and body-centered cubic metals,” in Fatigue Mechanisms (ASTM International, 1979).
- Walgraef and Aifantis (1985a) D. Walgraef and E. C. Aifantis, Journal of applied physics 58, 688 (1985a).
- Kuhlmann-Wilsdorf and Laird (1980) D. Kuhlmann-Wilsdorf and C. Laird, Materials Science and Engineering 46, 209 (1980).
- Tabata et al. (1983) T. Tabata, H. Fujita, M.-A. Hiraoka, and K. Onishi, Philosophical Magazine A 47, 841 (1983).
- Goldenfeld (1992) N. Goldenfeld, Lectures on phase transitions and the renormalization group (Addison-Wesley, Advanced Book Program, Reading, 1992).
- Holt (1970) D. L. Holt, J. Appl. Phys 41, 3197 (1970).
- Walgraef and Aifantis (1985b) D. Walgraef and E. Aifantis, J. Appl. Phys. 58, 688 (1985b).
- Pontes et al. (2006) J. Pontes, D. Walgraef, and E. C. Aifantis, Int. J. Plasti. 22, 1486 (2006).
- Salazar et al. (1995) J. M. Salazar, R. Fournet, and N. Banal, Acta Metall. Mater. 43, 1127 (1995).
- Hansen and Kuhlmann-Wilsdorf (1986) N. Hansen and D. Kuhlmann-Wilsdorf, Mater. Sci. Eng. 81, 141 (1986).
- Kratochvil and Sedlacek (2008) J. Kratochvil and R. Sedlacek, Phys. Rev. B 77 (2008), 10.1103/PhysRevB.77.134102.
- Groma et al. (2003) I. Groma, F. Csikor, and M. Zaiser, Acta Materialia 51, 1271 (2003).
- Groma et al. (2006) I. Groma, G. Györgyi, and B. Kocsis, Phys. Rev. Lett. 96, 165503 (2006).
- Groma et al. (2010) I. Groma, G. Györgyi, and P. D. Ispánovity, Philos. Mag. 90, 3679 (2010).
- Groma et al. (2015) I. Groma, Z. Vandrus, and P. D. Ispánovity, Physical Review Letters 114, 015503 (2015).
- Groma et al. (2016) I. Groma, M. Zaiser, and P. D. Ispánovity, Physical Review B 93, 214110 (2016).
- Valdenaire et al. (2016) P.-L. Valdenaire, Y. Le Bouar, B. Appolaire, and A. Finel, Physical Review B 93, 214111 (2016).
- Prager (1955) W. Prager, Proceedings of the Institution of Mechanical Engineers 169, 41 (1955).
- Prager (1956) W. Prager, J. Applied Mechanics 23, 482 (1956).
- Fleck et al. (1994) N. Fleck, G. Muller, M. Ashby, and J. Hutchinson, Acta Metallurgica et Materialia 42, 475 (1994).
- Zaiser et al. (2007) M. Zaiser, N. Nikitas, T. Hochrainer, and E. Aifantis, Philosophical Magazine 87, 1283 (2007).
- Dogge et al. (2015) M. M. W. Dogge, R. H. J. Peerlings, and M. G. D. Geers, Advanced Modeling and Simulation in Engineering Sciences 2, 29 (2015).
- Zhou et al. (2015) C. Zhou, C. Reichhardt, C. J. O. Reichhardt, and I. J. Beyerlein, Scientific Reports 5, 8000 (2015).
- Zhou et al. (2014) C. Zhou, C. J. Olson Reichhardt, C. Reichhardt, and I. Beyerlein, Physics Letters A 378, 1675 (2014).
- Ispánovity et al. (2014) P. D. Ispánovity, L. Laurson, M. Zaiser, I. Groma, S. Zapperi, and M. J. Alava, Physical review letters 112, 235501 (2014).
- Ispánovity et al. (2010) P. D. Ispánovity, I. Groma, G. Györgyi, F. F. Csikor, and D. Weygand, Physical review letters 105, 085503 (2010).
- Szabó et al. (2015) P. Szabó, P. D. Ispánovity, and I. Groma, Physical Review B 91, 054106 (2015).
- Laurson et al. (2010) L. Laurson, M.-C. Miguel, and M. J. Alava, Phys. Rev. Lett. 105, 015501 (2010).
- Rosti et al. (2010) J. Rosti, J. Koivisto, L. Laurson, and M. J. Alava, Phys. Rev. Lett. 105, 100601 (2010).
- Papanikolaou et al. (2017a) S. Papanikolaou, H. Song, and E. Van der Giessen, Journal of the Mechanics and Physics of Solids 102, 17 (2017a).
- Gómez-García et al. (2006) D. Gómez-García, B. Devincre, and L. P. Kubin, Physical Review Letters 96, 125503 (2006).
- Papanikolaou et al. (2017b) S. Papanikolaou, Y. Cui, and N. Ghoniem, arXiv:1705.06843 [cond-mat] (2017b), arXiv: 1705.06843.
- Devincre et al. (2008) B. Devincre, T. Hoc, and L. Kubin, Science 320, 1745 (2008).
- El-Azab (2000) A. El-Azab, Physical Review B 61, 11956 (2000).
- Xia and El-Azab (2015) S. Xia and A. El-Azab, Modelling and Simulation in Materials Science and Engineering 23, 055009 (2015).
- Chen et al. (2010b) Y. S. Chen, W. Choi, S. Papanikolaou, and J. P. Sethna, Physical Review Letters 105, 105501 (2010b).
- Chen et al. (2013) Y. S. Chen, W. Choi, S. Papanikolaou, M. Bierbaum, and J. P. Sethna, International Journal of Plasticity Microstructure-based Models of Plastic Deformation, 46, 94 (2013).
- Hochrainer et al. (2014) T. Hochrainer, S. Sandfeld, M. Zaiser, and P. Gumbsch, Journal of the Mechanics and Physics of Solids 63, 167 (2014).
- Hochrainer (2016) T. Hochrainer, Journal of the Mechanics and Physics of Solids 88, 12 (2016).
- Amodeo and Ghoniem (1990) R. J. Amodeo and N. M. Ghoniem, Physical Review B 41, 6958 (1990).
- Kapetanou et al. (2015) O. Kapetanou, D. Weygand, and M. Zaiser, Journal of Statistical Mechanics: Theory and Experiment 2015, P08009 (2015).
- Luijten et al. (2002) E. Luijten, M. E. Fisher, and A. Z. Panagiotopoulos, Physical Review Letters 88, 185701 (2002).
- Zaiser et al. (2001) M. Zaiser, M.-C. Miguel, and I. Groma, Phys. Rev. B 64, 224102 (2001).
- Wilkens (1969) M. Wilkens, Acta Metall. 17, 1155 (1969).
- Morrissey et al. (2001) R. Morrissey, D. McDowell, and T. Nicholas, International Journal of Fatigue 23, 55 (2001).
- Ispánovity et al. (2017) P. D. Ispánovity, D. Tüzes, P. Szabó, M. Zaiser, and I. Groma, Physical Review B 95, 054108 (2017).
- Wu et al. (2018) R. Wu, D. Tüzes, P. D. Ispánovity, I. Groma, T. Hochrainer, and M. Zaiser, Phys. Rev. B 98, 054110 (2018).
- Abel and Muir (1972) A. Abel and H. Muir, Philosophical Magazine 26, 489 (1972).
- Melan (1938) E. Melan, Ing.-Arch. 8, 116 (1938).
- Prager (1961) W. Prager, Introduction to Mechanics of Continua (Ginn and Company, Boston, MA, 1961).
- Shizawa and Zbib (1999) K. Shizawa and H. M. Zbib, International Journal of Plasticity 15, 899 (1999).