Search for very-high-energy gamma-ray emission from the microquasar Cygnus X-1 with the MAGIC telescopes
Abstract
The microquasar Cygnus X-1 displays the two typical soft and hard X-ray states of a black-hole transient. During the latter, Cygnus X-1 shows a one-sided relativistic radio-jet. Recent detection of the system in the high energy (HE; MeV) gamma-ray range with Fermi-LAT associates this emission with the outflow. Former MAGIC observations revealed a hint of flaring activity in the very high-energy (VHE; GeV) regime during this X-ray state. We analyze hr of Cygnus X-1 data taken with the MAGIC telescopes between July 2007 and October 2014. To shed light on the correlation between hard X-ray and VHE gamma rays as previously suggested, we study each main X-ray state separately. We perform an orbital phase-folded analysis to look for variability in the VHE band. Additionally, to place this variability behavior in a multiwavelength context, we compare our results with Fermi-LAT, AGILE, Swift-BAT, MAXI, RXTE-ASM, AMI and RATAN-600 data. We do not detect Cygnus X-1 in the VHE regime. We establish upper limits for each X-ray state, assuming a power-law distribution with photon index . For steady emission in the hard and soft X-ray states, we set integral upper limits at 95% confidence level for energies above 200 GeV at photons cm-2s-1 and photons cm-2s-1, respectively. We rule out steady VHE gamma-ray emission above this energy range, at the level of the MAGIC sensitivity, originating in the interaction between the relativistic jet and the surrounding medium, while the emission above this flux level produced inside the binary still remains a valid possibility.
keywords:
gamma rays: general – binaries: general – X-rays: binaries – X-rays: individual (Cygnus X-1, Cyg X-1) – Stars: black holes – Stars: individual (HD 226868)1 Introduction
Cygnus X-1 is one of the brightest and best studied X-ray sources in our Galaxy and the first identified stellar-mass black hole (BH) X-ray binary system. Discovered in early stage of the X-ray astronomy (Bolton, 1972), the system is located in the Cygnus region (, ) at a distance of kpc from the Earth (Reid et al., 2011). It is comprised of a () M⊙ BH and a O9.7 Iab type supergiant companion star with a mass of () M⊙ (Orosz et al., 2011). Nevertheless, the most plausible mass range of the donor star has been recently increased to 25-35 M⊙ by Ziółkowski (2014). The orbit is almost circular (, Orosz et al. 2011) with a d period (, Brocksopp et al. 1999b) and an inclination angle of the orbital plane to our line of sight of (Orosz et al., 2011). The superior conjunction of the compact object, when the companion star is interposed between the BH and the observer, corresponds to orbital phase 0, assuming the ephemerides =52872.788 HJD taken from Gies et al. (2008). The assumption that Cyg X-1 ranks among the microquasars was accepted after the detection, by the VLBA instrument, of a highly collimated one-sided relativistic radio-jet that extends mas from the source (opening angle and velocity 0.6c, Stirling et al. 2001). This jet is thought to create a 5 pc diameter ring-like structure observed in radio that extends up to cm from the BH (Gallo et al., 2005).
The compact object accretes material through an accretion disk from the supergiant companion star. Cyg X-1 displays the two principal spectral X-ray states of a BH transient system that can be divided according to the dominance level of a power-law component and a thermal component at lower keV energies (Tanaka & Shibazaki, 1996): the hard state (HS) and the soft state (SS; Esin et al. 1998). The HS is dominated by a power-law photon distribution (with ) with a high-energy exponential cutoff at keV (Gierlinski et al., 1997). It is thought to be produced by Comptonization of thermal photons from the accretion disk by high-energy electrons in the so-called corona, hot ( K) plasma at the inner region of the accretion flow (Coppi, 1999). The thermal component is negligible during this state. On the other side, the spectral energy distribution of the SS is characterized by a dominant thermal component that peaks at keV, emitted mainly in the inner region of the accretion disk that extends down to the last stable orbit, and a softer power-law tail. In the transition between these two principal X-ray spectral states, an intermediate state (IS) occurs that lasts only a few days (Grinberg et al., 2013). For a comprehensive review on the subject, see Done et al. (2007).
The X-ray emission from Cyg X-1 during its spectrally hard state is correlated with the radio emission originating in the relativistic jets (Gallo et al., 2003). During the HS, the jet is persistent and steady, except for some unusual flares (Fender et al., 2006) whereas, once the source enters in the SS, the jet may become unstable giving rise to a rapid jet Lorentz factor increase that originates an internal shock inside the outflow before being disrupted (Fender et al., 2004). In this SS state, the radio emission is not detected (Brocksopp et al., 1999a).
Generally, X-ray binaries experience flux periodicity with the orbital period at different wavelengths. Cyg X-1 shows this kind of modulation both in X-ray and radio wavelengths (Wen et al. 1999, Brocksopp et al. 1999a, Szostek & Zdziarski 2007), originating in absorption and/or scattering of the radiation from the compact object by the wind of the donor star. Besides this orbital modulation, several X-ray binary systems also present flux variations at much longer periods than their respective orbital period, known as superorbital modulation, that is thought to be caused by the precession of the accretion disk and/or jet (Poutanen et al., 2008). Cyg X-1 shows an X-ray superorbital period of d, as suggested by Rico (2008) and confirmed by Zdziarski et al. (2011).
Observations with COMPTEL during Cyg X-1 SS suggested, for the first time, the existence of a non-thermal spectral component beyond MeV (McConnell et al., 2002). This result gave rise to an increase of the interest for this source in the gamma-ray regime. Nevertheless, observations with INTEGRAL could not confirm the existence of this MeV tail in the SS, but probed, in turn, the presence of non-thermal hard emission during the HS (Rodriguez et al., 2015). INTEGRAL/IBIS also reported a hard tail in the HS which was shown to be polarized in the energy range of 0.4-2 MeV at a level of % with a polarization angle of ()∘ (Laurent et al. 2011, Jourdain et al. 2012).
The recent detection of high energy (HE; MeV) gamma rays from Cyg X-1 associated with the jets (Zanin et al., 2016), using 7.5 yr of PASS8 Fermi-LAT data, provided the first significant detection of HE gamma rays in a BH binary system. This steady emission was previously hinted by Malyshev et al. (2013). Zanin et al. (2016) show that Cyg X-1 displays persistent HE emission during the HS (at ). This emission was suggested to be produced outside the corona (at distances cm from the BH), most likely from the jets. This was also pointed out by the fact that the detection happens only in the HS. A hint of gamma-ray orbital modulation was also found: the HE emission seems to happen when Cyg X-1 was at phases that cover the superior conjunction (between 0.75 and 0.25). This modulation, if confirmed, excludes the interaction between the jets and the surrounding medium at large scales as the GeV emitter and suggests anisotropic inverse Compton (IC) on stellar photons, which constrains the emission region to – cm from the compact object. The overall spectrum from Zanin et al. (2016) is well fitted by a power-law function with a photon index of and extends from 60 MeV up to GeV. Besides this persistent emission, the source underwent 3 preceding episodes of transient emission detected by AGILE. The first two flaring events occurred during the HS on October 16 2009, with an integral flux of ( photons cm-2 s-1 between 0.1 and 3 GeV (Sabatini et al., 2010), and on March 24 2010, with an integral flux of photons cm-2 s-1 for energies above 100 MeV (Bulgarelli et al., 2010). The third one, on June 30 2010 with a flux of ( photons cm-2 s-1 also for energies above 100 MeV (Sabatini et al., 2013), took place during the IS when the source was leaving the HS but just before an atypical radio flare (Rushton et al., 2012). Each of these episodes lasted only 1–2 days.
Although the gamma-ray spectrum does not seem to harden above GeV, former MAGIC observations in the very high energy (VHE; GeV) band yielded a 4.1 evidence for VHE activity from the Cyg X-1 direction (referred as MAGIC hint, hereafter). These MAGIC observations were carried out between June and November 2006 for 40 hr with the first stand-alone MAGIC telescope (MAGIC I). Although no significant excess for steady gamma-ray emission was found, during the daily analysis the MAGIC hint was detected after 80 min on September 24 2006 (MJD= 54002.96; Albert et al. 2007), at the maximum of the superorbital modulation of the source and simultaneously with the rising phase of a hard X-ray flare detected by INTEGRAL, Swift/BAT and RXTE-ASM (Malzac et al., 2008). The energy spectrum computed for this day is well reproduced by a power-law of d/d=(TeVTeV-1cm-2s-1. The VERITAS Collaboration observed Cyg X-1 in 2007 without any significant detection (Guenette et al., 2009).
In this paper we report observations of Cyg X-1 performed with the MAGIC telescopes between 2007 and 2014. Cyg X-1 was observed focusing on the HS concurrently with a high hard X-ray flux in order to perform observations under the same conditions as those during the MAGIC hint. Section 2 describes the technical conditions of the MAGIC telescopes for each period, the observations of the source and data analysis. Section 3 reports the results obtained with MAGIC. We searched for steady gamma-ray emission using the entire data sample as well as splitting the data according to the spectral state. We also looked for signal in an orbital phase-folded analysis in both main X-ray states. Due to the variability that Cyg X-1 presents, daily analysis was also carried out and studied within a multiwavelength context. The physical interpretation and conclusions are given in Section 4.
| Date | Eff. Time | Zd | Spectral | Obs. | |
|---|---|---|---|---|---|
| [yyyy mm dd] | [MJD] | [hr] | [∘] | State | conditions |
| 2007 07 13 | 54294 | 1.78 | 6.5-17.0 | ||
| 2007 09 19 | 54362 | 0.71 | 25.1-50.8 | ||
| 2007 09 20 | 54363 | 1.43 | 21.3-40.9 | ||
| 2007 10 05 | 54378 | 0.85 | 6.5-26.4 | ||
| 2007 10 06 | 54379 | 1.85 | 6.4-25.8 | ||
| 2007 10 08 | 54381 | 1.95 | 17.8-43.1 | HS | MONOwobble |
| 2007 10 09 | 54382 | 0.77 | 9.6-34.3 | ||
| 2007 10 10 | 54383 | 2.26 | 6.9-33.3 | ||
| 2007 10 11 | 54384 | 0.76 | 11.1-33.3 | ||
| 2007 11 05 | 54409 | 0.58 | 34.2-48.6 | ||
| 2007 11 06 | 54410 | 0.96 | 20.0-33.2 | ||
| 2008 07 02 | 54649 | 4.24 | 6.5-30.1 | ||
| 2008 07 03 | 54650 | 3.26 | 6.5-30.3 | ||
| 2008 07 04 | 54651 | 4.27 | 6.5-30.1 | ||
| 2008 07 05 | 54652 | 4.15 | 6.4-36.1 | ||
| 2008 07 06 | 54653 | 3.75 | 6.5.36.3 | HS | MONOon/off |
| 2008 07 07 | 54654 | 3.69 | 6.5-37.4 | ||
| 2008 07 08 | 54655 | 3.94 | 6.5-34.1 | ||
| 2008 07 09 | 54656 | 3.06 | 6.5-33.8 | ||
| 2008 07 10 | 54657 | 2.89 | 6.5-36.8 | ||
| 2008 07 11 | 54658 | 1.18 | 6.5-30.1 | ||
| 2008 07 09 | 54656 | 0.33 | 28.5-33.5 | ||
| 2008 07 10 | 54657 | 0.39 | 21.5-36.5 | ||
| 2008 07 11 | 54658 | 0.32 | 14.8-19.6 | ||
| 2008 07 12 | 54659 | 2.51 | 6.5-31.0 | ||
| 2008 07 24 | 54671 | 0.62 | 13.0-19.6 | ||
| 2008 07 25 | 54672 | 0.63 | 8.4-14.4 | HS | MONOwobble |
| 2008 07 26 | 54673 | 0.84 | 6.5-9.1 | ||
| 2008 07 27 | 54674 | 0.30 | 9.5-12.7 | ||
| 2009 06 30 | 55012 | 3.50 | 6.0-30.0 | ||
| 2009 07 01 | 55013 | 2.63 | 6.0-30.0 | ||
| 2009 07 02 | 55014 | 1.83 | 6.0-30.0 | ||
| 2009 07 05 | 55017 | 0.22 | 25.0-35.0 | ||
| 2009 10 08 | 55112 | 0.26 | 6.1-14.3 | ||
| 2009 10 10 | 55114 | 0.67 | 20.0-32.6 | ||
| 2009 10 11 | 55115 | 2.03 | 6.0-40.4 | ||
| 2009 10 12 | 55116 | 2.34 | 6.9-42.4 | ||
| 2009 10 13 | 55117 | 0.95 | 26.0-41.2 | ||
| 2009 10 14 | 55118 | 1.98 | 7.5-40.0 | ||
| 2009 10 16 | 55120 | 1.37 | 7.5-40.0 | ||
| 2009 10 17 | 55121 | 0.96 | 7.5-40.0 | ||
| 2009 10 18 | 55122 | 1.60 | 7.5-40.0 | HS | STEREOpre |
| 2009 10 19 | 55123 | 0.68 | 7.5-40.0 | ||
| 2009 10 21 | 55125 | 1.99 | 7.5-40.0 | ||
| 2009 11 06 | 55141 | 0.37 | 7.5-40.0 | ||
| 2009 11 07 | 55142 | 0.64 | 7.5-40.0 | ||
| 2009 11 13 | 55148 | 0.89 | 7.5-40.0 | ||
| 2010 03 26 | 55281 | 0.78 | 38.5-50.0 | ||
| 2011 05 12 | 55693 | 1.35 | 12.3-42.1 | ||
| 2011 05 13 | 55694 | 1.20 | 9.1-29.0 | ||
| 2014 09 17 | 56917 | 2.55 | 6.8-38.4 | ||
| 2014 09 18 | 56918 | 1.29 | 6.3-26.5 | ||
| 2014 09 20 | 56920 | 2.38 | 6.0-38.0 | SS | STEREOpost |
| 2014 09 23 | 56923 | 3.00 | 6.0-39.0 | ||
| 2014 09 24 | 56924 | 3.26 | 6.6-37.5 | ||
| 2014 09 25 | 56925 | 1.81 | 6.2-39.0 | ||
2 Observations and Data Analysis
MAGIC is a stereoscopic system consisting of two 17 m diameter imaging atmospheric Cherenkov telescopes (IACTs) located in El Roque de los Muchachos in the Canary island of La Palma, Spain (N, W, 2225 m a.s.l.). Until 2009, MAGIC consisted of just one stand-alone IACT with an integral flux sensitivity about 1.6% of the Crab Nebula flux in 50 hr of observation (Aliu
et al., 2009). After autumn 2009, the second telescope (MAGIC II) started operation, allowing us to reach an energy threshold as low as 50 GeV at low zenith angles (Aleksić
et al., 2012b). In this period the sensitivity improved to % of the Crab Nebula flux for energies greater than 290 GeV in 50 hr of observations. Between summer 2011 and 2012 both telescopes underwent a major upgrade that involved the digital trigger, readout systems and the MAGIC I camera (Aleksić
et al., 2016a). After this upgrade, the system achieves, in stereoscopic observational mode, an integral sensitivity of % of the Crab Nebula flux in 50 hr above 220 GeV (Aleksić
et al., 2016b).
The data analysis presented in this paper was carried out using the standard MAGIC analysis software (MARS; Zanin et al. 2013). Integral and differential flux upper limits (ULs) were computed making use of the full likelihood analysis developed by Aleksić et al. (2012a), which takes into account the different instrument response functions (IRFs) of the telescopes along the years, assuming a 30% systematic uncertainty.
At La Palma, Cyg X-1 culminates at a zenith angle of . Observations, performed up to , were carried out in a stand-alone mode (with just MAGIC I) from July 2007 to summer 2009, and, in stereoscopic mode, from October 2009 up to October 2014. Two data taking modes were used: the false-source tracking mode called wobble-mode and the on-off mode. In the former one, MAGIC points at two or four different positions situated away from the source to evaluate the background simultaneously (Fomin et al., 1994). In the latter mode, the on region (where the signal from the source is expected) and the off region (background signal) are observed separately. In this case, the background sample is recorded under same conditions (same epoch, zenith angle and atmospheric conditions) as for the on data but with no candidate source in the field of view.
The total Cyg X-1 data sample recorded by MAGIC amounts to hr after data quality cuts (62.5 hours in stand-alone mode, 20.1 hours during pre-upgrade stereo period and 14.3 hours post-upgrade). The data set was distributed over 53 nights between July 2007 and October 2014. The whole data sample extends over five yearly campaigns, characterized by different performances of the telescopes. Because of this, each epoch was analyzed separately with appropriate MC-simulated gamma-ray events. The details of the observations for each campaign are summarized in Table 1. For convenience, the following code is used in the table to describe the different observational features: STEREO stands for stereoscopic mode while MONO is used when only MAGIC I was operating. In the latter, the subscript specifies the observational mode: on-off or wobble mode. In STEREO, only wobble mode was used, so the subscript is used to specify whether the observations were taken before (pre) or after (post) the MAGIC upgrade.
Different criteria to trigger observations were used during the campaign to optimize observations, aimed at observing the system in a state, HS, similar to that in which we previously reported a possible detection. The X-ray spectral states were defined by using public Swift-BAT (15-50 keV) and RXTE-ASM (1.5-12 keV) data, except for the data taken in 2014 where only Swift-BAT was considered (since RXTE-ASM ceased science operations on January 3 2012). Between July and November 2007, the criteria used to prompt the observation was a Swift-BAT flux larger than 0.2 counts cm-2 s-1 and a ratio between RXTE-ASM one-day average (in counts s-1 in a Shadow Scanning Camera (SSC)) and Swift-BAT lower than 200. This criterion is in agreement with the one set by Grinberg et al. (2013) to define the X-ray states of Cyg X-1 using Swift-BAT data: above 0.09 counts cm-2 s-1 the microquasar stays in the HS+IS and below in the SS. The trigger criterion we selected is higher to achieve a count rate similar to that of the previous MAGIC hint. In July 2008, on top of the HS triggering criteria described above, we intensified observations following the X-ray superorbital modulation. The observations were triggered when the source was on the same superorbital phase as during the hint. Between June and October 2009, a new hardness ratio constraint using RXTE-ASM data of the energy ranges 5-12 keV and 1.3-2 keV was included: the observations were only stopped after 5 consecutive days of this ratio being lower than 1.2, to avoid interrupting the observations during the IS. In May 2011, the source was observed on two nights based on internal analysis of public Fermi-LAT data that showed a hint at HE during a hard X-ray activity period. Since all the above mentioned data were taken during the HS, for completeness, Cyg X-1 was also observed in its SS in September 2014 to exclude gamma-ray emission in this state at the same flux level as in the previous one. To define the X-ray state of the source, Swift-BAT public data was again used following Grinberg et al. (2013) criteria.
3 Results
3.1 Search for steady emission
We searched for steady VHE gamma-ray emission from Cyg X-1 at energies greater than 200 GeV making use of the entire data set of almost 100 hr. No significant excess was achieved. We computed ULs assuming a simple power-law function with different photon indices. The lower value, , is consistent with the results obtained in the HE band (Zanin et al. 2016, Zdziarski et al. 2016), while the upper one, , is constrained by the former MAGIC results (, Albert et al. 2007). Deviations in the photon index do not critically affect our results, quoted in Table 2. Therefore all ULs obtained in this work are given at a confidence level (CL) of 95% with , which is the photon index obtained for the MAGIC hint. For steady emission, we obtain an integral flux UL for energies greater than 200 GeV of photons cm-2s-1. Differential flux ULs for the entire data sample can be found in Table 3.
3.1.1 Results during Hard State
Observations under this X-ray spectral state were carried out between July 2007 and May 2011 reaching hr, where different criteria for triggering observations were used (see Section 2). No significant excess was detected during this spectral state. The integral flux UL for energies greater than 200 GeV is photons cm-2s-1. Differential flux ULs are listed in the upper part of Table 4. In order to search for VHE orbital modulation, we carried out an orbital phase-folded analysis. To accomplish a good compromise between orbital phase resolution and significant statistics, the binning in this analysis was 0.2. Moreover, in order to cover the superior conjunction of the BH (phases 0.9–0.1), we started to bin the data at phase 0.1. No VHE orbital modulation is evident either. Integral UL for a phase-folded analysis are shown in Table 5.
| Flux UL at 95% CL | |
|---|---|
| [ photons cm-2s-1] | |
| 2.0 | 2.20 |
| 2.6 | 2.44 |
| 3.2 | 2.62 |
| 3.8 | 2.71 |
3.1.2 Results during Soft State
Cyg X-1 was observed for a total of hr in the SS, bringing forth a clear difference on effective time with respect to the HS. Nevertheless, this corresponds to the post-upgrade period, in which MAGIC achieved its best sensitivity, % of the Crab Nebula flux above 220 GeV in 50 hr (Aleksić et al., 2016b), implying that the flux sensitivity of previous observations was nearly reached in only about 9 hr. This data set guarantees, in turn, a full coverage of the X-ray spectral states that the source usually exhibits. Although steady gamma-ray emission in the SS, when no persistent jets are present, is not theoretically predicted, transient jet emission cannot be dismissed during this state, as it happens in the case of Cygnus X-3 (Tavani et al. 2009, Fermi LAT Collaboration et al. 2009). Nevertheless, we did not find significant VHE gamma-ray emission from Cyg X-1 in the SS. Integral UL for energies beyond 200 GeV and is photons cm-2s-1. Differential ULs are quoted in the lower part of Table 4. The integral ULs for the orbital phase-folded study are also given in Table 5.
3.2 Search for variable emission
Taking into account the X-ray and radio variability detected in Cyg X-1, as well as the rapid variation of the flux level previously reported by MAGIC on a timescale of hours, we carried out daily analysis for the 53 nights. This search yielded no significant excess. Integral ULs (95% CL) for energies above 200 GeV for single-night observations are listed in Table 6.
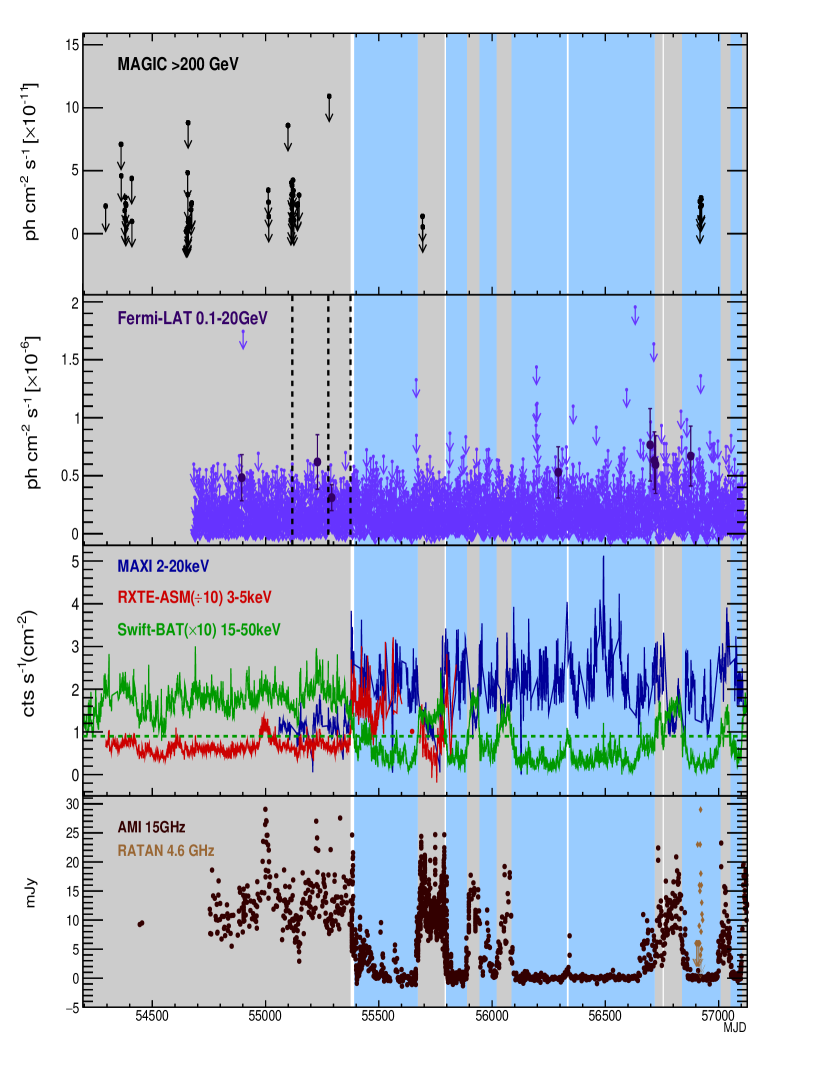
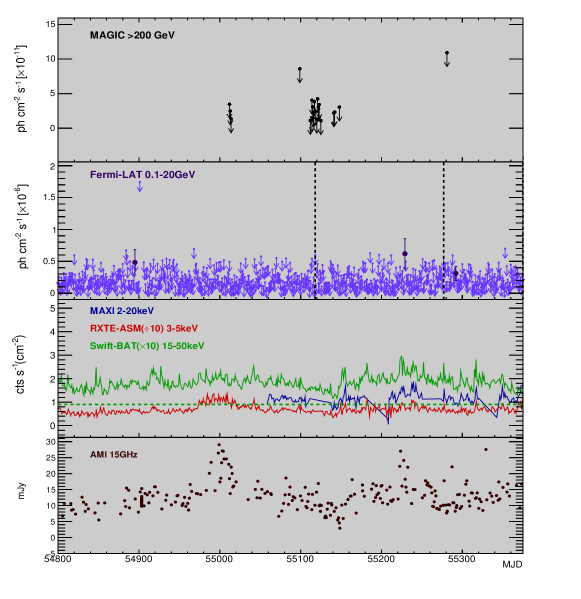
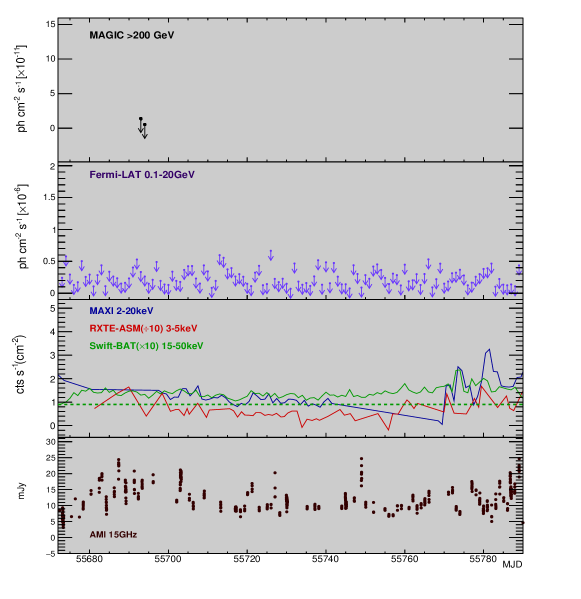
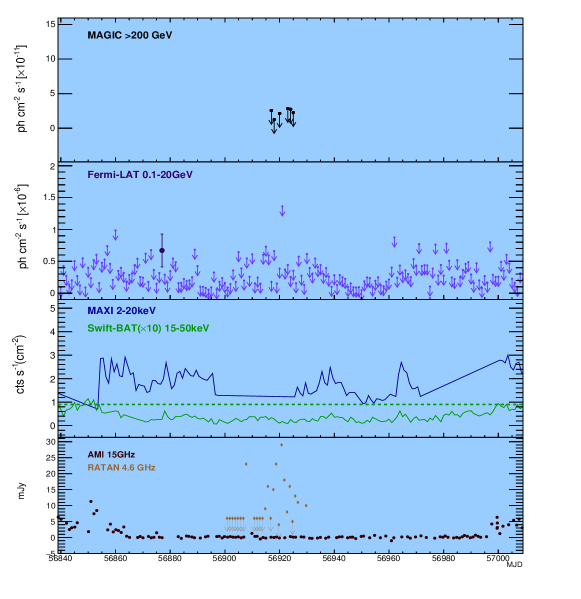
MAGIC results are included in the top panel of the multiwavelength light curve presented in Fig. 1 (zoom views are depicted in Fig. 3, 4 and 5). Besides MAGIC ULs, the figure shows data in the HE gamma-ray regime from Fermi/LAT (0.1-20 GeV) given by Zanin
et al. 2016, hard X-ray (Swift/BAT in 15-50 keV, Krimm
et al. 2013), intermediate-soft X-ray (MAXI between 2-20 keV, Matsuoka
et al. 2009), soft X-ray (quick-look results provided by the RXTE/ASM team in 3-5 keV) and radio data (AMI at 15 GHz and RATAN-600 at 4.6 GHz). The three transient episodes observed by AGILE are also marked.
During this multi-year campaign, Cyg X-1 did not display any X-ray flare like that in which the MAGIC hint was obtained. This prevented us from observing the source under strictly the same conditions: the maximum Swift-BAT flux simultaneous to our observations happened on MJD 54379 (, around superior conjunction of the BH) at the level of 0.23 counts cm-2 s-1, close but still lower than 0.31 counts cm-2 s-1 peak around the MAGIC hint. However, we observed Cyg X-1 in coincidence with the first AGILE flare. This transient episode (on October 16 2009, MJD 55120) showed between 0.1-3 GeV with a gamma-ray flux of photons cm-2s-1 (Sabatini et al., 2010), which took place during the X-ray HS of Cyg X-1. The corresponding MAGIC integral flux UL above 200 GeV for this day is photons cm-2s-1 (see Table 6). It is worth noting that Fermi-LAT did not detect any significant signal in the energy range of 0.1-20 GeV on or around this date either (Zanin et al., 2016). The apparent discrepancy of Fermi-LAT and AGILE could be explained based on the different exposure time and off-axis angle distance both satellites presented during Cyg X-1 observations, as explained by Munar-Adrover et al. (2016).
| Energy range | Significance | Differential flux UL for |
|---|---|---|
| [GeV] | [] | [ TeV-1cm-2s-1] |
| 186–332 | 2.15 | 0.02 |
| 332–589 | 0.14 | 0.33 |
| 589–1048 | 0.44 | 0.18 |
| 1048–1864 | 0.17 | 6.41 |
| 1864–3315 | 0.03 | 75.64 |
4 Discussion
VHE gamma-ray emission from microquasars has been proposed in the literature from both leptonic (e.g. Atoyan & Aharonian 1999, Bosch-Ramon et al. 2006) and hadronic processes (e.g. Romero et al. 2003). The most efficient radiative process is inverse Compton (IC), although hadronic emission may also occur in dense matter or HE radiation environments (see Bosch-Ramon & Khangulyan 2009, and references therein). There are different possible source photon fields according to the distance of the production site to the compact object: close to the BH, IC of thermal photons (Georganopoulos et al. 2002, Romero et al. 2002), or synchrotron photons (e.g. Bosch-Ramon et al., 2006) may be dominant. When the production region is situated inside the binary but further from the BH, the process can take place on photons from the companion star. In fact, anisotropic IC on stellar photons likely taking place in the jet seems to be the main mechanism of HE gamma-ray production in Cyg X-1 (Zanin et al. 2016; see Zdziarski et al. 2016 for additional possible contributions in gamma rays). Finally, in this source VHE gamma-ray emission may be also produced in the region where the jets seem to interact with the environment (Gallo et al., 2005), as proposed for instance by Bordas et al. (2009).
In the first two cases, i.e. if VHE emission is produced inside the binary system Cyg X-1, the VHE photons will suffer severe absorption through pair creation in the stellar photon field (e.g. Orellana et al. 2007, Bednarek &
Giovannelli 2007). This absorption is modulated due to changes in the star-emitter-observer relative positions along the orbit, with the maximum (minimum) of the attenuation, and the lowest (highest) energy threshold, taking place at the superior (inferior) conjunction of the compact object, which corresponds to phase 0 (0.5) in Cyg X-1. If orbitally modulated VHE emission were detected, it would likely imply that this emission comes at most from the outskirts of the binary system, approximately between and cm from the BH (see Bosch-Ramon et al. 2008), a location still consistent with the constraints derived from the GeV data (Zanin
et al., 2016). As in the case of gamma-ray absorption through pair creation, geometric effects are also relevant for IC processes, with the maximum probability of interaction between electrons and stellar photons occurring at superior conjunction of the compact object and the minimum at inferior conjunction. Further out of this region ( cm), VHE emission would be less affected by orbital motion, although particle acceleration and IC cooling are expected to be also weaker there, which may mean little or no production of VHE photons.
MAGIC observations carried out between July 2007 and September 2014 for a total of hours covered the two principal X-ray states of Cyg X-1 with the main focus on the HS, where the source has shown to accelerate relativistic particles that produce GeV gamma rays likely coming from the jets (Zanin et al., 2016). We did not detect any significant excess from either all the data or any of the samples, including orbital phase-folded and daily analysis. In this long-term campaign, we provided, for the first time, constraining ULs on the VHE emission of Cyg X-1 at the two main X-ray states, the HS and the SS, separately as well as in an orbital binning base, which showed no hint of gamma-ray orbital modulation. This was possible thanks to a comprehensive trigger strategy that allowed us to observe the source under flaring activity. The chosen photon index ( in this work, Crab-like in the previous MAGIC observations, Albert et al. 2007) and the addition of 30% systematic uncertainties contributed to obtain more robust ULs compared to the formerly ones reported by MAGIC.
The total power emitted by the jets during the HS in Cyg X-1 is expected to be erg s-1 (Gallo et al., 2005). The integral UL photons cm-2s-1, for energies greater than 200 GeV, obtained by MAGIC in this work corresponds to a luminosity of erg s-1 assuming a distance of 1.86 kpc (Reid et al., 2011). Therefore, the UL on the conversion efficiency of jet power to VHE gamma ray luminosity is 0.006–0.06%, similar to the one obtained for Cyg X-3 (Aleksić et al., 2010). Note that gamma-ray opacity in Cyg X-3 is nevertheless about two orders of magnitude higher than in Cyg X-1.
VHE emission from the jet large scale or jet-medium interaction regions above the sensitivity level of MAGIC can be ruled out, as these regions are not affected by gamma-ray absorption. On the binary scales, however, the non-detection is less conclusive because of pair creation in the stellar photon field. Models do predict VHE radiation as long as particle acceleration is efficient (e.g. Pepe et al. 2015). Formally, particle acceleration up to TeV energies can be reached in the jet on the binary region (Khangulyan et al., 2008), and thus 100 GeV IC photons should be produced, but this emission may be right below the detection level of MAGIC (as in Zdziarski et al. 2016, Fig. 6) even under negligible gamma-ray absorption. It could otherwise be that non-thermal particles cannot reach VHE IC emitting energies in the jet of Cyg X-1. Besides inefficient acceleration, a very high magnetic field could also prevent particles to reach VHE, and even if these particles were present, a strong magnetic field can suppress intensely VHE photon production.
Nevertheless, one cannot dismiss the possibility of a transient emission as the one hinted by MAGIC in 2006. This flare took place during an orbital phase around the superior conjunction of the BH, where the gamma-ray absorption is expected to be the highest. The attenuation constraint may have been relaxed by an emitter at some distance from the BH (Albert et al., 2007), with its intrinsic variability possibly related for instance to jet-stellar wind interaction (Perucho & Bosch-Ramon 2008, Owocki et al. 2009). On the other hand, even considering absorption by stellar photons, emission closer to the BH would be possible accounting for extended pair cascades under a reasonable intrinsic gamma-ray luminosity, although rather low magnetic fields in the stellar wind would be required (Zdziarski et al. 2009; see also Bosch-Ramon et al. 2008). Cyg X-3, the other microquasar firmly established as a GeV emitter (Tavani et al. 2009, Fermi LAT Collaboration et al. 2009), displays a very different behaviour from that of Cyg X-1. The HE gamma-ray emission from Cyg X-3 is transient, occurring sometimes during flaring activity of non-thermal radio emission from the jets (Corbel et al., 2012). If VHE radiation in microquasars were related to discrete radio-emitting-blobs with high Lorentz factor (), this may also happen in Cyg X-1 during hard-to-soft transitions.
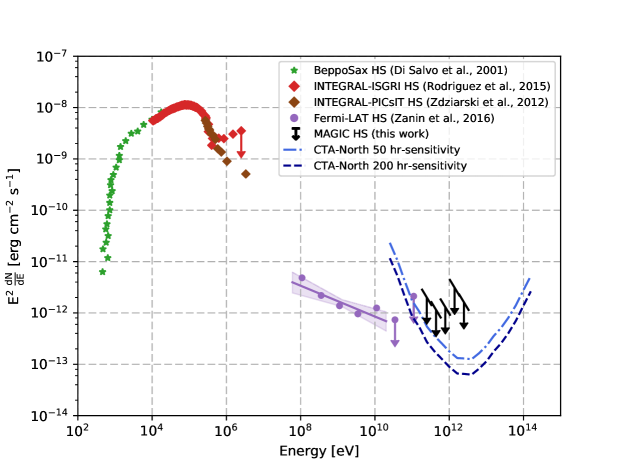
The multiwavelength emission from X-rays up to VHE gamma rays in Cyg X-1 is shown in Fig. 2. The data used in this spectral energy distribution (SED) corresponds to the HS. The sensitivity curve for 50 and scaled to 200 hr of observations with the future Cherenkov Telescope Array, CTA111as shown in https://www.cta-observatory.org/science/cta-performance/, on the Northern hemisphere is showed along with the data. The spectral cutoff of the HE radiation from Cyg X-1 is still unknown, although if the gamma-ray emission in the HS reaches TeV energies, the next generation of IACTs may be able to detect the system for long enough exposure times. Thus, to detect steady VHE emission from the jets, future more sensitive instruments, as CTA, would be needed. This instrument could provide valuable information of the VHE gamma-ray production in Cyg X-1 (HE spectral cutoff, energetics, impact of gamma-ray absorption/IC cascades), as well as allow the study of possible short-term flux variability.
Acknowledgements
We would like to thank the Instituto de Astrofísica de Canarias for the excellent working conditions at the Observatorio del Roque de los Muchachos in La Palma. The financial support of the German BMBF and MPG, the Italian INFN and INAF, the Swiss National Fund SNF, the ERDF under the Spanish MINECO (FPA2015-69818-P, FPA2012-36668, FPA2015-68278-P, FPA2015-69210-C6-2-R, FPA2015-69210-C6-4-R, FPA2015-69210-C6-6-R, AYA2013-47447-C3-1-P, AYA2015-71042-P, ESP2015-71662-C2-2-P, CSD2009-00064), and the Japanese JSPS and MEXT is gratefully acknowledged. This work was also supported by the Spanish Centro de Excelencia “Severo Ochoa” SEV-2012-0234 and SEV-2015-0548, and Unidad de Excelencia “María de Maeztu” MDM-2014-0369, by the Croatian Science Foundation (HrZZ) Project 09/176 and the University of Rijeka Project 13.12.1.3.02, by the DFG Collaborative Research Centers SFB823/C4 and SFB876/C3, and by the Polish MNiSzW grant 745/N-HESS-MAGIC/2010/0. The AMI arrays are supported by the United Kingdom STFC and by the University of Cambridge. R.Z. acknowledges the Alexander von Humboldt Foundation for the financial support and the Max-Planck Institut fur Kernphysik as hosting institution. This research has made use of MAXI data provided by RIKEN, JAXA and the MAXI team.
| Spectral State | Energy range | Significance | Differential flux UL for |
| [GeV] | [] | [ TeV-1cm-2s-1] | |
| 186–332 | 2.57 | 0.20 | |
| 332–589 | 0.03 | 3.70 | |
| HS | 589–1048 | 2.09 | 1.31 |
| 1048–1864 | 0.02 | 99.22 | |
| 1864–3315 | 0.51 | 16.34 | |
| 186–332 | 1.14 | 0.49 | |
| 332–589 | 1.22 | 0.11 | |
| SS | 589–1048 | 0.06 | 4.71 |
| 1048–1864 | 1.23 | 51.62 | |
| 1864–3315 | 1.34 | 16.37 |
| Spectral State | Phase range | Eff. Time | Significance | Integral flux UL for |
|---|---|---|---|---|
| [hr] | [] | [ photons cm-2s-1] | ||
| 0.1–0.3 | 15.47 | 0.77 | 7.89 | |
| 0.3–0.5 | 22.34 | 1.88 | 6.91 | |
| HS | 0.5–0.7 | 14.08 | 0.00 | 21.32 |
| 0.7–0.9 | 14.81 | 0.99 | 6.92 | |
| 0.9–0.1 | 15.62 | 0.96 | 4.34 | |
| 0.1–0.3 | 2.58 | 0.45 | 19.32 | |
| 0.3–0.5 | 4.35 | 1.23 | 7.96 | |
| SS | 0.5–0.7 | 3.91 | 0.59 | 15.49 |
| 0.7–0.9 | 3.64 | 0.23 | 18.23 | |
| 0.9–0.1 | – | – | – |
| Date | Eff. Time | Significance | Flux UL for =3.2 | |
|---|---|---|---|---|
| [yyyy mm dd] | [MJD] | [hr] | [] | [ photons cm-2s-1] |
| 2007 07 13 | 54294 | 1.78 | -0.67 | 2.19 |
| 2007 09 19 | 54362 | 0.71 | 1.10 | 7.10 |
| 2007 09 20 | 54363 | 1.43 | 1.99 | 4.59 |
| 2007 10 05 | 54378 | 0.85 | -0.84 | 1.84 |
| 2007 10 06 | 54379 | 1.85 | 0.02 | 1.21 |
| 2007 10 08 | 54381 | 1.95 | 0.99 | 2.88 |
| 2007 10 09 | 54382 | 0.77 | -0.57 | 2.38 |
| 2007 10 10 | 54383 | 2.26 | -0.04 | 1.05 |
| 2007 10 11 | 54384 | 0.76 | 1.68 | 2.26 |
| 2007 11 05 | 54409 | 0.58 | 0.31 | 4.38 |
| 2007 11 06 | 54410 | 0.96 | -1.24 | 0.97 |
| 2008 07 02 | 54649 | 4.24 | 2.33 | 0.21 |
| 2008 07 03 | 54650 | 3.26 | 1.53 | 0.15 |
| 2008 07 04 | 54651 | 4.27 | 2.36 | 0.23 |
| 2008 07 05 | 54652 | 4.15 | 2.97 | 0.22 |
| 2008 07 06 | 54653 | 3.75 | 1.75 | 0.39 |
| 2008 07 07 | 54654 | 3.69 | 2.74 | 0.24 |
| 2008 07 08 | 54655 | 3.94 | 2.01 | 0.18 |
| 2008 07 09 | 54656 | 3.06 | 1.66 | 0.49 |
| 2008 07 10 | 54657 | 2.89 | 1.75 | 0.38 |
| 2008 07 11 | 54658 | 1.18 | 0.32 | 0.93 |
| 2008 07 09 | 54656 | 0.33 | 0.06 | 4.84 |
| 2008 07 10 | 54657 | 0.39 | -1.22 | 3.11 |
| 2008 07 11 | 54658 | 0.32 | 1.83 | 8.81 |
| 2008 07 12 | 54659 | 2.51 | 0.11 | 1.16 |
| 2008 07 24 | 54671 | 0.62 | -1.45 | 1.90 |
| 2008 07 25 | 54672 | 0.63 | -0.15 | 2.30 |
| 2008 07 26 | 54673 | 0.84 | -1.33 | 2.40 |
| 2008 07 27 | 54674 | 0.30 | 2.09 | 2.44 |
| 2009 06 30 | 55012 | 3.50 | 0.76 | 3.46 |
| 2009 07 01 | 55013 | 2.63 | 0.73 | 2.50 |
| 2009 07 02 | 55014 | 1.83 | 0.14 | 1.36 |
| 2009 07 05 | 55017 | 0.22 | 0.37 | – |
| 2009 10 08 | 55112 | 0.26 | -1.85 | 1.11 |
| 2009 10 10 | 55114 | 0.67 | 0.19 | 1.50 |
| 2009 10 11 | 55115 | 2.03 | 0.32 | 3.10 |
| 2009 10 12 | 55116 | 2.34 | – | 2.19 |
| 2009 10 13 | 55117 | 0.95 | 1.53 | 3.87 |
| 2009 10 14 | 55118 | 1.98 | -0.30 | 2.44 |
| 2009 10 16 | 55120 | 1.37 | -2.99 | 1.30 |
| 2009 10 17 | 55121 | 0.96 | -0.77 | 4.25 |
| 2009 10 18 | 55122 | 1.60 | -0.27 | 3.05 |
| 2009 10 19 | 55123 | 0.68 | -0.44 | 3.42 |
| 2009 10 21 | 55125 | 1.99 | -1.90 | 1.09 |
| 2009 11 06 | 55141 | 0.37 | -3.04 | 2.23 |
| 2009 11 07 | 55142 | 0.64 | 0.13 | 2..35 |
| 2009 11 13 | 55148 | 0.89 | -1.23 | 3.06 |
| 2010 03 26 | 55281 | 0.78 | 1.75 | 10.92 |
| 2011 05 12 | 55693 | 1.35 | 0.09 | 1.38 |
| 2011 05 13 | 55694 | 1.20 | -1.54 | 0.53 |
| 2014 09 17 | 56917 | 2.55 | 0.32 | 2.56 |
| 2014 09 18 | 56918 | 1.29 | -0.99 | 1.25 |
| 2014 09 20 | 56920 | 2.38 | 0.08 | 2.13 |
| 2014 09 23 | 56923 | 3.00 | 0.85 | 2.85 |
| 2014 09 24 | 56924 | 3.26 | -0.61 | 2.73 |
| 2014 09 25 | 56925 | 1.81 | 0.28 | 2.26 |
References
- Albert et al. (2007) Albert J., et al., 2007, ApJ, 665, L51
- Aleksić et al. (2010) Aleksić J., et al., 2010, ApJ, 721, 843
- Aleksić et al. (2012a) Aleksić J., Rico J., Martinez M., 2012a, J. Cosmology Astropart. Phys., 10, 032
- Aleksić et al. (2012b) Aleksić J., et al., 2012b, Astroparticle Physics, 35, 435
- Aleksić et al. (2016a) Aleksić J., et al., 2016a, Astroparticle Physics, 72, 61
- Aleksić et al. (2016b) Aleksić J., et al., 2016b, Astroparticle Physics, 72, 76
- Aliu et al. (2009) Aliu E., et al., 2009, Astroparticle Physics, 30, 293
- Atoyan & Aharonian (1999) Atoyan A. M., Aharonian F. A., 1999, MNRAS, 302, 253
- Bednarek & Giovannelli (2007) Bednarek W., Giovannelli F., 2007, A&A, 464, 437
- Bolton (1972) Bolton C. T., 1972, Nature, 235, 271
- Bordas et al. (2009) Bordas P., Bosch-Ramon V., Paredes J. M., Perucho M., 2009, A&A, 497, 325
- Bosch-Ramon & Khangulyan (2009) Bosch-Ramon V., Khangulyan D., 2009, International Journal of Modern Physics D, 18, 347
- Bosch-Ramon et al. (2006) Bosch-Ramon V., Romero G. E., Paredes J. M., 2006, A&A, 447, 263
- Bosch-Ramon et al. (2008) Bosch-Ramon V., Khangulyan D., Aharonian F. A., 2008, A&A, 489, L21
- Brocksopp et al. (1999a) Brocksopp C., Fender R. P., Larianiov V., Lyuty V., Tarasov A., et al., 1999a, Mon.Not.Roy.Astron.Soc., 309, 1063
- Brocksopp et al. (1999b) Brocksopp C., Tarasov A. E., Lyuty V. M., Roche P., 1999b, A&A, 343, 861
- Bulgarelli et al. (2010) Bulgarelli A., et al., 2010, The Astronomer’s Telegram, 2512
- Coppi (1999) Coppi P. S., 1999, in Poutanen J., Svensson R., eds, Astronomical Society of the Pacific Conference Series Vol. 161, High Energy Processes in Accreting Black Holes. p. 375 (arXiv:astro-ph/9903158)
- Corbel et al. (2012) Corbel S., et al., 2012, MNRAS, 421, 2947
- Di Salvo et al. (2001) Di Salvo T., Done C., Życki P. T., Burderi L., Robba N. R., 2001, ApJ, 547, 1024
- Done et al. (2007) Done C., Gierliński M., Kubota A., 2007, A&ARv, 15, 1
- Esin et al. (1998) Esin A. A., Narayan R., Cui W., Grove J. E., Zhang S.-N., 1998, ApJ, 505, 854
- Fender et al. (2004) Fender R. P., Belloni T. M., Gallo E., 2004, MNRAS, 355, 1105
- Fender et al. (2006) Fender R. P., Stirling A., Spencer R., Brown I., Pooley G., et al., 2006, Mon.Not.Roy.Astron.Soc., 369, 603
- Fermi LAT Collaboration et al. (2009) Fermi LAT Collaboration et al., 2009, Science, 326, 1512
- Fomin et al. (1994) Fomin V. P., Stepanian A. A., Lamb R. C., Lewis D. A., Punch M., Weekes T. C., 1994, Astroparticle Physics, 2, 137
- Gallo et al. (2003) Gallo E., Fender R. P., Pooley G. G., 2003, MNRAS, 344, 60
- Gallo et al. (2005) Gallo E., Fender R., Kaiser C., Russell D., Morganti R., Oosterloo T., Heinz S., 2005, Nature, 436, 819
- Georganopoulos et al. (2002) Georganopoulos M., Aharonian F. A., Kirk J. G., 2002, A&A, 388, L25
- Gierlinski et al. (1997) Gierlinski M., Zdziarski A. A., Done C., Johnson W. N., Ebisawa K., Ueda Y., Haardt F., Phlips B. F., 1997, MNRAS, 288, 958
- Gies et al. (2008) Gies D. R., et al., 2008, ApJ, 678, 1237
- Grinberg et al. (2013) Grinberg V., et al., 2013, A&A, 554, A88
- Guenette et al. (2009) Guenette R., et al., 2009, ArXiv [0908.0714],
- Jourdain et al. (2012) Jourdain E., Roques J. P., Chauvin M., Clark D. J., 2012, ApJ, 761, 27
- Khangulyan et al. (2008) Khangulyan D., Aharonian F., Bosch-Ramon V., 2008, MNRAS, 383, 467
- Krimm et al. (2013) Krimm H. A., et al., 2013, ApJS, 209, 14
- Laurent et al. (2011) Laurent P., Rodriguez J., Wilms J., Cadolle Bel M., Pottschmidt K., Grinberg V., 2011, in X-ray Astrophysics up to 511 keV.
- Malyshev et al. (2013) Malyshev D., Zdziarski A. A., Chernyakova M., 2013, MNRAS, 434, 2380
- Malzac et al. (2008) Malzac J., Lubiński P., Zdziarski A. A., Cadolle Bel M., Türler M., Laurent P., 2008, A&A, 492, 527
- Matsuoka et al. (2009) Matsuoka M., et al., 2009, PASJ, 61, 999
- McConnell et al. (2002) McConnell M. L., et al., 2002, ApJ, 572, 984
- Munar-Adrover et al. (2016) Munar-Adrover P., Sabatini S., Piano G., Tavani M., Nguyen L. H., Lucarelli F., Verrecchia F., Pittori C., 2016, ApJ, 829, 101
- Orellana et al. (2007) Orellana M., Bordas P., Bosch-Ramon V., Romero G. E., Paredes J. M., 2007, A&A, 476, 9
- Orosz et al. (2011) Orosz J. A., McClintock J. E., Aufdenberg J. P., Remillard R. A., Reid M. J., Narayan R., Gou L., 2011, ApJ, 742, 84
- Owocki et al. (2009) Owocki S. P., Romero G. E., Townsend R. H. D., Araudo A. T., 2009, ApJ, 696, 690
- Pepe et al. (2015) Pepe C., Vila G. S., Romero G. E., 2015, A&A, 584, A95
- Perucho & Bosch-Ramon (2008) Perucho M., Bosch-Ramon V., 2008, A&A, 482, 917
- Poutanen et al. (2008) Poutanen J., Zdziarski A. A., Ibragimov A., 2008, MNRAS, 389, 1427
- Reid et al. (2011) Reid M. J., McClintock J. E., Narayan R., Gou L., Remillard R. A., Orosz J. A., 2011, ApJ, 742, 83
- Rico (2008) Rico J., 2008, ApJ, 683, L55
- Rodriguez et al. (2015) Rodriguez J., et al., 2015, ApJ, 807, 17
- Romero et al. (2002) Romero G. E., Kaufman Bernadó M. M., Mirabel I. F., 2002, A&A, 393, L61
- Romero et al. (2003) Romero G. E., Torres D. F., Kaufman Bernadó M. M., Mirabel I. F., 2003, A&A, 410, L1
- Rushton et al. (2012) Rushton A., et al., 2012, MNRAS, 419, 3194
- Sabatini et al. (2010) Sabatini S., et al., 2010, ApJ, 712, L10
- Sabatini et al. (2013) Sabatini S., et al., 2013, ApJ, 766, 83
- Stirling et al. (2001) Stirling A. M., Spencer R. E., de la Force C., Garrett M. A., Fender R. P., et al., 2001, Mon.Not.Roy.Astron.Soc., 327, 1273
- Szostek & Zdziarski (2007) Szostek A., Zdziarski A. A., 2007, MNRAS, 375, 793
- Tanaka & Shibazaki (1996) Tanaka Y., Shibazaki N., 1996, Ann.Rev.Astron.Astrophys., 34, 607
- Tavani et al. (2009) Tavani M., et al., 2009, Nature, 462, 620
- Wen et al. (1999) Wen L., Cui W., Levine A. M., Bradt H. V., 1999, ApJ, 525, 968
- Zanin et al. (2013) Zanin R., Carmona E., Sitarek J., Colin P., Frantzen K., 2013, in Proc. of the 33st International Cosmic Ray Conference, Rio de Janeiro, Brasil.
- Zanin et al. (2016) Zanin R., Fernández-Barral A., de Oña Wilhelmi E., Aharonian F., Blanch O., Bosch-Ramon V., Galindo D., 2016, A&A, 596, A55
- Zdziarski et al. (2009) Zdziarski A. A., Malzac J., Bednarek W., 2009, MNRAS, 394, L41
- Zdziarski et al. (2011) Zdziarski A. A., Pooley G. G., Skinner G. K., 2011, MNRAS, 412, 1985
- Zdziarski et al. (2012) Zdziarski A. A., Lubiński P., Sikora M., 2012, MNRAS, 423, 663
- Zdziarski et al. (2016) Zdziarski A. A., Malyshev D., Chernyakova M., Pooley G. G., 2016, ArXiv [1607.05059],
- Ziółkowski (2014) Ziółkowski J., 2014, MNRAS, 440, L61
1 ETH Zurich, CH-8093 Zurich, Switzerland
2 Università di Udine, and INFN Trieste, I-33100 Udine, Italy
3 INAF - National Institute for Astrophysics, viale del Parco Mellini, 84, I-00136 Rome, Italy
4 Università di Padova and INFN, I-35131 Padova, Italy
5 Croatian MAGIC Consortium, Rudjer Boskovic Institute, University of Rijeka, University of Split - FESB, University of Zagreb - FER, University of Osijek,Croatia
6 Saha Institute of Nuclear Physics, 1/AF Bidhannagar, Salt Lake, Sector-1, Kolkata 700064, India
7 Max-Planck-Institut für Physik, D-80805 München, Germany
8 Universidad Complutense, E-28040 Madrid, Spain
9 Inst. de Astrofísica de Canarias, E-38200 La Laguna, Tenerife, Spain
10 Universidad de La Laguna, Dpto. Astrofísica, E-38206 La Laguna, Tenerife, Spain
11 University of Łódź, PL-90236 Lodz, Poland
12 Deutsches Elektronen-Synchrotron (DESY), D-15738 Zeuthen, Germany
13 Institut de Fisica d’Altes Energies (IFAE), The Barcelona Institute of Science and Technology, Campus UAB, 08193 Bellaterra (Barcelona), Spain
14 Università di Siena, and INFN Pisa, I-53100 Siena, Italy
15 Institute for Space Sciences (CSIC/IEEC), E-08193 Barcelona, Spain
16 Technische Universität Dortmund, D-44221 Dortmund, Germany
17 Universität Würzburg, D-97074 Würzburg, Germany
18 Finnish MAGIC Consortium, Tuorla Observatory, University of Turku and Astronomy Division, University of Oulu, Finland
19 Unitat de Física de les Radiacions, Departament de Física, and CERES-IEEC, Universitat Autònoma de Barcelona, E-08193 Bellaterra, Spain
20 Universitat de Barcelona, ICC, IEEC-UB, E-08028 Barcelona, Spain
21 Japanese MAGIC Consortium, ICRR, The University of Tokyo, Department of Physics, Kyoto University, Tokai University, The University of Tokushima, Japan
22 Inst. for Nucl. Research and Nucl. Energy, BG-1784 Sofia, Bulgaria
23 Università di Pisa, and INFN Pisa, I-56126 Pisa, Italy
24 ICREA and Institute for Space Sciences (CSIC/IEEC), E-08193 Barcelona, Spain
25 also at the Department of Physics of Kyoto University, Japan
26 now at Centro Brasileiro de Pesquisas Físicas (CBPF/MCTI), R. Dr. Xavier Sigaud, 150 - Urca, Rio de Janeiro - RJ, 22290-180, Brazil
27 now at NASA Goddard Space Flight Center, Greenbelt, MD 20771, USA
28 Department of Physics and Department of Astronomy, University of Maryland, College Park, MD 20742, USA
29 Humboldt University of Berlin, Institut für Physik Newtonstr. 15, 12489 Berlin Germany
30 also at University of Trieste
31 Japanese MAGIC Consortium
32 now at Finnish Centre for Astronomy with ESO (FINCA), Turku, Finland
33 also at INAF-Trieste and Dept. of Physics & Astronomy, University of Bologna
34 Departament d’Astronomia i Metereologia, Institut de Ciènces del Cosmos, Universtitat de Barcelona, Barcelona, Spain
35 Cavendish Laboratory, J. J. Thomson Avenue, Cambridge CB3 0HE, UK
36 Special astrophysical Observatory RAS, Nizhnij Arkhys, Karachaevo-Cherkassia, Russia
37 Kazan Federal University, Kazan, Republic of Tartarstan, Russia
38 Max-Planck-Institut fur Kernphysik, P.O. Box 103980, D 69029 Heidelberg, Germany