Photometric determination of the mass accretion rates of
pre-main sequence stars.
V. Recent star formation in the 30 Dor
Nebula**affiliationmark:
Abstract
We report on the properties of the low-mass stars that recently formed in the central of 30 Dor including the R 136 cluster. Using the photometric catalogue of De Marchi et al. (2011c), based on observations with the Hubble Space Telescope (HST), and the most recent extinction law for this field, we identify bona-fide pre-main sequence (PMS) stars showing excess emission at the level with equivalent width of 20 Å or more. We find a wide spread in age spanning the range Myr. We also find that the older PMS objects are placed in front of the R 136 cluster and are separated from it by a conspicuous amount of absorbing material, indicating that star formation has proceeded from the periphery into the interior of the region. We derive physical parameters for all PMS stars, including masses , ages , and mass accretion rates . To identify reliable correlations between these parameters, which are intertwined, we use a multivariate linear regression fit of the type . The values of and for 30 Dor are compatible with those found in NGC 346 and NGC 602. We extend the fit to a uniform sample of PMS stars with /M⊙ and Myr in six star forming regions in the Large and Small Magellanic Clouds and Milky Way with metallicities in the range Z⊙. We find and . The residuals are systematically different between the six regions and reveal a strong correlation with metallicity , of the type . A possible interpretation of this trend is that when the metallicity is higher so is the radiation pressure and this limits the accretion process, both in its rate and duration.
Subject headings:
stars: formation — stars: pre-main sequence — galaxies: stellar content - galaxies: Magellanic Clouds - galaxies: star clusters — open clusters and associations: individual (30 Dor)1. Introduction
The Tarantula Nebula (30 Dor) in the Large Magellanic Cloud (LMC) is the nearest extragalactic region of extended star formation. It is energized by the OB association NGC 2070, which hosts at its centre the Radcliffe 136 (R 136) cluster, the closest example of a massive extragalactic starburst region (Walborn 1991). Ground-based observations dating back to the 1980s already revealed several discrete epochs of formation of massive stars within the nebula (e.g. Walborn 1986, 1991; Melnick 1987), but only the advent of the refurbished Hubble Space Telescope (HST) allowed an in-depth study also of lower mass stars (e.g. Sirianni et al. 2000; Zinnecker et al. 2002; Andersen et al. 2009).
De Marchi et al. (2011c) presented a study of the populations of low-mass stars recently formed in the central regions of the 30 Dor nebula, using observations with the Wide Field Camera 3 (WFC 3) on board the HST. Looking for objects with excess emission, these authors discovered a population of more than 1 150 pre-main sequence (PMS) stars in a region of pc2 in NGC 2070, including the central R 136 cluster. Although many of these PMS stars have young ages ( Myr) and a spatial distribution matching that of the massive members of R 136, the study of De Marchi et al. (2011c) revealed that about one third of the PMS objects have ages in excess of Myr and are preferentially located to the east of R 136. This indicates that formation of low-mass stars in this field has proceeded over a period of time longer than that associated with the birth of the massive stars of R 136 some Myr ago (e.g. De Marchi et al. 1993; Hunter et al. 1995a; Massey & Hunter 1998; de Koter, Heap & Hubeny 1998; Walborn et al. 1999).
The presence in the Tarantula nebula of stars older than the massive members of R 136 was already established earlier. For instance, a spectroscopic study of massive ( M⊙ ) stars conducted by Selman et al. (1999) allowed them to identify three bursts of increasing strength, occurring respectively 5, , and less than Myr ago. This had been noticed before by Brandl et al. (1996). Comparing their multi-band photometry with evolutionary tracks (Meynet et al. 1994), Brandl et al. (1996) determined the age of stars more massive than 12 M⊙ within a field of pc2 around R 136, detecting three peaks of massive star formation separated by approximately Myr. Similarly, from a morphological study of the ages and spatial distribution of OB stars, Walborn & Blades (1997) had identified multiple generations of stars in 30 Dor, with ages of , 2–3, and 6 Myr inside R 136. Furthermore, for the Hodge 301 cluster, located north-west of it, they obtained an age of Myr or older, as already suggested by Lortet & Testor (1991). An even older age for Hodge 301 was later derived by Grebel & Chu (2000). Using both photometry and spectroscopy, these authors concluded that the most likely age for Hodge 301 is of the order of 20 – 25 Myr, as at younger ages isochrones would not match both the main-sequence (MS) turn-off and the locus of the blue and red supergiants. From the colour and magnitude of the PMS sequence turn-on, where the PMS joins the MS, Cignoni et al. (2016) recently concluded that Hodge 301 is older still, with ages in the range Myr.
In general, these conclusions on the age of the populations in 30 Dor are based on the properties of the relatively short-lived massive stars. It is thus difficult to establish whether the massive stars in R 136 and the less recent episodes around 30 Dor are related or simply happen to have occurred in neighbouring regions. On the other hand, the PMS stars identified by De Marchi et al. (2011c) in 30 Dor have masses in the range M⊙ and as such they can be used to trace the progression of star formation on scales of several 10 Myr. For instance, a typical M⊙ PMS star of metallicity , as appropriate for the LMC, takes about 25 Myr to reach the MS (e.g. Tognelli et al. 2012). Throughout this phase, objects can be identified as PMS stars thanks to the emission features associated with the mass accretion process and through their physical parameters. Thus their mass accretion rate and age can be derived for a statistically significant number of stars, typically several hundreds.
In this work, we follow up on the original study of De Marchi et al. (2011c), starting from the same observational material, yet updated to the most recent WFC 3 calibration (Deustua et al. 2017). Furthermore, we take advantage of the accurate 30 Dor extinction properties in the range m as derived by De Marchi & Panagia (2014; see also De Marchi et al. 2016) from the colours and magnitudes of about 180 red giant stars uniformly distributed over this field. This will allow us to obtain accurate physical parameters for all PMS stars in this region, including their mass accretion rates. Studies conducted so far in the Magellanic Clouds (MCs) have revealed that the accretion process appears to be more intense and to last longer than in nearby Galactic star forming regions (De Marchi, Panagia & Romaniello 2010; De Marchi et al. 2011a; De Marchi, Panagia & Sabbi 2011; Spezzi et al. 2012; De Marchi, Beccari & Panagia 2013).
It has been reported in the literature (e.g. Yasui et al. 2009, 2010, 2016) that in some star-forming regions of low metallicity in the extreme outer Galaxy the disc lifetime appears to be shorter than that measured in similar regions at solar metallicity. However, these conclusions are based on observations of the near-infrared (NIR) emission from the dust component in the discs, using dust as a proxy for the total mass of the discs. Therefore, these results are not directly comparable with our measurements of the gas accretion process in low-metallicity environments. In fact, optical spectroscopic observations of similar small low-metallicity star-forming regions in the Galactic anticentre (Cusano et al. 2011; Kalari & Vink 2015) indicate that a significant fraction of the young stellar objects have actually preserved their discs and envelopes and continue to accrete. And indeed, if the metallicity is lower also the dust abundance is lower, and a proportionally lower amount of stellar radiation is absorbed by grains. Therefore, for an equal stellar luminosity the disc NIR emission is also lower. Thus, the NIR detectability of a low metallicity disc appears to drop faster than it is found for higher metallicity sources. For this reason we favour studying the time evolution of discs focusing on their gaseous component, which represents the bulk of the circumstellar disc mass.
The ultimate goal of this investigation is to explore how the accretion process during the PMS phase depends on the mass of the forming star and how it is affected by the chemical composition of the parent molecular cloud. The mini-starburst nature of 30 Dor (Leitherer 1998) makes this region crucial for our understanding of star formation also in a cosmological context, since it offers an environment with conditions similar to those prevailing at redshift , when star formation in the Universe was at its peak (e.g. Madau et al. 1996; Lilly et al. 1996).
The structure of the paper is as follows. The observations and photometric catalogue are briefly summarised in Section 2. In Section 3 we deal with the correction for extinction. Section 4 is devoted to the identification of the PMS stars and to their physical properties. In Section 5 we study how the mass accretion rate of PMS stars is related with stellar parameters. A comparison with other star-forming regions is provided in Section 6. A summary of the most important conclusions of the paper is presented in Section 7.
2. Observations and photometry
The data used in this work are extracted from the multiband photometric catalogue presented by De Marchi et al. (2011c), based on observations obtained with the WFC 3 on board the HST of a region of at the centre of NGC 2070, including the R 136 cluster. The observations were collected in several bands over the range m, namely through the F336W, F438W, F555W, F656N, F110W and F160W filters. In this work we will concentrate on the observations in the F555W, F814W, and F656N bands (hereafter , , and , respectively). Details on data reduction and photometry are given in De Marchi et al. (2011c). With respect to the original catalogue, we updated the zero points of the photometric calibration in the F555W, F656N, and F814W bands according to the most recent values (Deustua et al. 2017).
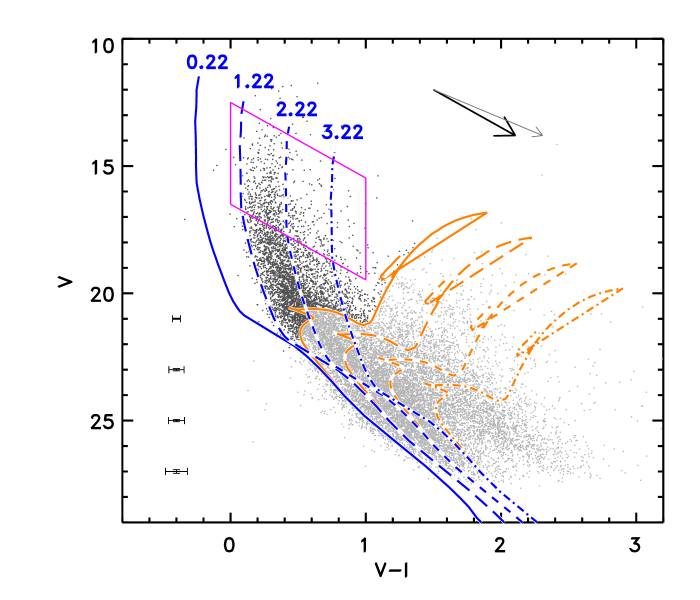
A total of about 18 800 sources are detected simultaneously in the and bands with photometric uncertainty of less than mag in both bands. The corresponding colour–magnitude diagram (CMD) is shown in Figure 1. In Sections 3 and 4 we will use this CMD, the photometry in the band, and the spatial distribution of the stars in the field to identify PMS objects and correct their photometry for the effects of differential reddening. We will adopt the method already employed by De Marchi et al. (2011c), briefly summarised in the following section, and refer the reader to that work for further details.
3. Differential extinction
The upper MS (UMS) seen in Figure 1 at is considerably wider than the photometric uncertainty (see the error bars in the figure), as De Marchi et al. (2011c) already pointed out. This is due to the large amount of differential extinction known to affect this field (Fitzpatrick & Savage 1984; Maíz Apellániz et al. 2014). De Marchi & Panagia (2014) measured the extinction towards about 180 red giants in this field and derived the extinction law in the range m. They found that at optical wavelengths the extinction curve is almost parallel to that of the diffuse Galactic interstellar medium, and the presence of an extra grey component due to a larger fraction of large grains results in a higher value of the ratio of total and selective extinction . The corresponding reddening vector is shown by the thick arrow in Figure 1. For comparison, we also show as a thin arrow the reddening vector corresponding to that was originally adopted by De Marchi et al. (2011c). The steeper reddening vector corresponding to the extinction law measured by De Marchi & Panagia (2014; see also De Marchi et al. 2016) has important implications for the stellar parameters derived from the photometry, also for PMS stars, as it typically results in higher stellar masses.
Although the extinction law is now known in this field, the reddening to each object still has to be determined individually, due to the patchy nature of the absorption.
The solid blue line in Figure 1 corresponds to a theoretical isochrone from Marigo et al. (2008) for an age of 3 Myr111For the UMS stars in the range of interest here (i.e. in the observed range corresponding to masses in the range about M⊙ ), there is no noticeable difference in the CMD between the Padova post-MS models (Marigo et al. 2008) and pre-MS models (e.g. Bressan et al. 2012) for an age of 3 Myr. This is the accepted age for the massive members of R 136 (e.g. De Marchi et al. 1993; Hunter et al. 1995), even though they might be slightly younger ( Myr) if Wolf Rayet stars are still burning hydrogen (Massey & Hunter 1998; de Koter, Heap & Hubeny 1998; Walborn et al. 1999). We have adopted a distance of kpc (Panagia et al. 1991; Panagia 1999), corresponding to a distance modulus , and a metallicity since this is a typical value for the LMC (e.g. Hill, Andrievsky & Spite 1995; Geha et al. 1998). The isochrone also includes the effects of the Milky Way (MW) intervening absorption along the line of sight. According to Fitzpatrick & Savage (1984), this amounts to and . The long-dashed, short-dashed, and dot-dashed blue lines are the same isochrone further reddened for purpose of illustration by respectively 1, 2, and 3 magnitudes in according to the 30 Dor extinction law (De Marchi & Panagia 2014; De Marchi et al. 2016), corresponding to an additional contribution of , and mag to the value.
These isochrones highlight the reddening spread amongst the young stars in the UMS. The situation is further complicated by the presence of the older LMC field population. Both ground-based and HST observations concur in assigning ages of Gyr to the intermediate-age populations in clusters and in the field of the LMC (e.g. Westerlund, Linde & Lyngå1995; Elson, Gilmore & Santiago 1997; Geha et al. 1998), with a major star-formation event occurring about 2 Gyr ago. Therefore, for comparison, the orange lines show isochrones for an age of 2 Gyr and the same metallicity, distance, and reddening values used for the 3 Myr isochrones, also from the models of Marigo et al. (2008). They reveal a different and even wider reddening spread for the older population (see De Marchi & Panagia 2014 and De Marchi et al. 2016 for details). They also reveal that stars of different ages and with significantly different extinction can occupy the same region of the CMD. For instance, most stars with and could be both PMS objects, or red giants, or even older MS stars. This is why our search for PMS objects will rely on excess emission as a signature of youth.
In such a complex field, a reddening correction can be derived only for objects whose un-extinguished location in the CMD is known. These include, for instance, red giant stars belonging to the red clump (RC, see De Marchi, Panagia & Girardi 2013; De Marchi & Panagia 2014; De Marchi et al. 2016). The same applies to UMS stars. The box marked in Figure 1 contains objects whose reddening is simply given by the displacement from the theoretical isochrone for the appropriate age, metallicity and distance. These stars serve as a reference to derive a statistical reddening correction for low-mass stars with a similar age and spatial distribution. This can be done with the “nearest neighbours” method, introduced by Romaniello et al. (2002) and described in detail in De Marchi et al. (2011a, 2011c). In short, it consists in assigning to the identified PMS stars a reddening value determined as the weighted average of those of the reference UMS stars in their vicinity. This procedure implicitly assumes that stars projected within a relatively small region of the field have similar extinction values. This has been verified using the UMS stars themselves, which as a test were de-reddened in the same way using the other reference UMS stars. This resulted in a reduced colour spread of the UMS in the CMD (see De Marchi et al. 2011a, 2011c for details). The nearest neighbour correction will be used for the younger PMS stars identified in Section 4.
One should note that there is an additional source of reddening that we are not explicitly considering. If the circumstellar disc has a high inclination angle, it can intercept the light of the star, causing further extinction. This event, however, has a low probability of happening. De Marchi et al. (2013b) conducted a detailed study of the effects of disc inclination on the apparent colour and magnitude of PMS stars in NGC 6611. They show that the effect starts to be noticeable when the inclination angle reaches , thus in principle affecting 15 % of the objects. However, when the angle exceeds the central star becomes typically 4 to 5 mag fainter, thereby becoming undetectable in most cases. Thus, one should expect that less than 10 % of the stars in our sample may have extra reddening caused by the circumstellar disc. Therefore the effect is negligible.
4. Searching for PMS stars
As mentioned above, differential reddening makes it impossible to identify bona-fide PMS stars based on their broad-band photometry alone. Instead we search for stars with a strong excess emission. This feature is characteristic of low-mass star formation and is attributed to the gravitational energy released by in-falling matter that ionises and excites the surrounding gas (e.g. Königl 1991; Shu et al. 1994). A reliable method to detect these objects using multi-colour photometry is addressed in a series of papers by De Marchi et al. (2010, 2011a, 2011b, 2011c, 2013a), to which we refer the reader.
Briefly, the median and colours of stars with small ( mag) photometric uncertainties in the and bands define an empirical reference template against which we identify objects with excess emission. Even before correction for reddening, the colour–colour diagram , provides a robust identification of stars with excess, since in these bands the reddening vector runs almost parallel to the median photospheric colours of normal stars (De Marchi et al. 2010).
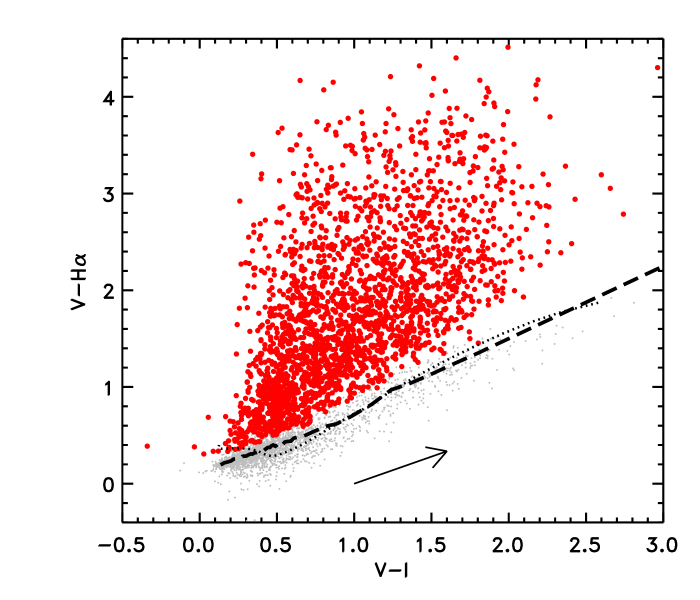
Following this procedure, we identified stars with colour exceeding the colour of normal stars with no excess and with the same by at least mag or by three times the photometric uncertainty on the colour (i.e. ), whichever is larger. We further restricted the search to stars with combined photometric uncertainty not exceeding mag in all three bands and not larger than mag in and individually. This results in about PMS candidates, shown as thick dots in Figure 2.
The dashed line in the figure represents the median photospheric colour as a function of for stars with small photometric uncertainties in all three bands. These are typically older MS stars and do not have appreciable excess. For comparison, the thin dotted line shows the model atmospheres of Bessell, Castelli & Pletz (1998) for stars with effective temperatures in the range 3 500 K 40 000 K, surface gravity and a metallicity index , as appropriate for the LMC (Dufour 1984). The theoretical colours, calculated for the specific WFC 3 filters, already include a typical reddening value of , made up of due to intervening MW absorption along the line of sight and due to LMC absorption in front of and within 30 Dor. As we will see later, this is a representative average reddening value for this field.
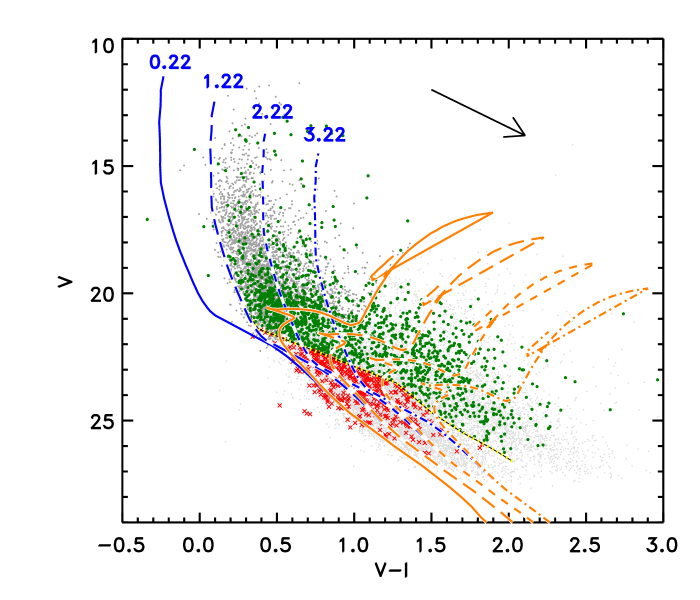
Objects with excess emission are shown as thick symbols in Figure 3. Following De Marchi et al. (2011c), we will consider their positions in the CMD in relation with their spatial distribution in order to determine how to correct their photometry for reddening using neighbouring reference UMS stars. All these objects with excess emission are candidate PMS stars, and as such are relatively young. We used a theoretical PMS isochrone for a rough preliminary separation of younger and older PMS stars. A more accurate age determination will be possible after correction for reddening.
The thin short-dashed line is the theoretical isochrone for a PMS age of 5 Myr and metallicity from the models of Tognelli et al. (2012), translated into the WFC 3 bands for the assumed distance modulus and a combined reddening . Using the 5 Myr PMS isochrone as a reference, we have marked as thick dots and crosses respectively the objects above and below that line, and hence approximately younger and older than 5 Myr.
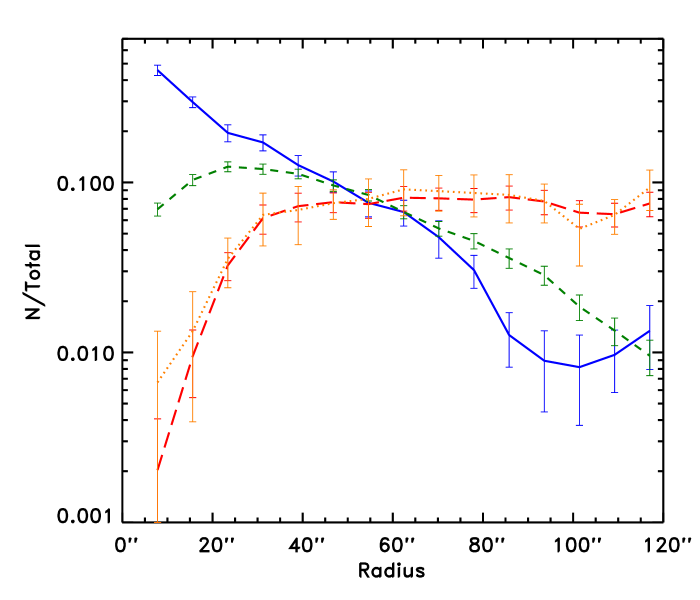
The radial distributions of these objects are shown in Figure 4, drawn from the nominal centre of R 136. De Marchi et al. (2011c) had already shown that stars younger than 5 Myr (short-dashed line) follow remarkably well the distribution of reference UMS stars (solid line, rescaled by a factor of to ease the comparison), while stars older than 5 Myr (long-dashed line) have a rather uniform distribution. The dotted line shows for comparison the distribution of stars between the 5 Myr and 10 Myr isochrones (the latter is not shown in Figure 3 but is also from the models of Tognelli et al. 2011). The dotted line confirms that even the least old PMS candidates have a radial distribution different from that of UMS stars. Thus, we can safely use the nearby reference UMS stars to derive a reddening correction also for similarly young PMS candidates, but not for the older ones.
We assigned to each young PMS candidate a reddening value determined as the weighted average of the reddenings of the five closest reference UMS stars within 5 pc (20), using as weight where is the projected distance. All young PMS candidates have at least 2 reference UMS neighbours within 5 pc with a median number of 15. The reddening values for young PMS candidates vary from to , or to (respectively the 17 and 83 percentiles), with a median or . All these values include the Galactic component along the line of sight.
To determine the uncertainty introduced by this reddening correction, we applied the same method to UMS stars, using as neighbours the five closest reference UMS objects within 5 pc, excluding the star itself. Compared to the colour that the star would have when translated along the reddening vector to the 3 Myr isochrone (solid blue line in Figure 1), we found a typical difference of mag (). We will use this value as a measure of the statistical uncertainty introduced by the nearest neighbour reddening correction.
For the older PMS candidates using the nearest neighbours would not be appropriate, owing to their different spatial distribution (see Figure 4). In this case, the only acceptable solution is to apply to all older PMS stars one and the same reddening value. The minimum possible value is , which corresponds to the Galactic intervening extinction. The maximum statistically acceptable value is one that would move no more than of the stars to the left of the adopted MS, i.e. that would make them appear bluer than the solid blue line in Figure 3. This would correspond to the deviation. This is the case for . Thus, all reddening values in the range are possible. We will adopt as a representative value and will specifically address the effects that assuming or for these candidate PMS stars would have on the derived physical parameters.
An important conclusion that we can already draw is that the older PMS candidates are placed in front of the R 136 cluster and are separated from it by a conspicuous amount of absorbing material. This stems from the fact that: 1) the maximum reddening towards these objects () is considerably lower than the reddening towards the younger PMS stars (17 percentile ); and 2) their spatial distribution is uniform over the field. The separation in and spatial distribution confirms that younger and older low-mass PMS candidates are associated with distinct star formation episodes across the volume probed by these observations. In particular, it appears that star formation has proceeded into the region.
5. Physical properties of bona-fide PMS stars
In order to select bona-fide PMS stars, after reddening correction in all bands we repeated the procedure discussed in Section 4 to identify objects with excess emission but imposing stricter constraints. In particular, we only considered stars with a reddening-corrected excess at the level or higher. Furthermore, to avoid contamination by stars with significant chromospheric activity, we only considered objects with equivalent width of the emission Å (for details on deriving from the photometry see e.g. De Marchi et al. 2010, 2011a, 2013a). We note that this high threshold on excludes from the sample all weakly-accreting PMS stars present in the field. This is not a problem, however, since our goal is to study the properties of the mass accretion process in PMS stars. This requires a sample of bona-fide objects, but completeness is not essential.
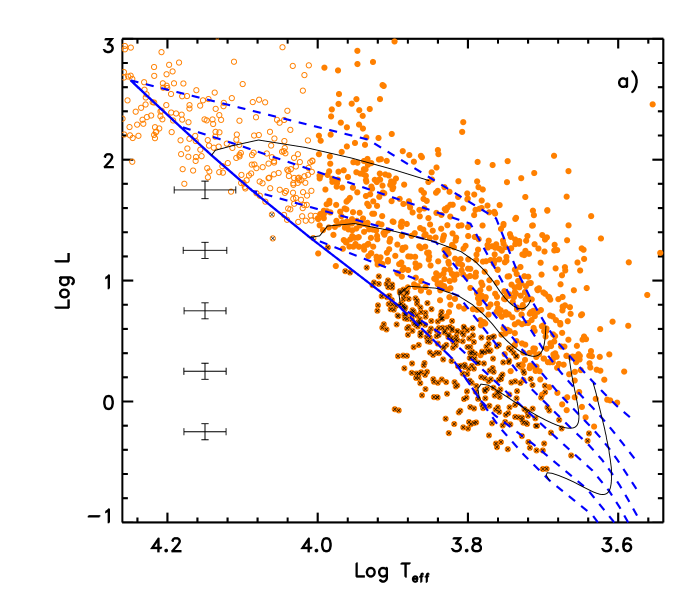
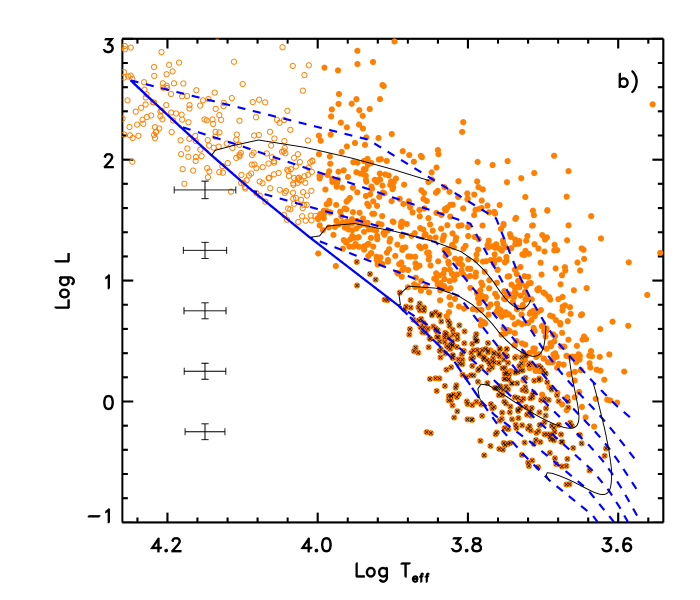
This more stringent selection reduced the sample to 1 035 stars with effective temperature K. They are shown as filled dots in the Hertzsprung–Russell (H–R) diagrams in Figure 5. Unfilled dots correspond to stars hotter than 10 000 K that we will not consider in this work. These are objects typically more massive than M⊙ and might contain Be stars that are evolving off the MS. Even though we could derive the mass of these objects from their broad-band colours, without spectroscopy their age would be rather uncertain because they may be both pre- and post-MS stars. This, in turn, would make the comparison more difficult with the lower-mass PMS stars of interest here. We will not consider these objects further here and will address the properties of these emitting stars in a future work (De Marchi & Panagia, in preparation).
We note that amongst the objects with excess in Figure 5 there could be a very small fraction of evolved stars with circumstellar envelopes, including planetary nebulae and post-AGB stars. Objects in these phases, however, are short-lived, with typical lifetimes of yr (e.g. Vassiliadis & Wood 1994; Habing 1997). This is about three orders of magnitude shorter than the He-burning lifetime of stars in the RC phase ( yr, e.g. Girardi & Bertelli 1998; Girardi et al. 1998). With a total of about 180 RC stars in the field of our investigation (De Marchi & Panagia 2014), one expects less than one of these post-AGB stars in our sample of objects with excess. Their contribution is, therefore, negligible and can be ignored.
5.1. Bolometric luminosity and effective temperature
The value of the effective temperature was derived from the dereddened colour, since in the range K of interest here this is an excellent index for temperature determinations (e.g. Bessell et al. 1998; von Braun et al. 1998; Romaniello 1998). The models of Bessell et al. (1998) already discussed in Section 3 were used in the conversion. The bolometric luminosity () was derived from the dereddened magnitude and the same models, having assumed a distance modulus of . The typical uncertainties on the and are shown by the error bars on the left-hand side of Figure 5 (these uncertainties include the effects of the reddening correction). Note that the uncertainty on is on average larger for brighter stars, since they tend to be hotter and the colour becomes increasingly less sensitive to variations.
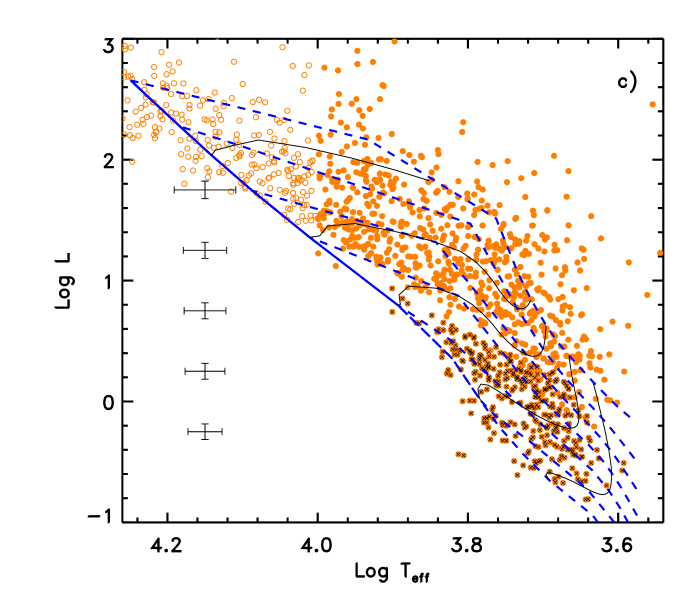
The three panels in Figure 5 refer to the same objects, but in each panel we have used a different reddening value for the stars classified as older than 5 Myr in the CMD of Figure 3. As discussed in Section 4, the values are (panel a), (b), and (c). The corresponding objects are marked with crosses. For reference, we have traced in each panel the PMS isochrones (dashed lines) from the models of Tognelli et al. (2012) for the assumed metallicity. Isochrones are shown for ages of 1, 2, 4, 8, 16, 32, and 64 Myr, from right to left. The separation between isochrones is typically larger than the uncertainties on and (see error bars). Also shown are the representative evolutionary tracks for masses of and 4 M⊙ (solid curves) from the same Tognelli et al. (2012) models.
The paucity of objects with K and in panels b) and c) appears somewhat unphysical, and might suggest that the reddening values adopted for the older PMS stars in those cases are too low. A similar indication comes from the mass distribution (see below). However, since one cannot a priori exclude those lower values, we include the corresponding H–R diagrams here for reference.
5.2. Mass and age
By means of a finer grid of models than the one shown in Figure 5, we derived the individual masses and ages of the bona-fide PMS stars. We followed the approach originally discussed by Romaniello (1998) and more recently refined by De Marchi et al. (2011a, 2011b, 2013a). The method is similar to the one presented by Da Rio & Robberto (2012) and provides the probability distribution for each individual star to have a given value of the mass and age, purely on the basis of the measurement errors, and without making assumptions on the properties of the population, such as the functional form of the initial mass function.
Briefly, the position of each star in the HR diagram is compared with PMS evolutionary tracks in order to derive the most likely age and mass for that object. The evolutionary tracks used are those of Tognelli et al. (2011) mentioned above, interpolated to a finer mass grid with a logarithmic step of .
We first define a grid in luminosity and temperature in the HR diagram, with evenly spaced cells and logarithmic steps both in temperature and luminosity. The sizes of the cells are chosen to be comparable to the typical observational errors. Then, given the evolutionary model of a star of a certain mass, we identify all the cells that that star crosses throughout its evolution. For each cell, we compute the crossing time (difference between the times of exit and entrance) and characteristic age (average of exit and entrance times). We repeat this process for all the tracks resulting from the interpolation mentioned above.
The results are four matrices containing all the relevant information associated with the evolutionary tracks crossing that cell, namely mass, age, time of permanence in the cell, and multiplicity for that cell (number of possible solutions). Given an observed star, the cell of the grid to which that star belongs gives us the most likely mass and age of the objects. If more than one solution is possible for that cell, because more than one track crosses the cell or the same track crosses it at different times, we assign an appropriate weight to each solution. As zero-th order approximation, assuming a constant birthrate, the weight is proportional to the time a given track spends in that cell. Although this is typically sufficient for rapidly evolving PMS stars, subsequent iterations are used to take into account a more realistic star formation history.
The largest source of uncertainty on the derived masses and ages comes from the reddening correction. For younger PMS stars, where the reddening correction is applied individually using the nearest-neighbours method, the typical uncertainty on is about mag, as mentioned in Section 4. This translates into a typical uncertainty of % on the mass and of % on the age. For older PMS objects, where all stars are assigned the same value, we measured how varying over the full range from to affects the individual masses and ages. Objects appear more massive when grows and the typical mass variation introduced by a spread of mag in is about 8 %. The effect on the age is about twice as large, corresponding to %.
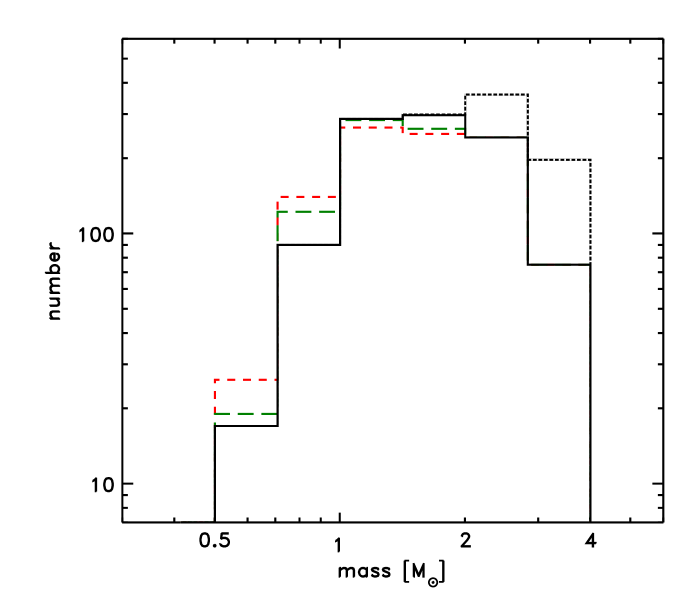
The histogram with the mass distribution for the 1 035 PMS stars are shown in Figure 6. The binning has been selected to match the evolutionary tracks in Figure 5 and is several times wider than the typical uncertainty on the mass. Different line types correspond to different choices for the older PMS objects as mentioned above, respectively (solid line), (long-dashed line), and (short-dashed line). The histograms show a larger number of more massive stars when the value of is higher, and correspondingly a smaller number of massive stars when the value of is lower. However, the three mass distributions are rather similar and statistically significant differences () are only seen in the mass range M⊙ .
The histograms show a relatively broad peak in the range M⊙ . We underline that, while these measurements show the relative mass distribution of PMS stars, they cannot set constraints on the shape of the mass function, since we are only considering PMS stars that had excess emission at the time of the observations and we are also not accounting for the unavoidable photometric incompleteness, which is more severe at low masses.
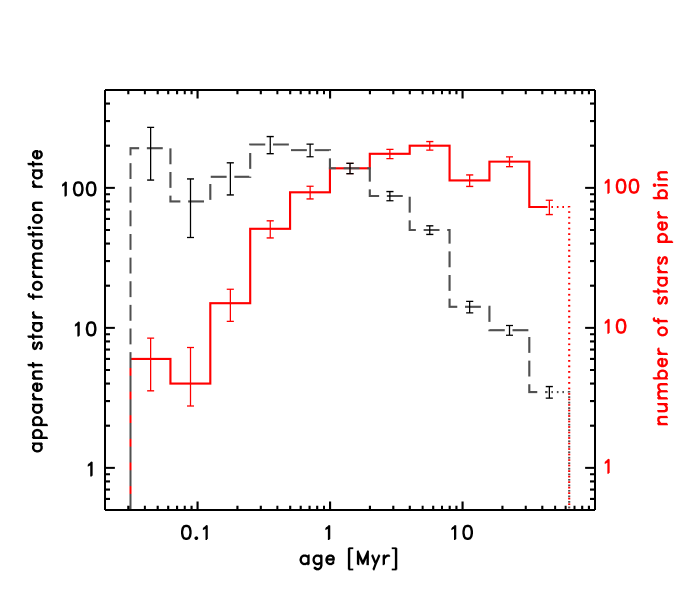
The histograms in Figure 7 show the age distribution for the PMS stars, for an assumed for objects older than 5 Myr. The solid line gives the number of stars in each age bin, which we have selected with a constant logarithmic step of a factor of 2 to match the isochrones in Figure 5. The age bins are several times wider than the uncertainty on the age. The dashed line gives the apparent rate of star formation, obtained by dividing the number of stars in each bin by the age extent of the bin. The figure can be directly compared with Figure 10 of De Marchi et al. (2011c) and it is consistent with it: the apparent star formation rate in the past 2 Myr is M⊙ Myr-1 and it drops to M⊙ Myr-1 between 20 and 30 Myr ago.
These are necessarily lower limits to the star formation rate, because we only consider here PMS stars with excess emission at the level or more at the time of the observations. Moreover, young stars show large variations in their emission over hours or days (e.g. Fernandez et al. 1995; Smith et al, 1999; Alencar et al. 2001). Furthermore, an active state of accretion is expected to decrease with age (e.g., De Marchi, Panagia & Sabbi 2011; Fedele et al. 2010) and this must be at least partly responsible for the rapid decline seen at ages older than Myr. In fact, if the fraction of PMS stars with excess had an exponential decay with time (Fedele et al. 2010), episodes occurring more than 20 Myr ago might have contributed to a large portion of the stars in this region and the star formation strength might have been considerably higher than that of the current episode associated with R 136.
Adopting the reddening or for the older PMS stars would have produced, respectively, a slightly steeper or shallower drop of the apparent star formation rate for ages older than Myr. The differences, however, are not significant as they do not exceed . The reason is that in the CMD the isochrones are almost parallel to one another for stars less massive than M⊙ and older than 10 Myr, which are the objects of interest here. Therefore, the reddening vector intersects the isochrones at a similar angle, resulting in rather similar star formation rates. De Marchi et al. (2011c), using the Galactic extinction law, found a somewhat gentler drop of the apparent star formation rate beyond 10 Myr (see their Figure 10). Qualitatively the drop is similar to the one we find here, but Figure 7 is quantitatively more accurate because it is based on the extinction law appropriate for this region.
We can thus confirm that in the central 30 Dor regions star formation is not limited to the most recent episode associated with the Myr-old massive members of R 136, but has been ongoing for at least Myr, proceeding from the outer layers towards the interior. An accurate knowledge of the extinction law and of the value of are crucial to obtain quantitative information and assign a mass and an age to individual PMS stars. Nonetheless, some qualitative properties of these populations, such as the star formation rate for older PMS stars approaching the MS, do not appear to depend crucially on the precise amount of the reddening. This is important in those regions where only approximate information exists about extinction.
5.3. Accretion luminosity and mass accretion rate
The luminosity is obtained, after reddening correction, from the difference between the colour of PMS stars and the reference relation defined in Section 3, for objects of the same effective temperature. Also needed are the photometric zero-point and absolute sensitivity of the instrumental setup (in this case, the F656N filter of the WFC 3), as well as the distance modulus. The procedure is addressed in detail in De Marchi et al. (2010, 2011a, 2013a) and we refer the reader to those papers for further particulars.
The main source of uncertainty on is, once again, the reddening correction. In the colour–colour diagram (Figure 2), the reddening vector is substantially parallel to the reference template (dashed line), so extinction has a practically negligible effect on the colour excess and on the equivalent width. However, since depends on the level of the underlying continuum, any uncertainty on the latter will also affect . The mag uncertainty on discussed earlier corresponds to an uncertainty of mag on the absolute magnitude of the stars and hence a % uncertainty on the luminosity.
The median is L⊙, with the 17 and 83 percentile levels in the distribution at L⊙ and L⊙, respectively. These values are in line with those measured by De Marchi et al. (2011a) in the massive cluster NGC 346 in the Small Magellanic Cloud (SMC). On the other hand, they are about an order of magnitude higher than those measured in the smaller SMC cluster NGC 602 (De Marchi et al. 2013a). The difference, however, is not surprising because these observations probe stars of different masses.
From we can derive the accretion luminosity , which corresponds to the total energy released by the accretion process that is assumed to result into ionising and heating of the circumstellar gas (e.g., Hartmann et al. 1998). As discussed in De Marchi et al. (2010, 2011a, 2013a), there is both observational and theoretical evidence suggesting a linear dependence between and , implying that a constant fraction of the gravitational energy released in the accretion process goes into emission. More recently, Ingleby et al. (2013) found a consistent slope of unity not only for , but also for the luminosities in , Ca II K, C II], and Mg II.
De Marchi et al. (2010, 2011a, 2013a) found from the analysis of a set of measurements of a group of T Tauri stars in Taurus–Auriga compiled by Dahm (2008) and based on a sample originally studied by Valenti et al. (1993). We will use this relationship to derive from our PMS objects from the observed values. It is interesting to note that this proportionality factor between and corresponds to what one would expect for the ionising radiation of the atmosphere of a K star (see Panagia 1973). While this finding does not per se identify the specific location where the energy is produced (e.g. an accretion shock, a stellar transition region, a shock in the stellar outflow, etc.), it suggests the existence of a heated region close to the photosphere (for a recent review of the emission mechanisms see Ardila et al. 2013).
The statistical uncertainty on is dominated by the quoted 22 % uncertainty on associated with the correction for reddening. There is a larger systematic uncertainty, namely a factor of , due to the poorly known ratio (see Dahm 2008; De Marchi et al. 2011a), but since this ratio is the same for all stars, this uncertainty will not hamper the comparison between different objects.
Once is known, we can derive the mass accretion rate . The free-fall equation links the luminosity released by the impact of the accretion flow with the rate of mass accretion, according to the relationship
| (1) |
where is the gravitational constant, the star’s mass determined above and its photospheric radius, obtained from its luminosity and effective temperature. is the inner radius of the accretion disc and its value is rather uncertain. We follow Gullbring et al. (1998) and adopt for all PMS objects.
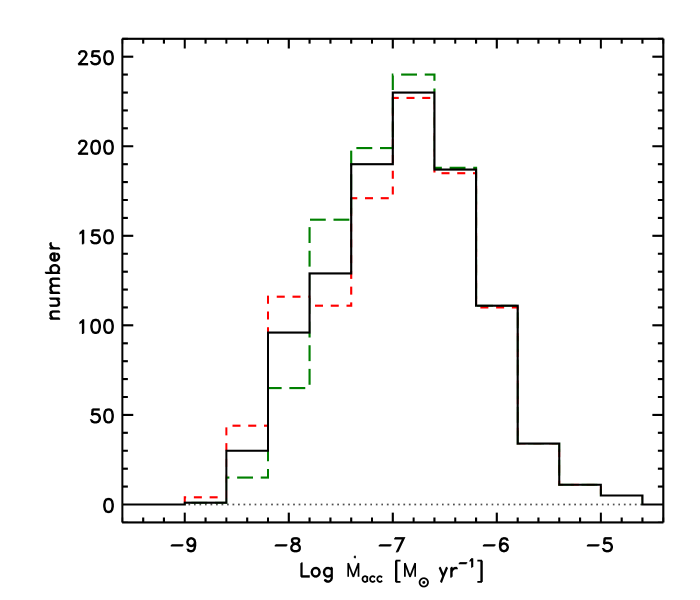
Histograms of the measured values of the mass accretion rate are shown in Figure 8, and the median value in our sample is M⊙ yr-1. The solid line refers to for the PMS stars older than Myr, while the short-dashed and long-dashed lines correspond, respectively, to and .
The main source of statistical uncertainty on is, again, the correction for reddening, which introduces an uncertainty of % on as mentioned above. Also the ratio is sensitive to uncertainties on the reddening correction, but to a smaller extent. De Marchi et al. (2010) have shown that, in the H–R plane, the reddening vector is almost parallel to the lines of constant radius (see their Figures 10 and 11), and therefore extinction affects only marginally the estimate of the stellar radius. However, since at low temperatures the reddening vector crosses the evolutionary tracks, any unaccounted extinction would lead to an underestimate of the stellar mass, thus resulting in a systematically higher value of the ratio. On the other hand, this effect is relatively small, and a typical uncertainty of mag in , as relevant in our case, corresponds to an uncertainty of % on the ratio. In summary, the combined statistical uncertainty on amounts to %. When also the systematic uncertainties due to the conversion between and are considered, the final combined uncertainty on amounts to less than a factor of 2. This is important, because it allows us to make a solid comparison between the values for objects of different masses and ages across our sample.
6. Mass accretion rate and stellar parameters
The broad distribution of values seen in Figure 8 reflects the wide range of masses and ages covered by this sample. We will now explore how depends on both and for these stars, and later will compare these results with other massive star forming regions in the MCs and MW. The large size of our samples of PMS stars will allow us to derive statistically significant conclusions.
We begin by combining information on the three parameters in one graph, showing in Figure 9 the values of as a function of . The 30 Dor PMS stars are marked by diamonds and the size of the symbols is proportional to the mass (see legend). As a representative value of the extinction for PMS stars older than 5 Myr (unfilled diamonds) we have assumed . Overall, the mass accretion rate of the 30 Dor objects appears to decline with age as , as shown by the best fit to the data (dashed line). The other symbols, as per the legend, correspond to a sample of Galactic T-Tauri stars studied by Sicilia-Aguilar et al. (2006, 2010), and the typical uncertainty on their values is shown by the large cross at the bottom. These objects suggest a steeper drop of with , consistent with the models of viscous disc evolution by Hartmann et al. (1998) shown by the solid line.
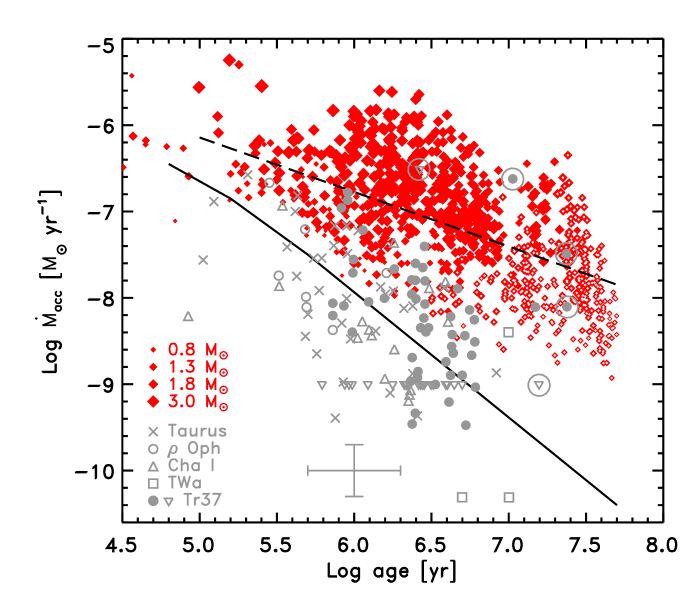
The observed slope () is in good agreement with those measured in other MCs environments, namely NGC 346 (; De Marchi et al. 2011a) and NGC 602 (; De Marchi et al. 2013a) in the SMC. However, it is considerably shallower than the slope predicted by the models of Hartmann et al. (1998; see also Calvet et al. 2000; Muzerolle et al. 2000). A steeper decline, consistent with these models, has also been observed by Barentsen et al. (2011) and Beccari et al. (2015) for low-mass stars ( M⊙ ) in Galactic clusters, respectively in Tr 37 in Cepheus and Tr 14 in the Carina Nebula.
Therefore, there might be differences between the MCs and the Galaxy environments affecting how the mass accretion rate scales with age. However, to properly explore this possibility, we cannot simply rely on graphs of the type of Figure 9, since the mass spread present at all ages in that figure contributes to the apparent scatter. In fact, is also expected to depend on . In the low-mass regime, this dependence could be as steep as (Muzerolle et al. 2003, 2005; Natta et al. 2004, 2006; Calvet et al. 2004), or even steeper in the very low-mass domain (Fang et al. 2009). On the other hand, those conclusions are based on rather limited samples of a few dozens PMS stars each, often with a significant age spread. In the Appendix, we address how an age spread affects the inferred mass dependence of and results in erroneously steep indices.
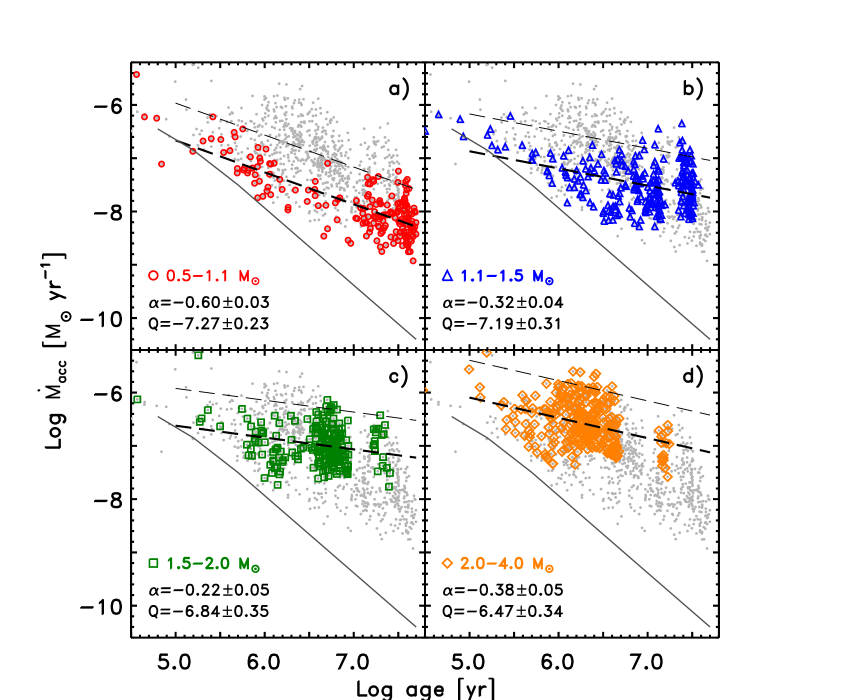
Figure 10 shows the values of in 30 Dor as a function of age for four roughly equally populated mass groups, namely, M⊙ , M⊙ , M⊙ , and M⊙ . Also given in each panel are the slope and intercept (at 1 Myr) of the best linear fit to the data (dashed lines), according to the relationship with the age in Myr. The values of the slope range from to and are in relative agreement with one another, (mean and standard deviation ), but are all considerably shallower than the slope predicted by the models of Hartmann et al. (1998; solid line in the figure). We note that our conservative selection of only the bona-fide PMS stars with Å does not appear to affect the measured slopes. As already discussed in detail in Paper II for the case of NGC 346, the upper envelopes of the distribution of all four mass groups appear to be fully consistent with the slope of the best fit in each panel. To highlight this, the thin long-dashed lines shown in the figure represent the lines of best fit shifted vertically by dex. Therefore, even if our conservative detection limits do not allow us to identify objects with low , no selection effects are to be expected for stars with high excess. Since the distribution of these objects is consistent with the slope of the best fit, the latter is not skewed by having ignored objects with the smallest mass accretion rates, and therefore it must be correct.
The dependence of the mass accretion rate on the stellar mass is described in a qualitative way by the systematic growth of with increasing mass. However, the values of listed in Figure 10 cannot be directly compared to one another to find the formal dependence of on , because they refer to different slopes . In this case, assuming that all stars in our sample formed under the same conditions, a proper and quantitative analysis is only possible through a multivariate least-squares fit that takes into account the simultaneous dependence of on both and . This approach is allowed by the large size of our PMS stars sample. Adopting a simple relationship of the type
| (2) |
De Marchi et al. (2011a, 2013a) found and for NGC 346 and and for NGC 602, both in the SMC. These values apply to objects in the mass range M⊙ and younger than Myr. If we consider the objects with these characteristics in our 30 Dor sample, we find and . De Marchi et al. (2013a) already pointed out that approximate values of and result in fits with small residuals for both NGC 346 and NGC 602 and this is confirmed also for 30 Dor.
7. Mass accretion rate and environment
Comparing the mass accretion properties of the stars in 30 Dor with those in NGC 346, NGC 602, and other star-forming regions in the MCs and in the Galaxy can provide quantitative information on the effects of the environment on the final stages of star formation. To account for differences in the environment, it is convenient to rewrite the power-law dependence on mass and age in logarithmic form, namely
| (3) |
If the mass accretion rate were only a function of and , the term would be a constant, representing in practice an “effective mass accretion rate”, namely the mass accretion rate of a 1 M⊙ PMS star with an age of 1 Myr. In practice, however, the best fitting value of the term in each region will reflect environmental effects, which are not considered explicitly in Equation 3, such as for instance the metallicity, the mean gas density, or the strength of the local magnetic field. The effects of metallicity are particularly interesting, since in general a lower metallicity implies a lower opacity, temperature, and viscosity for the disc, and thus a longer viscous time (e.g. Durisen et al. 2007).
| Region | Reference | Stars | ||||||||
|---|---|---|---|---|---|---|---|---|---|---|
| (1) | (2) | (3) | (4) | (5) | (6) | (7) | (8) | (9) | (10) | (11) |
| NGC 346 | De Marchi et al. (2011a) | 375 | ||||||||
| NGC 602 | De Marchi et al. (2013a) | 105 | ||||||||
| 30 Dor | this work | 291 | ||||||||
| SN 1987A | De Marchi et al. (2010) | 55 | ||||||||
| Tr 14 | Beccari et al. (2015) | 237 | ||||||||
| NGC 3603 | Beccari et al. (2010) | 244 |
Note. — Table columns are as follows: (1) names of the regions; (2) works from which the PMS catalogues are taken; (3) number of PMS stars in each region with mass in the range M⊙ and younger than Myr; (4) metallicity in units of ; (5 – 7) best fitting parameter values as per Equation 3; (8 – 11) best fitting parameter values as per Equation 4.
Besides 30 Dor, NGC 346 and NGC 602, we consider PMS stars in the SN 1987A field (De Marchi et al. 2010), in Tr 14 (Beccari et al. 2015) and from an ongoing study in NGC 3603 (De Marchi, Beccari & Panagia, in prep.; see also Beccari et al. 2010). PMS objects in these regions have been identified and characterised in a homogeneous way from their excess emission, so they represent a particularly uniform sample. Following the same approach, Spezzi et al. (2012) studied three more regions in the LMC located between 30 Dor and the SN 1987A field. However, we do not include them in the present study since the extinction law adopted in that work is now superseded (Maíz Apellániz et al. 2014; De Marchi & Panagia 2014; De Marchi et al. 2016), likely resulting in artificially inflated values of the mass accretion rate.
Details of the 6 regions considered here are listed in Table 1. Besides the names of the regions (column 1), we indicate the works from which the PMS catalogues are taken (column 2), the number of stars in each sample (column 3), the metallicity (column 4), and the values of the best-fitting parameters resulting from Equations 3 and 4 (columns 5–11).
Concerning the metallicity, we consider a wide range of values for NGC 602. This cluster and associated N 90 nebula are in the SMC Wing, for which Lee et al. (2005) derived a chemical composition similar to that of other SMC stars, based on the analysis of four B-type supergiants. Therefore, in the literature (see, e.g., Carlson et al. 2007; Nigra et al. 2008; Cignoni et al. 2009; Gouliermis et al. 2012; Oskinova et al. 2013; De Marchi et al. 2013a) it is customary to adopt for NGC 602 the same metallicity as for the SMC, namely . However, there is no proper direct measurement of the metallicity of NGC 602 itself. From optical spectroscopy of Sk 183, the brightest ionising star in NGC 602, Evans et al. (2012) derived a N abundance close to the solar value, namely compared to for the sun (Asplund et al. 2009), and as such significantly richer than the typical values found in H II regions in the SMC (; Russell & Dopita 1990). Thus, adopting (see e.g. Asplund et al. 2009; Lodders 2010; Caffau et al. 2010, 2011), the Sk 183 metallicity value is . Although the N enrichment in Sk 183 could in part result from CNO-processed gas dredged up to the stellar surface, as suggested for Sher 25 or the progenitor to SN 1987A (e.g., Smartt et al. 2002), it is quite possible that the metallicity of the NGC 602 region is considerably higher than the SMC average. Thus, we will consider for NGC 602 a range of values between and .
We restrict our investigation to active PMS stars (i.e. those currently undergoing mass accretion) with masses in the range M⊙ and younger than Myr. The combined sample includes 1 307 objects (see Table 1).
The parameter values providing the best simultaneous fit as per Equation 3 are and (columns 5 and 6 in Table 1), with a reduced . Using these parameter values, we derive for each region the value of listed in Table 1 (column 7). As mentioned above, can be used to explore the effects of the environment on the mass accretion rate. Available data were already indicating that the physical conditions of the environment have an effect on the extent and duration of the star formation process, since the mass accretion rate for stars of the same mass and age appears to be systematically higher in the MCs than in the Galaxy, (De Marchi et al. 2011a, 2013a). It is, thus, very interesting to investigate whether there is an explicit dependence of on metallicity.
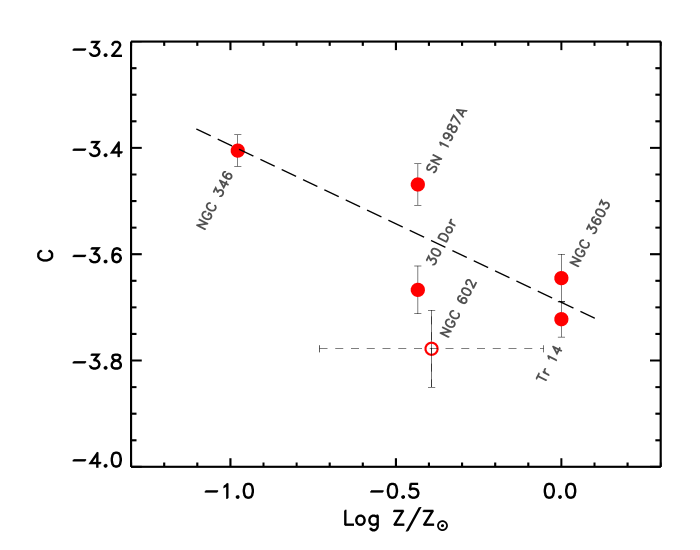
Indeed, the run of as a function of metallicity shown in Figure 11 reveals a correlation between these quantities (the metallicity is shown in solar units, having adopted ). To better quantify the level of correlation, we compute its Pearson’s correlation coefficient. This parameter does not allow us to account for uncertainties on the data points. Since an accurate metallicity for NGC 602 is not yet known and a very wide range of values is possible, we will ignore this region when calculating the coefficient. In this case, the correlation is significant to better than the 10 % level (). If the metallicity of NGC 602 were close to , as the only available spectroscopic abundance measurements suggest (Evans et al. 2012), the correlation would be statistically significant at the 5 % level (). The formal best linear fit, obtained ignoring NGC 602, is (dashed line).
In light of the metallicity trend revealed by Figure 11, we can rewrite Equation 3 in a format that explicitly includes the metallicity dependence, namely
| (4) |
We have fitted this relationship to all selected 1 307 stars in the regions listed in Table 1. As for the values of the parameters that simultaneously best fit all regions, the dependence on mass and age remain practically unchanged (, ), and , as indicated in Table 1 (columns 8, 9, 10). The values of the parameter are also listed in Table 1 (column 11). The reduced is , suggesting that indeed the metallicity could play an important role in determining the mass accretion rate of a star. The observations do not reveal the exact mechanism, but one possible explanation for the role of metallicity on the rate of mass accretion, and hence on the intensity and duration of the accretion process, is that the lower radiation pressure exercised by the forming star on low-metallicity disc material is less efficient at dispersing the disc. Thus, the accretion process may remain active for a longer time in lower-metallicity environments.
However, metallicity alone might not be sufficient to explain all the differences that we see in the mass accretion rates in our sample, particularly if the true metallicity of NGC 602 is close to the lower end of the range considered in Table 1 (). In that case, the difference between the expected and measured values of exceeds a deviation and suggests that there might be additional environmental effects causing a characteristically lower mass accretion rate in this region.
One possibility is lower gas density. NGC 602 is indeed a relatively low-mass star-forming region located outside the main body of the SMC, as mentioned above, in the so-called SMC Wing, a region characterised by a moderate neutral hydrogen (HI) column density. Nigra et al. (2008) discussed the environment of NGC 602, pointing out that the large number of galaxies visible both outside and within the nebula indicate that the region is generally transparent, i.e. it lacks large-scale dust and molecular concentrations. On the basis of photometry, high-resolution echelle spectroscopy, and 21 cm HI spectrum survey data, they concluded that NGC 602 formed at the periphery of a low-density HI cloud, under conditions that are marginal for star formation.
The other regions listed in Table 1 formed in typically denser environments, as witnessed for instance by the higher intra-cluster extinction values (for NGC 346 see e.g. Sabbi et al. 2007, Hennekemper et al. 2008, De Marchi et al. 2011a; for NGC 602 see e.g. Carlson et al. 2007, Schmalzl et al. 2008, De Marchi et al. 2013a; for the SN 1987A field see e.g. Romaniello 1998, Panagia et al. 2000, Romaniello et al. 2002; for 30 Dor see e.g. Maíz Apellániz et al. 2014, De Marchi & Panagia 2014, De Marchi et al. 2016; for Tr 14 see e.g. Sana et al. 2010, Hur et al. 2012, Beccari et al. 2015). Therefore, it is possible that the average lower mass density in NGC 602 resulted in less massive and more anemic circumstellar discs, in turn implying more modest accretion rates. In order to address this possibility in more detail, we plan to derive more accurate metallicity information for NGC 602 from spectroscopic measurements of the O/H ratio.
8. Summary and conclusions
We have studied the properties of the young stellar populations in a field of around the centre of 30 Dor that was observed in 2009 October with the WFC 3 on board the HST and originally studied by De Marchi et al. (2011c). In order to identify PMS stars still actively accreting matter from their circumstellar discs, we have employed the photometric detection method described in detail Papers I and II of this series (De Marchi et al. 2010; 2011a). Without requiring spectroscopic observations, this method allows us to combine broadband and photometry with narrow-band imaging in order to identify stars with excess emission, to measure their accretion luminosity , and to derive their mass accretion rate . The results of our analysis of 30 Dor can be summarised as follows.
-
1.
From the original photometric catalogue of De Marchi et al. (2011c), updated according to the most recent WFC 3 photometric zero points, we extracted about 18 800 sources detected simultaneously in the and bands with photometric uncertainties of less than mag in both bands. About of these stars have a colour exceeding that of normal stars by at least mag or by three times the photometric uncertainty on the colour (i.e. ), whichever is larger, and their combined photometric uncertainty in all three bands does not exceed mag. This is our initial sample of PMS candidates. Their locations across the CMD indicate a spread of ages exceeding 10 Myr.
-
2.
We corrected for extinction the photometry of all young stars in the field (i.e. PMS and UMS objects) using the most recently derived extinction law specific for 30 Dor (Maíz Apellániz et al. 2014; De Marchi & Panagia 2014; De Marchi et al. 2016). This field is known to contain significant differential extinction () and to display an extinction law considerably different from the standard Galactic one.
-
3.
Younger PMS stars ( Myr) and UMS stars share a very similar spatial distribution, so we used the closest reference UMS stars to derive an individual reddening correction for each younger PMS object. The typical uncertainty on this reddening correction is mag on or mag on . Older PMS stars ( Myr) have a rather uniform spatial distribution and a more limited intrinsic reddening spread (), so we applied one and the same correction to all stars. We adopted the average value of and discussed the consequences of using or instead. For all PMS stars, we also account for the additional component due to the intervening Galactic absorption along the line of sight.
-
4.
We find that the older PMS candidates are located in front of the R 136 cluster and are separated from it by a conspicuous amount of absorbing material. Besides a more uniform spatial distribution, the maximum total extinction towards the older PMS objects () is considerably lower than the extinction towards the younger PMS stars (17 percentile ). The observations indicate that star formation has proceeded from the periphery into the interior of the region.
-
5.
The final catalogue of bona-fide PMS stars contains 1 035 objects. We determined their effective temperatures, luminosities, and radii by comparing their photometry to the stellar atmospheric models of Bessell et al. (1998). The masses and ages were derived by comparing their luminosities and effective temperatures with the PMS evolutionary models of the Pisa group (Tognelli et al. 2012) for an adopted metallicity . The masses are in the range M⊙ with a median of M⊙ . The median age is Myr, but the sample spans the range Myr, confirming that star formation was active in this field well before the recent episode giving birth to the R 136 cluster Myr ago.
-
6.
We set a lower limit to the star formation rate for the current ( Myr) burst of M⊙ Myr-1, while at Myr the apparent rate drops to M⊙ Myr-1. These are both necessarily lower limits, since they include only stars in the range M⊙ that were undergoing active mass accretion at the time of the observations. Furthermore, if the fraction of PMS stars with excess decays exponentially with time, the episode or episodes older than Myr ago might have been considerably stronger than the current one.
-
7.
From the measured luminosity of these PMS stars we derived the accretion luminosities and, through the other stellar physical parameters, also their mass accretion rates . The sample includes objects with M⊙ yr M⊙ yr-1. Our stringent selection of stars with excess emission above the level limits the identification of objects with lower values that are expected to exist in this field.
-
8.
The dominant source of statistical uncertainty on the stellar physical parameters is the reddening correction. The typical mag uncertainty on translates to an uncertainty of on the mass, on the age, on and , and on the stellar radius-to-mass ratio. The combined statistical uncertainty on amounts to . When also the systematic uncertainties on the conversion between and are considered, the final combined uncertainty on amounts to less than a factor of 2. This permits a solid comparison between the values for objects of different masses and ages across our sample.
-
9.
We studied the relationship between the mass accretion rate and the mass and age of the PMS stars in our sample. We show that attempts to derive correlations by simply fitting separately the observed dependence of on mass and age may introduce large biases and result in indices that do not have general validity, because the combined effects of age on both and the range of masses in the sample are ignored. Since these effects are intertwined, a proper multivariate fit is needed. A linear regression fit of the type , where is the age of the star in Myr and its mass in M⊙ , gives and for 30 Dor. These values are compatible with those found for NGC 346 and NGC 602 in the SMC.
-
10.
We applied the same multivariate regression fit to a uniform sample of 1 307 PMS stars obtained by selecting all objects with masses of M⊙ and younger than Myr contained in six different star-forming regions, namely 30 Dor and the SN 1987A field in the LMC, NGC 346 and NGC 602 in the SMC, and Tr 14 and NGC 3603 in the Galaxy. The values of the parameters and that simultaneously best fit all regions are and , with . The values of and over the entire sample converge to values that, within the uncertainties, are quite close to those of the individual regions.
-
11.
The residuals are systematically different between the six regions and they reveal a strong correlation with metallicity, of the type . If the metallicity dependence is explicitly included in a multivariate fit of the type , the best fitting parameter values remain practically unchanged (, , ) and the corresponding reduced drops to . This finding confirms the validity of the observed dependence of on metallicity.
-
12.
A possible interpretation of the observed trend with metallicity is that when the metallicity is higher there are more grains in the disc and therefore radiation pressure limits the accretion process, both in its rate and duration.
In conclusion, the analysis of the data shown in Figure 11 and Table 1 reveals that the general properties of the environment, such as the metallicity and possibly the gas density, can affect appreciably the accretion process on a global scale. Obviously, the evolution and mass accretion history of individual PMS stars can still vary widely within the same region due to effects such as the proximity of massive ionising stars (e.g. De Marchi et al. 2010; Zeidler et al. 2016) or tidal interactions (e.g., Olczak, Pfalzner & Eckart 2010), both of which can disrupt the circumstellar discs and prematurely terminate the accretion process, as recently observed in the centre of the Orion Nebula Cluster (Mann et al. 2014). It is, however, apparent that there are systematic differences in the accretion process between different environments, with the mass accretion process lasting longer at low metallicity. We note that our conclusions appear to not agree with claims by Yasui et al. (2009; 2010; 2016) that in some low-metallicity Galactic environments the lifetimes of discs are instead shorter. However, those works measure only the apparent dust content of circumstellar discs and use that as a proxy for the total mass of the discs and for their lifetimes. We instead measure directly the infall of the much more abundant gas onto the stars.
Of course, the conclusions that we have drawn so far are necessarily still preliminary, because they are based on a limited sample of star forming regions in the MW and MCs. Nonetheless, given the accuracy on the mass accretion rates derived photometrically with the method discussed in this and previous articles in this series, as the sample of studied regions grows it will be possible to set stronger constraints on the dependence of the mass accretion process on the general properties of the environment. Even stronger constraints on the accretion physics, and in particular on the kinematics of the infalling gas, will come from NIR multi-object spectroscopy of hundreds of PMS objects in forming regions in the Galaxy and MCs with the James Webb Space Telescope (Gardner et al. 2007). These guaranteed-time observations222The list of approved observations is available at https://jwst-docs.stsci.edu/display/JSP/JWST+GTO+Observation+Specifications will also include coordinated NIR photometry of the targets, providing for the first time a solid and simultaneous characterisation of the gas and dust properties of circumstellar discs in these low-metallicity environments.
Appendix
The pitfalls of piecemeal best fitting
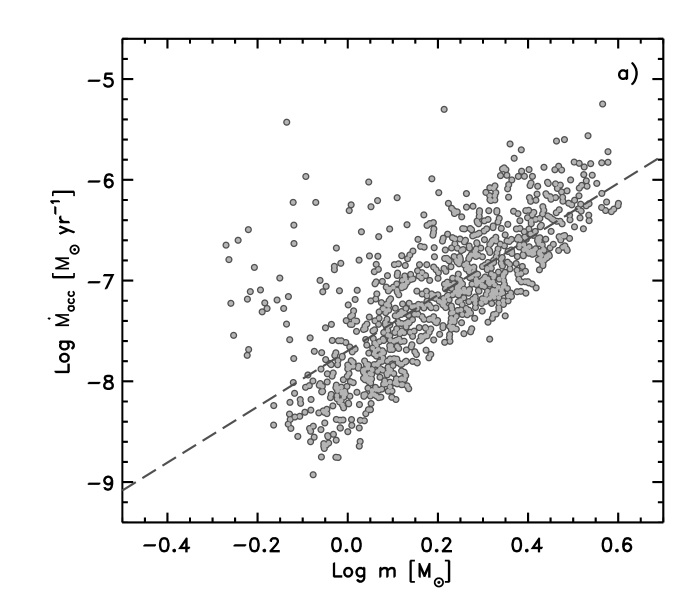
The mass accretion rates measured in 30 Dor, NGC 346, and NGC 602 are not compatible with a mass dependence as steep as those derived from the studies of small nearby Galactic star forming regions cited in Section 6 (e.g. Muzerolle et al. 2003, 2005; Natta et al. 2004, 2006; Calvet et al. 2004). Actually, the indices as steep as or more reported in the literature might be a consequence of having ignored existing age spreads in the population under study, as well as the effect of age on .
We illustrate these effects in Figure 12, where the values measured in 30 Dor are displayed as a function of . We first consider all PMS stars together (Panel a). The formal best fit to the overall distribution would seem to suggest a relatively steep dependence of the type (dashed line) with . Although formally correct, fitting the observed snapshot in Panel a) ignores the fact that the ages of these stars span a range of at least Myr and cannot be considered coeval and the simultaneous dependence on age cannot be ignored.
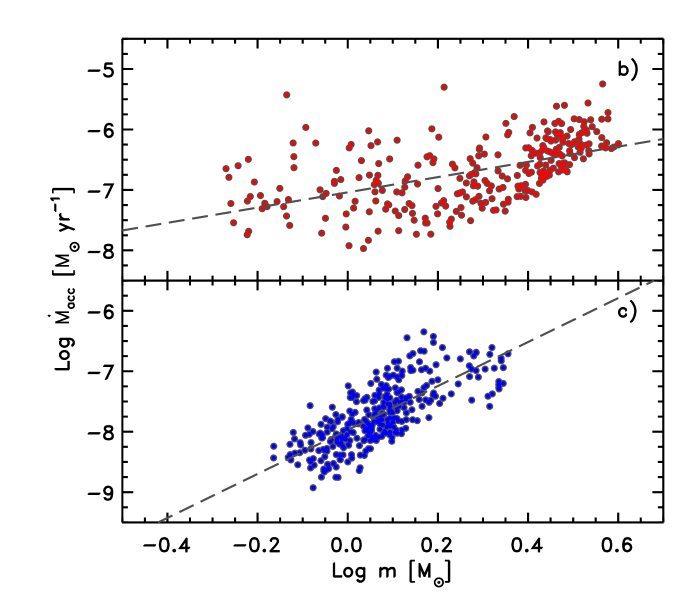
To alleviate this problem one should split the sample into smaller groups of PMS stars of similar age, for instance all stars within a factor of 2 of a given age. An example is shown in Panel b) for stars around 1 Myr, and in this case we find a shallower mass dependence with index (dashed line), in agreement with the result of our multi-variate fit (Section 6). When different age groups are considered in the same way, however, the derived slopes will reflect the effects of evolution. This is what is shown in the example given in Panel c), where we consider PMS stars with ages within a factor of two of 8 Myr. The steeper slope found in this case (, dashed line) is a result of several effects, including the general decrease of with age and the fact that massive PMS objects that have reached the MS no longer accrete. Since these effects have different timescales for objects of different masses, and the dependence of the mass accretion process on mass and age are intertwined, the derived slope does not have general validity.
On the other hand, assuming that all stars in our sample formed under similar conditions and that the functional dependence of the mass accretion rate on mass and age does not in turn depend on the value of these parameters, the multivariate fit discussed in Section 6 guarantees a robust and meaningful result. It is of course possible that, for instance, the way in which scales with is different for different masses. Indeed Figure 10 reveals small variations in the value of the slope between the four mass groups. However, in spite of these possible limitations, the adopted power-law description offers a practical way to explore the parameter space and makes it easier to identify the effects of the environment on the mass accretion process.
References
- (1) Alencar, S., Johns–Krull, C., Basri, G. 2001, AJ, 122, 3335
- (2) Andersen, M., Zinnecker, H., Moneti, A., McCaughrean, M., Brandl, B., Brandner, W., Meylan, G., Hunter, D. 2009, ApJ, 707, 1347
- (3) Ardila, D., Herczeg, G., Gregory, S., et al. 2013, ApJS, 207, 1
- (4) Asplund, M., Grevesse, N., Sauval, A. J., Scott, P. 2009, ARA&A, 47, 481
- (5) Barentsen, G., Vink, J., Drew, J., et al. 2011, MNRAS, 415, 103
- (6) Beccari, G., De Marchi, G., Panagia, N., et al. 2015, A&A, 574, 44
- (7) Beccari, G., Spezzi, L., De Marchi, G., et al. 2010, ApJ, 720, 1108
- (8) Bessell, M., Castelli, F., Plez, B. 1998, A&A, 333, 231
- (9) Brandl, B., Sams, B. J., Bertoldi, F., Eckart, A., Genzel, R., Drapatz, S., Hofmann, R., Loewe, M., Quirrenbach, A. 1996, ApJ, 466, 254
- (10) Bressan, A., et al. 2012, MNRAS, 427, 127
- (11) Caffau, E., Ludwig, H., Bonifacio, P., et al. 2010, A&A, 514, A92
- (12) Caffau, E., Ludwig, H., Steffen, M., Freytag, B., Bonifacio, P. 2011, Solar Phys., 268, 255
- (13) Calvet, N., Hartmann, L., Strom, E. 2000, in “Protostars and Planets”, eds V. Mannings, A. Boss, S. Russell (Tucson: University of Arizona Press), 377
- (14) Calvet, N., Muzerolle, J., Briceño, C., Hernandez, J., Hartmann, L., Saucedo, J. L., Gordon, K. D. 2004, AJ, 128, 1294
- (15) Carlson, L., Sabbi, E., Sirianni, M., et al. 2007, ApJ, 665, L109
- (16) Cignoni, M., Sabbi, E., Nota, A., et al. 2009, AJ, 137, 3668
- (17) Cignoni, M., Sabbi, E., van der Marel, R., et al. 2016, ApJ, 833, 154
- (18) Cusano, F., Ripepi, V., Alcalá, J., et al. 2011, MNRAS, 410, 227
- (19) Dahm, S. 2008, AJ, 136, 521
- (20) Da Rio, N., Robberto, M. 2012, AJ, 144, 176
- (21) de Koter, A., Heap, S., Hubeny, I. 1998, ApJ, 509, 879
- (22) De Marchi, G., Beccari, G, Panagia, N. 2013a, ApJ, 775, 68
- (23) De Marchi, G., Nota, A., Leitherer, C., Ragazzoni, R., Barbieri, C. 1993, ApJ, 419, 658
- (24) De Marchi, G., Panagia, N. 2014, MNRAS, 445, 93
- (25) De Marchi, G., Panagia, N., Girardi, L. 2014, MNRAS, 438, 513
- (26) De Marchi, G., Panagia, N., Guarcello, M.G., Bonito, R. 2013b, MNRAS, 435, 3058
- (27) De Marchi, G., Panagia, N., Romaniello, M. 2010, ApJ, 715, 1
- (28) De Marchi, G., Panagia, N., Romaniello, M., Sabbi, E., Sirianni, M., Prada Moroni, P., Degl’Innocenti, S. 2011a, ApJ, 740, 11
- (29) De Marchi, G., Panagia, N., Sabbi, E. 2011b, ApJ, 740, 10
- (30) De Marchi, G., Panagia, N., Sabbi, E., et al. 2016, MNRAS, 455, 4373
- (31) De Marchi G., Paresce, F., Panagia, N., et al. 2011c, ApJ, 739, 27
- (32) Deustua, S., Mack, J., Bajaj, V., Khandrika, H. 2017, “Instrument Science Report WFC3 2017-14” (Baltimore: STScI)
- (33) Dufour, R. 1984, in “Structure and evolution of the Magellanic Clouds”, IAU Symp. 108, eds. S. van den Bergh, A. de Koter (Dordrecht: Reidel), 353
- (34) Durisen, R., Boss, A., Mayer, L., et al. 2007, in “Protostars and Planets V”, eds B. Reipurth, D. Jewitt, K. Keil, (Tucson: University of Arizona Press), 607
- (35) Elson, R., Gilmore, G., Santiago, B. 1997, MNRAS, 289, 157
- (36) Evans, C., Hainich, R., Oskinova, L., et al. 2012, ApJ, 753, 173
- (37) Fang, M., van Boekel, R., Wang, W., et al. 2009, A&A, 504, 461
- (38) Fedele, D., van den Ancker, M., Henning, T., Jayawardhana, R., Oliveira, J. M. 2010, A&A, 510, A72
- (39) Fernandez, M., Ortiz, E., Eiroa, C., Miranda, L. 1995, A&AS, 114, 439
- (40) Fitzpatrick, E., Savage, B. 1984, ApJ, 279, 578
- (41) Gardner, J., Mather, J., Clampin, M., et al. 2006, SSRv, 123, 485
- (42) Geha, M. et al. 1998, AJ, 115, 1045
- (43) Girardi, L., Groenewegen, M., Weiss, A., Salaris, M. 1998, MNRAS, 301, 149
- (44) Girardi, L., Bertelli, G. 1998, MNRAS, 300, 533
- (45) Gouliermis, D., Schmeja, S., Dolphin, A., et al. 2012, ApJ, 748, 64
- (46) Grebel, E., Chu, Y.-H. 2000, AJ, 119, 787
- (47) Gullbring, E., Hartmann, L., Briceño, C., Calvet, N. 1998, ApJ, 492, 323
- (48) Habing, H. 1997, in “Science with the VLT Interferometer”, ed. F. Paresce (Berlin: Springer), 183
- (49) Hartmann, L., Calvet, P., Gullbring, E., D’Alessio, P. 1998, ApJ, 495, 385
- (50) Hennekemper, E., Gouliermis, D., Henning, T., Brandner, W., Dolphin, A. 2008, ApJ, 672, 914
- (51) Hill, V., Andrievsky, S., Spite, M. 1995, A&A, 293, 347
- (52) Hunter, D., O’Neil, E., Lynds, R., Shaya, E., Groth, E., Holtzman, J. 1996, ApJ, 459, L27
- (53) Hunter, D., Shaya, E., Holtzman, J., Light, R., O’Neil, E., Lynds, R. 1995, ApJ, 448, 179
- (54) Hunter, D., Shaya, E., Scowen, P., Hester, J., Groth, E., Lynds, R., O’Neil, E. 1995b, ApJ, 444, 758
- (55) Hur, H., Sung, H., Bessell, M. 2012, AJ, 143, 41
- (56) Ingleby, L., Calvet, N., Herczeg, G., et al. 2013, ApJ, 767, 112
- (57) Kalari, V., Vink, J. 2015, ApJ, 800, 113
- (58) Königl, A. 1991, ApJ, 370, L39
- (59) Lee, J.-K., Rolleston, W., Dufton, P., Ryans, R. 2005, A&A, 429, 1025
- (60) Leitherer, C., Schaerer, D., Goldader, J., et al. 1999, ApJS, 123, 3
- (61) Lilly, S., Le Fevre, O., Hammer, F., Crampton, D. 1996, ApJ, 460, L1
- (62) Lodders, K. 2010, in “Principles and Perspectives in Cosmochemistry”, ASSP, (Berlin: Springer), 379
- (63) Lortet, M., Testor, G. 1991, A&AS, 89, 185
- (64) Madau, P., Ferguson, H., Dickinson, M., Giavalisco, M., et al. 1996, MNRAS, 283, 1388
- (65) Mann, R., Di Francesco, J., Johnstone, D., et al. 2014, ApJ, 784, 82
- (66) Marigo, P., Girardi, L., Bressan, A., Groenewegen, M., Silva, L., Granato, G. 2008, A&A, 482, 883
- (67) Massey, P., Hunter, D. 1998, ApJ, 493, 180
- (68) Melnick, J. 1987, in “Observational Evidence of Activity in Galaxies”, IAU Symp. 121, Ed. E. Khachikian, K. Fricke, J. Melnick (Dordrecht: Reidel), 545
- (69) Meynet, G., Maeder, A., Schaller, G., Schaerer, D., Charbonnel, C. 1994, A&AS, 103, 97
- (70) Muzerolle, J., Calvet, N., Briceño, C., Hartmann, L., Hillenbrand, L. 2000, ApJ, 535, L47
- (71) Muzerolle, J., Hillenbrand, L., Calvet, N., Briceño, C., Hartmann, L., 2003, ApJ, 592, 266
- (72) Muzerolle, J., Luhman, K., Briceño, C., Hartmann, L., Calvet, N. 2005, ApJ, 625, 906
- (73) Natta, A., Testi, L., Muzerolle, J., Randich, S., et al. 2004, A&A, 424, 603
- (74) Natta, A., Testi, L., Randich, S. 2006, A&A, 452, 245
- (75) Nigra, L., Gallagher, J., Smith, L., et al. 2008, PASP, 120, 972
- (76) Olczak, C., Pfalzner, S., Eckart, A. 2010, A&A, 509, A63
- (77) Oskinova, L., Sun, W., Evans, C., et al. 2013, ApJ, 765, 73
- (78) Panagia, N. 1973, AJ, 78, 929
- (79) Panagia, N. 1999, in “New Views of the Magellanic Clouds”, IAU Symp. 190, eds. Y.-H. Chu, N. Suntzeff, J. Hesser, D. Bohlender (San Francisco: ASP), 549
- (80) Panagia, N., Gilmozzi, R., Macchetto, F., Adorf, H.-M., Kirshner, R. P. 1991, ApJ, 380, L23
- (81) Romaniello, M. 1998, PhD thesis, Scuola Normale Superiore, Pisa, Italy
- (82) Romaniello, M., Panagia, N., Scuderi, S., Kirshner, R. P. 2002, AJ, 123, 915
- (83) Russell, S., Dopita, M. 1990, ApJS, 74, 93
- (84) Sabbi, E., Sirianni, M., Nota, A., et al. 2007, AJ, 133, 44
- (85) Sana, H., Momany, Y., Gieles, M., et al. 2010, A&A, 515, A26
- (86) Schmalzl, M., Gouliermis, D., Dolphin, A., Henning, T. 2008, ApJ, 681, 290
- (87) Selman, F., Melnick, J., Bosch, G., Terlevich, R. 1999, A&A, 347, 532
- (88) Shu, F., Najita, J., Ruden, S., Lizano, S. 1994, ApJ, 429, 797
- (89) Sicilia–Aguilar, A., Hartmann, L., Furesz, G., et al. 2006, AJ, 132, 2135
- (90) Sicilia-Aguilar, A., Henning, T., Hartmann, L. 2010, ApJ, 710, 597
- (91) Sirianni, M., Nota, A., Leitherer, C., De Marchi, G., Clampin, M. 2000, ApJ, 533, 203
- (92) Smartt, S., Lennon, D., Kudritzki, R., et al. 2002, A&A, 391, 979
- (93) Smith, K., Lewis, G., Bonnell, I., Bunclark, P., Emerson, J. 1999, MNRAS, 304, 367
- (94) Spezzi, L., De Marchi, G., Panagia, N., et al. 2012, MNRAS, 421, 78
- (95) Tognelli, E., Prada Moroni, P., Degl’Innocenti, S. 2012, A&A, 533, A109
- (96) Valenti, J., Basri, G., Johns, C. 1993, AJ, 106, 2024
- (97) Vassiliadis, E., Wood, P. 1994, ApJS, 92, 125
- (98) von Braun, K., Chiboucas, K., Minske, J. K., Salgado, J., Worthey, G. 1998, PASP, 110, 810
- (99) Walborn, N. 1986, in “Luminous Stars and Associations in Galaxies”, IAU Symp. 116, Ed. W. de Loore, A. Willis, P. Laskarides (Dordrecht: Reidel), 185
- (100) Walborn, N. 1991, in “The Magellanic Clouds”, IAU Symp. 148, Ed. R. Haynes, D. Milne (Dordrecht: Kluwer), 145
- (101) Walborn, N., Barba, R., Brandner, W., Rubio, M., Grebel, E., Probst, R. 1999, AJ, 117, 225
- (102) Walborn, N., Blades, J. 1997, ApJS, 112, 457
- (103) Westerlund, B., Linde, P., Lyngå, G. 1995, A&A, 298, 39
- (104) Yasui, C., Kobayashi, N., Tokunaga, A., Saito, M., Tokoku, C. 2009, ApJ, 705, 54
- (105) Yasui, C., Kobayashi, N., Tokunaga, A., Saito, M., Tokoku, C. 2010, ApJ, 723, L113
- (106) Yasui, C., Kobayashi, N., Tokunaga, A., Saito, M., Izumi, N. 2016, AJ, 151, 50
- (107) Zeidler, P., Grebel, E., Nota, A., et al. 2016, AJ, 152, 84
- (108) Zinnecker, H., Andersen, M., Brandl, B., Brandner, W., Hunter, D., Larson, R., McCaughrean, M., Meylan, G., Moneti, A. 2002, in “Extragalactic Star Clusters,” IAU Symp. 207, eds. D. Geisler, E. Grebel, D. Minniti (San Francisco: ASP), 531