Interface-controlled creep in metallic glass composites
Abstract
In this work we present molecular dynamics simulations on the creep behavior of metallic glass composites. Surprisingly, all composites exhibit much higher creep rates than the homogeneous glass. The glass–crystal interface can be viewed as a weak interphase, where the activation barrier of shear transformation zones is lower than in the surrounding glass. We observe that the creep behavior of the composites does not only depend on the interface area but also on the orientation of the interface with respect to the loading axis. We propose an explanation in terms of different mean Schmid factors of the interfaces, with the amorphous interface regions acting as preferential slip sites.
keywords:
Metallic glass , Glass matrix composites , Creep , Microstructure , Molecular dynamics simulations1 Introduction
Creep in homogeneous metallic glasses (MGs) [1, 2] can be understood in the framework of shear transformation zones (STZs) [3, 4]. Classically, three different deformation regimes in terms of stress, temperature and strain rate are distinguished [4, 5]: elastic deformation, homogeneous plastic deformation at high temperatures and low stresses, and heterogeneous plastic deformation (shear banding) at low temperatures and high stresses. All plastic deformation is carried by STZs [3, 6, 7, 4], only their localization is different. Moreover, homogeneous deformation at high temperatures can be understood as a creep-like phenomenon [8]. In MGs it usually sets in at about – [4], which for some alloys is not that far above room temperature. Indeed, it was shown that creep-like homogeneous deformation in Cu-Zr MGs occurs even at room temperature and stresses close to yield. This regime is often designated as elastic [9, 10], yet, the extent of this elastic regime is unclear, since a continuum of activation barriers (starting from very low values) was found in glasses [11, 12, 13]. This suggests that the “elastic regime” may be subject to slow, creep-like deformation, making the difference between elastic and homogeneous flow a matter of timescale.
In nanoindentation [6, 14, 15, 16, 17, 18] and compression tests [8] on different glass alloy systems, homogeneous creep deformation has been observed and stress exponents have been measured. However, Li et al. have pointed out the unreliability of the stress exponent extracted from nanoindentation data of MGs [19]. Song et al. performed high temperature compression tests on Au-based MG micro-pillars [20] and comparison of their results with Argon’s model for creep in metallic glasses allowed the extraction of activation energies. These results at least support the view that creep in metallic glasses resembles the homogeneous deformation as postulated by Argon [3, 21]. Molecular dynamics (MD) simulations of a 2D and 3D binary glass support this mechanistic picture of homogeneous deformation [6, 7]. Interestingly, for CuZrNiAl MGs it has been found that high-temperature mechanical creep has a positive effect on their room temperature plasticity [22]: While an annealing treatment at leads to brittleness, creep processing at the same temperature was even able to restore plasticity.
For composites based on amorphous matrices, less data is available. In metallic systems, the focus of recent efforts has been the improvement of ductility in the low-temperature regime, where shear banding is predominant [23, 24, 25, 26, 27, 28, 29, 30, 31, 32]. While these composites are successful at modifying shear band propagation, few investigations on the role of the secondary crystalline phases in the higher temperature, creep-like regime exist. A metallic glass composite of containing nanocrystalline W particles has been synthesized, and found to exhibit an increased viscosity with increasing W content [33]. In polymer science, partially crystalline samples are common and could be referred to as “composites”, but they are mostly discussed in terms of viscoelasticity [34]. The creep of composites based on amorphous matrices has so far only been investigated for ceramic systems: Recently, it has been found that silicon oxide glasses [35, 36, 37] exhibit a high refractoriness with respect to creep which makes them potential candidates for high-temperature applications. Several structure models have been proposed for these polymer derived ceramics – picturing a silica matrix and a secondary phase of excess carbon, either in the form of spherical graphitic nanodomains or a graphene-like network structure [38, 37]. But overall, information on the underlying mechanism of creep in these systems is still sparse. Analogous to crystalline materials, the question arises if mechanical reinforcement against creep is possible by introducing a stronger non-yielding secondary phase, e.g., by combining a glass matrix with a crystalline phase. Furthermore, evidence for effects of the geometry of secondary phases were already found: The heat conductivity in a copper-fiber-reinforced ZrTiCuNiBe bulk metallic glass exhibits a significant anisotropy depending on the orienation of the fibers [39].
Within this context we want to shed light on the question if a non-deformable crystalline secondary phase embedded in a MG can increase the creep resistance of the MG. We are especially interested in the influence of the topology of the secondary phase. To this end, we need to be able to accurately treat the individual constituents of the composites, especially the interface. This goes beyond the possibilities of continuum methods, since it would require prior knowledge of the constitutive laws at the interface. Therefore we resort to atomistic molecular dynamics simulations, which only need a description of interatomic interactions and a structure as an input. As a model material, we choose the binary glass former Cu64Zr36, which is well described by EAM potentials [40]. In order to asses the impact of a secondary phase on the creep behavior, we study various geometries of an embedded crystalline phase. In Cu–Zr glasses, B2 CuZr precipitates can be obtained by annealing procedures and during deformation [41, 42, 43, 44] and are thus chosen as a representative crystalline phase for our model systems. The B2 phase is brittle and dislocation activation is hindered by the high antiphase-boundary energy. In previous simulations [32], this phase was shown to only respond elastically when part of a composite.
Therefore, our systems are a mix of a crystalline phase with high yield stress, that only reacts elastically, combined with an amorphous phase. As stated earlier, such systems were also proposed for ceramics [36], and are therefore relevant models even beyond metallic systems.
2 Computational methods and analysis
We model the metallic glasses as well as the glass–crystal composites with a CuZr B2 phase using the MD code lammps [45] and the eam-potential by Mendelev et al. [40]. The time step for the integration of the equation of motion is in all simulations. Temperature and pressure controls are realized by a Nosé–Hoover thermostat and a Parinello–Rahman barostat. Periodic boundary conditions are applied in all simulations.
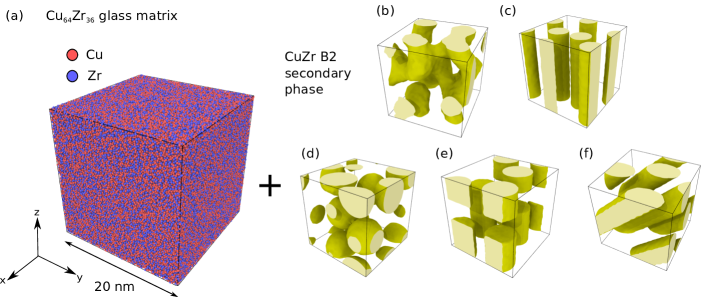
Figure 1 shows a snapshot of the homogeneous metallic glass and the different secondary phase topologies used in this study. The matrix glass, a cubic box of dimension of , is obtained by quenching from the melt with at ambient pressure. This glass is then equilibrated at , again at ambient pressure, for . The composites are created starting from the glass matrix, by cutting out the desired geometry for the secondary phase and filling the empty space with a B2 crystal oriented with the directions along the cartesian axes. The lattice constant for B2 was obtained using a simulation at . After assembly, the composites are relaxed for at and ambient pressure.
We start with an interpenetrating, continuous network, depicted in Fig. 1(b), which serves as a model for percolating crystalline structures embedded in a glass. Such structures resemble those that have been proposed, e.g., for phase-separating oxide glasses [36]. The networks in our simulations were obtained by creating a mask using simulated spinodal decomposition of a binary alloy as described in Ref. [46]. The two components are chosen with volume fractions of and . The system completely decomposes into a network (A) and a matrix phase (B). Then, the network phase starts to coarsen. The network structure is extracted from four different evolution stages of this coarsening process and used as a mask. Thus, the masks have the same volume fraction, , but different surface areas. We use those two parameters to describe the geometry of the secondary phase: The crystalline volume fraction and the specific interface area . We define the latter as the surface area of the free-standing crystalline phase divided by the total volume of the composite:
| (1) |
The surface area is determined using a surface-mesh construction by Delaunay tesselation [47] as implemented in the software ovito [48]. For the networks, we choose four molds at different stages of the spinodal decomposition with specific interface areas , , and .
In order to understand the influence of geometry in more detail, we also employed simpler geometric shapes, such as continuous nanowires in various orientations (Figs. 1(c) and 1(d)), non-percolating nanorods (Fig. 1(e)), and spheres (Fig. 1(f)). These were prepared using the same volume fraction and specific interface areas as the network composites.
For the creep simulation, we choose a temperature of , which corresponds to about . The samples are heated to the target temperature with a heating rate of . Creep tests are performed by instantaneously applying a constant tensile stress in direction for while keeping the other dimensions at ambient pressure. The creep rate is obtained through a linear fit of the creep simulation data between and . Furthermore, a load-cycling test is simulated at by instantly unloading the samples for and subsequently reloading for .
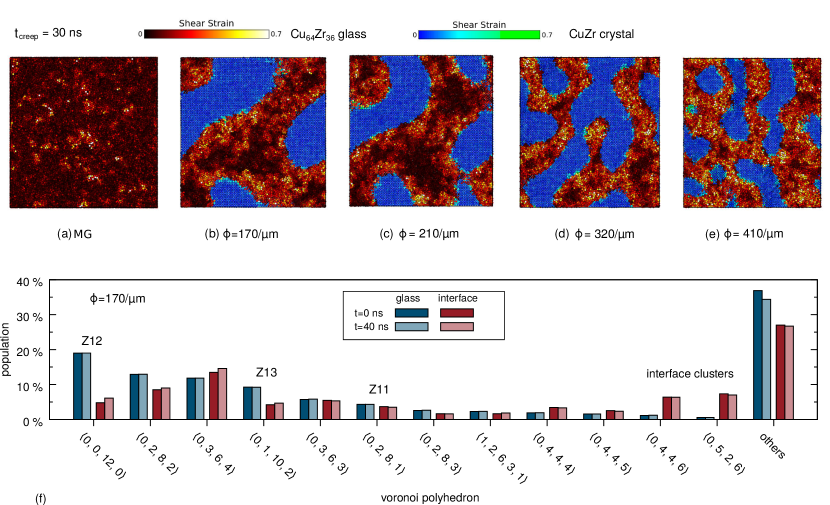
The simulation data is analyzed and visualized with ovito [48] using the atomic shear strain [6, 49] as a measure for the localized deformation. In addition, we analyzed the structure of the glass matrix and glass-crystal interfaces using the Voronoi tessellation method [50, 51, 52, 53] as implemented in ovito [48]. The resulting polyhedra are characterized by the Voronoi index , where denotes the number of -edged faces of the polyhedron. The relative occurrence of these polyhedra characterizes the glass state: In Cu–Zr, the fraction of copper-centered icosahedra with index was found to be a reliable indicator for relaxation and strength of the glass [54, 55].
3 Plastic deformation of glass–crystal composites
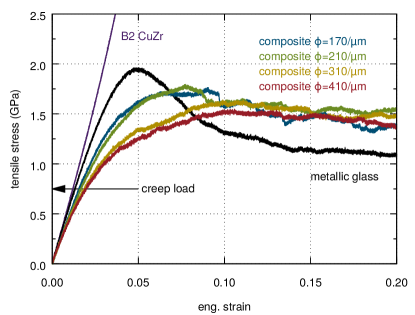
As a first step, we perform tensile tests on the different samples to ascertain that we choose a stress regime below yield for the creep tests. Figure 2 shows the stress-strain curves obtained by tensile tests of glass, single-crystalline B2 CuZr, and the composites with a network structure [cf. Fig. 1(b)]. We perform strain-rate-controlled tensile tests at with a constant engineering strain rate of . The tensile direction coincides with the -orientation of the single-crystal. It can be seen that the Young’s moduli of the glass and crystal are very similar, but the yield-stress of the glass is far exceeded by the crystal’s. Furthermore, it is evident that the four composites exhibit lower elastic moduli than their pure constituents, even though they all contain the same volume fraction of crystalline network phase, . This suggests that the specific interface area plays a strong role in the mechanical properties. The higher the specific interface area , the lower is the composite’s mean elastic modulus. On the other hand, the composites have a higher flow stress and do not show the stress overshoot typical for a glass. Such a “flattening” of the stress response has also been observed in other glasses with a microstructure containing weakened interfaces, such as nanoglasses [31, 56]. From these results we can conclude that is an appropriate stress level for creep testing at , since it is below the individual yield stresses of both the composite structures and the homogeneous glass, but high enough to observe creep on MD timescales. The crystalline phase is still in the linear elastic regime up to strains of at least .
4 Creep simulations
4.1 Homogeneous glass and interpenetrating network secondary phase
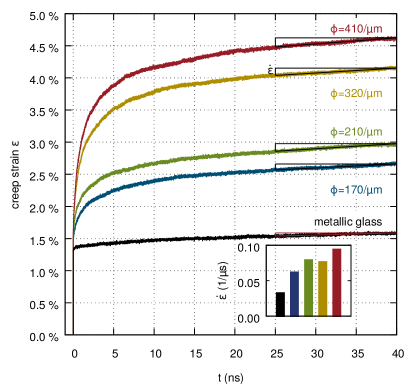
Figure 3 shows the creep curves of four network composites with topologies as depicted in Fig. 1(b), with the parameters established above. Additionally, we show the creep curve of the homogeneous glass. At the simulation times available, we were never able to observe failure. The creep curve rather suggests a mixed regime of creep stages I and II. Therefore, we simply extract the creep rate in all cases from the slope in the time range between and to obtain comparable data. The creep strain depicted in the following figures is always the true strain, , where is the box length in direction. In this way, we ensure that the fitted creep rates are independent of the initial box length in loading direction.
Starting with the homogeneous glass, we find that it exhibits a comparatively slow creep rate: After an instant increase of elastic strain, the strain increases by less than after . The creep behavior of metallic glasses is well described by Argon [3, 21]. Assuming high temperatures and unpercolating STZs, the Argon model describes how the strain rate depends on stress and temperature in glasses:
| (2) |
Here, is the activation energy for plastic deformation, is the volume of an STZ, the characteristic shear strain of an STZ, its attempt frequency to flow and a prefactor close to unity [57]. The local von Mises strain after of creep deformation is shown in Figure 5(a). The deformation is localized in clusters of a few atoms distributed homogeneously within the glass, which is consistant with the STZ picture. This suggests that, at high temperatures and low stresses, the mechanism behind the deformation remains the same as for shear band formation, i.e., nucleation of STZs. This is also corroborated by findings from Kassner et al. [58], who summarized the activation energies for creep of several metallic glasses. The values they found agree well with the activation energy of an STZ estimated by Schuh et al. [4], i.e., –. For a glass, with a composition close to the one used in this work, Argon and Kuo [57] measured an activation energy of about .
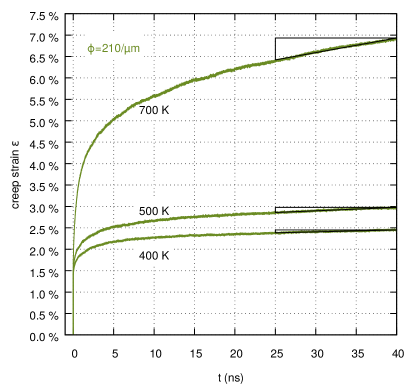
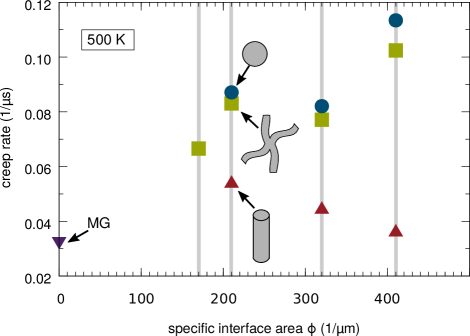
Moving on to the composites, we observe that the creep behavior’s temperature dependence also resembles the behavior described by Argon, cf. Fig. 4. Surprisingly, Fig. 3 reveals that the composites exhibit much higher creep rates than the homogeneous glass at the same temperature. Furthermore, we note that the larger the specific interface area , the higher is the total true creep strain after , which is also reflected in the inset to Fig. 3, which shows that the creep rate increases with . For these glass–crystal composites, composed of viscous glass phase and a stronger crystalline phase that cannot exhibit dislocation activity under the present testing conditions, we would have expected a decrease in the creep rate. The observed increase seems counter-intuitive, considering the mix of a time-dependent deforming phase with a significant volume fraction of non-deformable phase. In fact, we showed above that at the creep strain levels obtained here in the composites, the crystalline phase only deforms elastically. Thus the creep behavior of the composite must be governed by the glass phase.
How is it possible that introducing the network phase, makes the glass more prone to creep? A first explanation can be found in the elastic moduli of the glass and crystal. While they do not differ much, the composites are less stiff than the homogeneous glass (see Fig. 2). Thus, we can infer that the composite interfaces must be weaker than the surrounding matrix. To understand the influence of the interface, we need to study the creep deformation in the glass and crystal phase at the atomic level. Figures 5(a)-(e) shows snapshots of the atomic strain in the homogeneous glass and composite structures. The color coding indicates the amount of atomic strain experienced by the atoms. We use two different color maps for the atoms that initially belonged to the glass matrix or the B2 crystal. The results of this strain analysis support the hypothesis that the crystalline phase only deforms elastically since we could not observe any dislocation activity. Furthermore, Figs. 5(b)-(e) reveal that the deformation is mostly localized in the interface. For very high specific interface areas (), almost the complete glass matrix can be considered as an interface region because of the small distance between the two interfaces. The pure glass, however, exhibits a homogeneous distribution of STZs without the formation of shear bands, which resembles the non-interface glass regions in the composites. This suggests that the glass–crystal interface can be viewed as a weak interface interphase, where the effective activation barrier for creep is lower than in the surrounding glass. Therefore, STZs are more easily activated in the interface than in the bulk glass. Thus, a closer look at the interface is warranted: We performed a Voronoi analysis of the atoms in the interface and glass phase. The interface is defined such that it includes glass atoms at the direct glass-crystal interface and their neighbors in the glass phase within a cutoff of Å. Figure 5(f) exemplarily shows the Voronoi statistics of the Cu atoms in the glass and interface phase of the sample with network microstructure , both before and after 40ns of tensile creep testing. Prior to the Voronoi tesselation, an energy minimization using molecular statics has been performed. Here, only polyhedra that either occur more often than in the glass phase or interface phase are shown, the remaining polyhedra are summarized under the category “others”. When comparing the most prominent Cu centered polyhedra in the interface and glass phases, it is evident that the geometrically favorable motifs, also called Z-clusters [59], are abundant in the glass. This is especially visible for the copper-centered icosahedra (Z12), and their defective version . Their fraction is significantly reduced in the interface, where more geometrically unfavored motifs (GUMs) [60], such as the polyhedron, can be found. Additionally, 13-fold and 14-fold clusters appear at the immediate glass-crystal interface. The zirconium-centered polyhedra exhibit similar trends and are omitted here. In total, these results indicate a weakened glass structure in the interface. This is also supported by the lower number density of the interface of as compared to in the glass matrix. Thus there, is excess volume in the interface. Additionally, Fig. 5(f) shows that the Voronoi statistics of the glass do not change during creep. In the interface, there is a slight increase in occurence of Z12 and Z13 clusters after creep testing. Moreover, in a common neighbor analysis, we could observe a minor increase of in the fraction of bcc atoms in the overall composite. These last two observations indicate a marginal stress-assisted relaxation of the interface. Nonetheless, the effect is negligible.
When comparing the composites in Figs. 5(b)-(e), it can be seen that the higher , the higher is the amount of glass atoms with a high atomic strain. This matches the observation of increasing creep rates with increasing . The more STZ sites can be activated, the higher is the resulting creep rate. Nanoscale microstructures in Cu-Zr-based MGs have been reported in literature [28, 61, 30, 62], with secondary phase particle diameters between and . This corresponds to our spherical inclusions, which have a diameter of . In few studies with spherical precipitates, both the phase fraction and average diameter of the secondary phase are given [61, 32], which allows direct comparison of the specific interface area with our models. In Ref. [61], which is closest to our geometry, the average diameter of these particles is around with volume fractions between to . This yields values of between to . Since we use slightly higher volume fractions, we simulate higher specific interface areas, but they only differ by a factor of 4 to 10 from the experimental ones. Hence, we expect that the effect of increasing creep rate with increasing interface is experimentally observable.
4.2 Influence of interface geometry
We showed above that the interface promotes creep and that the specific interface area is directly related to the creep rate. If we assume a simple, three-phase composite model of glass, crystal, and interface, this would suggest that is the only parameter for creep. We tested this by generating simpler geometric shapes with similar parameters and to the network structures, where is always . Considering that the network composites have a complex interphase topology with a variety of surface orientations, we at first construct two simpler geometries: A non-percolating crystalline phase in the form of spherical particles and a percolating phase made of nanowires aligned with the loading direction, (see Figs. 1(c) and 1(f)). These samples are then subjected to the same load of at for . Their creep rates are shown in Fig. 6. If were the only parameter influencing the creep rates of our composites, the latter should remain unchanged when the shape of the crystalline phase is varied for constant and . However, from Fig. 6 we see that this is not the case. Although all composite structures exhibit higher creep rates than the pristine glass, different secondary phase shapes lead to different creep rates for the same and . The following trend can be identified for the network and sphere-containing composites: The higher the specific interface area, the higher is the creep rate. However, the opposite trend is visible for the nanowire composites. Thus, a simple model which only takes into account the relative fraction of the different phases is insufficient. Even the percolation cannot explain the different rates, as the non-percolating case (spheres) and the percolating network structures behave similarly. The remaining difference between the three cases is therefore the interface orientation.
Thus, in the next step we studied the creep rate dependence on the interface geometry for constant and . We also compared composites with percolating and non-percolating secondary phases: In addition to the secondary phase network, nanowires aligned with the loading direction and spherical particles, see Figs. 1(b), 1(c) and 1(f), we introduce non percolating nanorods as in Fig. 1(e) and percolating nanowires, that are tilted , see Fig. 1(d), and to the -axis.
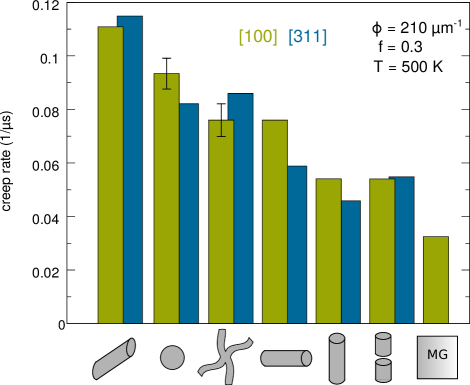
In Fig. 7, all these composites with different specific interface area are ordered with respect to their creep rates. The reference creep rate of the glass structure is shown on the right. The green bars are creep rates fitted from composites where the CuZr B2 crystal orientation is . The highest creep rate is shown by the composite containing nanowires oriented with respect to the loading direction. This is followed by the sphere and network composite, that have a similar creep rate. After that, the creep rate decreases for the wire that lies perpendicular to the loading direction. Furthermore, the lowest composite creep-rate is shown by the wires oriented along the loading direction. Interestingly, they are not significantly changed when the wires are non-continuous. The error bars for spheres represent the standard deviation of four different spatial distributions of the spheres, while the error bars for the networks were determined by loading the structure in the three cartesian directions. We note that the size of the error bars is comparable to the difference in rates between the nanowires in Fig. 6. The reduction of rate with interface area does therefore not exceed the margin of error. The fluctuations in the creep rate can be explained by the fact that the glass is heterogeneous on length scales of nanometers [59] and is therefore sensitive to the location of the crystalline phase. Nevertheless, the hierarchy presented in Fig. 7 exceeds the margin of error.
As the interface controls the mechanical behavior, the results of our simulations may be influenced by the orientation of the crystals. Hence, we repeated the simulations with B2 crystalline phases oriented with the direction along the –axis. The results are also shown in Fig. 7 and do not significantly deviate from the results with a orientation. Indeed, it was found earlier that the interface energy of copper crystals in is only weakly dependent on the crystal orientation [63], which is in line with the current results.
5 Interface Schmid factor model
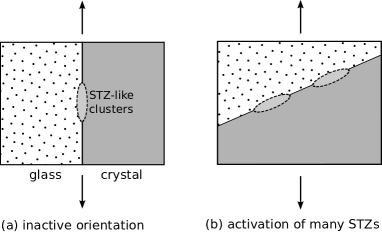
The alignment of the glass–crystal interfaces is therefore the main factor controlling the creep rate, while percolation only seems to play a minor role. For the nanowires oriented in loading direction, the interface normal is always perpendicular to the loading direction, see Fig. 8a. The orientation however, seems to be favorable for creep deformation (Fig. 8b).
Based on the idea of the Schmid factor in a crystal, which translates the applied stress into a resolved shear stress on the different slip planes and glide directions in a crystal, we define a Schmid-like factor for our composites. In a crystalline material, it is
| (3) | |||||
| (4) |
In our case, the amorphous interface regions act as preferential slip sites, so we use the concept of the Schmid-factor in a similar geometric derivation.
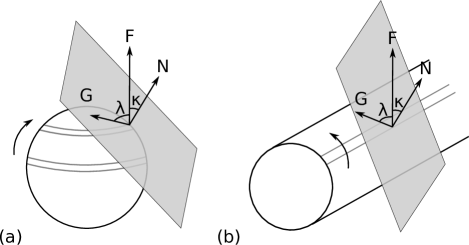
However, we assume that in the glassy interphase there are no restrictions to the glide direction on the slip plane. The glide direction is thus the direction that maximizes , which corresponds to the projection of the externally applied force on the slip plane (represented by its normal vector ). Using the definition of from the classical Schmid law, we arrive at
| (5) | |||||
| (6) | |||||
| (7) |
In Fig. 9 two example interface geometries are sketched.
We expect that different secondary phase topologies have different distributions of these local Schmid factors. In order to characterize these topologies, we use a total mean Schmid factor
| (8) |
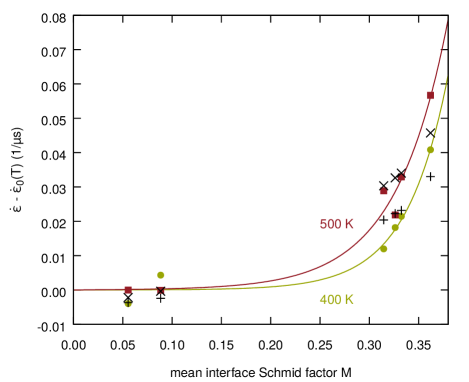
(Note that depends on the normal vector of the specific differential area for which it is calculated and cannot be moved out of the integral.) We choose six different composite structures with and for comparison. The integration over the interfaces is performed numerically: The software ovito is used to create a surface mesh of the interface region by Delaunay triangulation [47]. For each of these triangles, we can calculate the surface area and the surface normal and thus . Figure 10 shows the resulting total interface Schmid factors on the abscissa, while the ordinate shows the corresponding creep rates for the samples with . The data points show that—at constant temperature—the composite structures with higher total interface Schmid factors exhibit higher creep rates. Note that since the mean interface Schmid factor has been determined numerically, even for the nano-rods and nanowire-type inclusions, is not equal to zero. This can be attributed to the fact that there are surface triangles with surface normals non-perpendicular to the loading direction at the edges.
The lines in Fig. 10 result from a fit of the Argon model [Eq. (2)] using . This is obviously only a very rough trend, since the resolved stress varies for each surface triangle, each of which therefore contributes differently to the total creep. As such, we employed a model using local resolved stresses to obtain quantitative results:
| (9) |
In this formulation, the shear stress is replaced by the local resolved shear stress , calculated for each surface triangle . This modified term is then averaged. This part of the equation represents the behavior of the interface phase. The term includes the contributions of the glass phase, while the crystalline phase only responds elastically and is therefore not included in the formula. Fitting parameters are the prefactor , the activation barrier , the STZ activation volume , and . The results of the fit, including simulations at two different temperatures, are plotted using crosses in Fig. 10 and agree well with the data. Table 1 lists the results of the temperature independent fit parameters.
As we can see, the activation barrier in the interphase is severely reduced compared to values found in literature for the homogeneous glass [4, 57]. However, we observe that the noise in the creep curves is quite large compared to the creep rates that we try to fit. A detailed treatment of this problem can be found in the appendix. The bottom line is that we cannot draw a quantitative conclusion concerning the activation energy and the prefactors. Nonetheless, this model shows that the interphase can be described as a weaker glass, where STZs are more easily activated. As such, it is more susceptible to a creep-like deformation behavior, even at lower temperatures. The orientation dependence hints towards anisotropic creep behavior of composites.
| parameter | (GHz) | (eV) | |
|---|---|---|---|
| fit |
6 Elastic and plastic creep deformation
So far, we only quantified the composites’ creep behavior in terms of creep rates. In addition to the creep rates fitted from steady state behavior, it is important to understand what happens at the onset of creep. Usually, the individual elastic and plastic contributions of the creep deformation overlap and are difficult to distinguish in the creep curve. The remaining plastic deformation can, however, easily be identified from the deformation that remains after unloading. Therefore, we revisit the creep simulations of the nanowire composites with , and . After , the wire composites are unloaded and relaxed for . The corresponding data are depicted in Fig. 11.
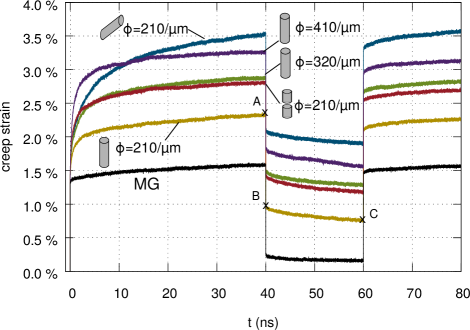
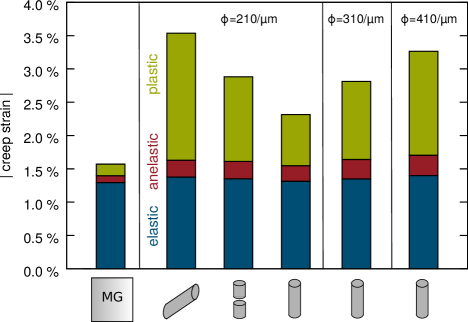
The difference in strain between points A and C marked in Fig. 11 shows the composites’ reversible part of the creep deformation. While AB is the elastic strain instantly recovered when the load is removed, BC shows an anelastic part that can be recovered over time. What is striking is that for all composites a significant part of the deformation is reversible; the homogeneous glass exhibits a lower anelastic strain. For the crystal, we would expect that once the load is removed it contracts to its initial length. In the composite, however, this is hindered by the glass-phase. We conclude that this remaining back stress together with a possible higher anelasticity of the interface leads to a significant time-dependent strain recovery. We note that the anelastic recovery is not completed after , but that the anelastic recovery after is very similar for all composites, see Fig. 12. The same is true for the elastic part, which is also comparable to the homogeneous glass. The plastic deformation that remains after removing the load and subsequent relaxation for , though, shows a significant dependence on the shape of the crystalline phase. This is in agreement with the results of the previous sections, which are now shown to be clearly plastic in nature, as the anelastic and elastic contributions do not differ significantly between the samples. This is to be expected, since the STZs (which are sensitive to the factor ) are plastic events.
7 Conclusion
In our simulations of the creep behavior of -glass and B2-crystal composites, we could observe a mixed regime of elastic, anelastic and plastic deformation. When comparing the creep behavior of the homogeneous glass to glass–crystal composites, where the crystalline phase only responds elastically, it could be shown that the composites have much higher creep rates than the homogeneous glass. Clearly, creep is promoted by the presence of interfaces. In our model system the interface presents a weak spot in comparison to the surrounding MG. Furthermore, by keeping the volume fraction constant but varying the shape of the secondary phase, we could analyze the influence of the specific interface area and the percolation of the secondary phase. We found that the creep rates of the composites strongly depend on the orientation of the glass–crystal interface. We have given an explanation in terms of the resolved shear stress derived from the concept of the Schmid factor in crystalline materials. This dependence of the creep rate on the anisotropy of the secondary phase should be taken into account when designing creep resistant MG composites.
Acknowledgments
The authors gratefully acknowledge the financial support of the Deutsche Forschungsgemeinschaft (DFG)through project grants STU 611/1-1 and RO 4542/2-1. Computing time was provided by Technische Universität Darmstadt on the Lichtenberg High Performance Computer.
Appendix Appendix A Quantitative reliability of fits to
simulation data
The activation barrier can only be determined by including data obtained using different temperatures and crystalline phase geometries, characterized by . If we remove the temperature dependent offset term in the composites’ creep rates, we note that the data points at the two temperatures are very close together, see Fig. 13. The scatter is on the order of the difference between the two data sets. Thus, the activation energy and the prefactors of the interface phase can only be determined approximately and cannot be interpreted as quantitatively reliable.
References
- [1] A. Inoue, Stabilization of metallic supercooled liquid and bulk amorphous alloys, Acta Mater. 48 (1) (2000) 279–306. doi:10.1016/S1359-6454(99)00300-6.
- [2] W. H. Wang, C. Dong, C. H. Shek, Bulk metallic glasses, Mater. Sci. Eng. R 44 (2–3) (2004) 45–89. doi:10.1016/j.mser.2004.03.001.
- [3] A. S. Argon, Plastic deformation in metallic glasses, Acta Metall. 27 (1) (1979) 47–58. doi:10.1016/0001-6160(79)90055-5.
- [4] C. A. Schuh, T. C. Hufnagel, U. Ramamurty, Overview No.144 - Mechanical behavior of amorphous alloys, Acta Mater. 55 (12) (2007) 4067–4109. doi:10.1016/j.actamat.2007.01.052.
- [5] T. C. Hufnagel, C. A. Schuh, M. L. Falk, Deformation of metallic glasses: Recent developments in theory, simulations, and experiments, Acta Mater. 109 (2016) 375–393. doi:10.1016/j.actamat.2016.01.049.
- [6] M. L. Falk, J. S. Langer, Dynamics of viscoplastic deformation in amorphous solids, Phys. Rev. E 57 (1998) 7192. doi:10.1103/physreve.57.7192.
- [7] F. Albano, M. L. Falk, Shear softening and structure in a simulated three-dimensional binary glass, J. Chem. Phys. 122 (15). doi:10.1063/1.1885000.
- [8] M. Heggen, F. Spaepen, M. Feuerbacher, Creation and annihilation of free volume during homogeneous flow of a metallic glass, J. Appl. Phys. 97 (3). doi:10.1063/1.1827344.
- [9] K.-W. Park, C.-M. Lee, M. Wakeda, Y. Shibutani, M. L. Falk, J.-C. Lee, Elastostatically induced structural disordering in amorphous alloys, Acta Mater. 56 (19) (2008) 5440–5450. doi:10.1016/j.actamat.2008.07.033.
- [10] S.-J. Lee, B.-G. Yoo, J.-I. Jang, J.-C. Lee, Irreversible structural change induced by elastostatic stress imposed on an amorphous alloy and its influence on the mechanical properties, Met. Mater. Int. 14 (1) (2008) 9–13. doi:10.3365/met.mat.2008.02.009.
- [11] D. Rodney, C. A. Schuh, Yield stress in metallic glasses: The jamming-unjamming transition studied through Monte Carlo simulations based on the activation-relaxation technique, Phys. Rev. B 80 (18). doi:10.1103/PhysRevB.80.184203.
- [12] P. M. Derlet, R. Maass, Thermal-activation model for freezing and the elastic robustness of bulk metallic glasses, Phys. Rev. B 84 (22). doi:10.1103/PhysRevB.84.220201.
- [13] S. Swayamjyoti, J. F. Loeffler, P. M. Derlet, Local structural excitations in model glass systems under applied load, Phys. Rev. B 93 (14). doi:10.1103/PhysRevB.93.144202.
- [14] B.-G. Yoo, K.-S. Kim, J.-H. Oh, U. Ramamurty, J. Jang, Room temperature creep in amorphous alloys: Influence of initial strain and free volume, Scr. Mater. 63 (12) (2010) 1205–1208. doi:10.1016/j.scriptamat.2010.08.034.
- [15] B.-G. Yoo, J.-H. Oh, Y.-J. Kim, K.-W. Park, J.-C. Lee, J. Jang, Nanoindentation analysis of time-dependent deformation in as-cast and annealed Cu-Zr bulk metallic glass, Intermetallics 18 (10, SI) (2010) 1898–1901. doi:10.1016/j.intermet.2010.02.032.
- [16] W. H. Li, K. Shin, C. G. Lee, B. C. Wei, T. H. Zhang, Y. Z. He, The characterization of creep and time-dependent properties of bulk metallic glasses using nanoindentation, Mater. Sci. Eng., A 478 (1-2) (2008) 371–375. doi:10.1016/j.msea.2007.06.015.
- [17] A. Castellero, B. Moser, D. I. Uhlenhaut, F. H. Dalla Torre, J. F. Loeffler, Room-temperature creep and structural relaxation of Mg-Cu-Y metallic glasses, Acta Mater. 56 (15) (2008) 3777–3785. doi:10.1016/j.actamat.2008.04.021.
- [18] Y. J. Huang, J. Shen, Y. L. Chiu, J. J. J. Chen, J. F. Sun, Indentation creep of an Fe-based bulk metallic glass, Intermetallics 17 (4) (2009) 190–194. doi:10.1016/j.intermet.2008.09.014.
- [19] F. Li, Y. Xie, M. Song, S. Ni, S. Guo, X. Liao, A detailed appraisal of the stress exponent used for characterizing creep behavior in metallic glasses, Mater. Sci. Eng., A 654 (2016) 53–59. doi:10.1016/j.msea.2015.12.025.
- [20] S. X. Song, Y. H. Lai, J. C. Huang, T. G. Nieh, Homogeneous deformation of Au-based metallic glass micropillars in compression at elevated temperatures, Appl. Phys. Lett. 94 (6). doi:10.1063/1.3081111.
- [21] A. S. Argon, L. T. Shi, Development of visco-plastic deformation in metallic glasses, Acta Metall. 31 (4) (1983) 499–507. doi:10.1016/0001-6160(83)90038-x.
- [22] Y. Tong, W. Dmowski, Y. Yokoyama, G. Wang, P. K. Liaw, T. Egami, Recovering compressive plasticity of bulk metallic glasses by high-temperature creep, Scr. Mater. 69 (8) (2013) 570–573. doi:10.1016/j.scriptamat.2013.06.020.
- [23] C. C. Hays, C. P. Kim, W. L. Johnson, Microstructure controlled shear band pattern formation and enhanced plasticity of bulk metallic glasses containing in situ formed ductile phase dendrite dispersions, Phys. Rev. Lett. 84 (13) (2000) 2901–2904. doi:10.1103/PhysRevLett.84.2901.
- [24] C. C. Hays, C. P. Kim, W. L. Johnson, Improved mechanical behavior of bulk metallic glasses containing in situ formed ductile phase dendrite dispersions, Mater. Sci. Eng., A 304–306 (2001) 650–655. doi:10.1016/S0921-5093(00)01557-4.
- [25] M. L. Lee, Y. Li, C. A. Schuh, Effect of a controlled volume fraction of dendritic phases on tensile and compressive ductility in la-based metallic glass matrix composites, Acta Mater. 52 (14) (2004) 4121–4131. doi:10.1016/j.actamat.2004.05.025.
- [26] S.-W. Lee, M.-Y. Huh, E. Fleury, J.-C. Lee, Crystallization-induced plasticity of Cu–Zr containing bulk amorphous alloys, Acta Mater. 54 (2) (2006) 349–355. doi:10.1016/j.actamat.2005.09.007.
- [27] J. Eckert, J. Das, S. Pauly, C. Duhamel, Mechanical properties of bulk metallic glasses and composites, J. Mater. Res. 22 (2) (2007) 285–301. doi:10.1557/JMR.2007.0050.
- [28] K. Hajlaoui, A. R. Yavari, A. LeMoulec, W. J. Botta, F. G. Vaughan, J. Das, A. L. Greer, Å. Kvick, Plasticity induced by nanoparticle dispersions in bulk metallic glasses, J. Non-Cryst. Solids 353 (3) (2007) 327–331. doi:10.1016/j.jnoncrysol.2006.10.011.
- [29] X. L. Fu, Y. Li, C. A. Schuh, Mechanical properties of metallic glass matrix composites: Effects of reinforcement character and connectivity, Scr. Mater. 56 (7) (2007) 617–620. doi:10.1016/j.scriptamat.2006.12.010.
- [30] S. Pauly, S. Gorantla, G. Wang, U. Kuehn, J. Eckert, Transformation-mediated ductility in CuZr-based bulk metallic glasses, Nat. Mater. 9 (6) (2010) 473–477. doi:10.1038/NMAT2767.
- [31] K. Albe, Y. Ritter, D. Şopu, Enhancing the plasticity of metallic glasses: Shear band formation, nanocomposites and nanoglasses investigated by molecular dynamics simulations, Mech. Mater. 67 (2013) 94–103. doi:10.1016/j.mechmat.2013.06.004.
- [32] T. Brink, M. Peterlechner, H. Rösner, K. Albe, G. Wilde, Influence of crystalline nanoprecipitates on shear-band propagation in Cu-Zr-based metallic glasses, Phys. Rev. Applied 5 (2016) 054005. doi:10.1103/PhysRevApplied.5.054005.
- [33] J. Eckert, A. Kübler, L. Schultz, Mechanically alloyed Zr55Al10Cu30Ni5 metallic glass composites containing nanocrystalline W particles, Journal of Applied Physics 85 (10) (1999) 7112–7119. doi:10.1063/1.370519.
- [34] J. M. Hutchinson, Physical aging of polymers, Prog. Polym. Sci. 20 (4) (1995) 703–760. doi:10.1016/0079-6700(94)00001-I.
- [35] T. Rouxel, G.-D. Soraru, J. Vicens, Creep viscosity and stress relaxation of gel-derived silicon oxycarbide glasses, J. Am. Ceram. Soc. 84 (5) (2001) 1052–1058. doi:10.1111/j.1151-2916.2001.tb00789.x.
- [36] B. Papendorf, E. Ionescu, H.-J. Kleebe, C. Linck, O. Guillon, K. Nonnenmacher, R. Riedel, High-temperature creep behavior of dense SiOC-based ceramic nanocomposites: Microstructural and phase composition effects, J. Am. Ceram. Soc. 96 (1) (2012) 272–280. doi:10.1111/jace.12067.
- [37] E. Ionescu, C. Balan, H.-J. Kleebe, M. M. Mueller, O. Guillon, D. Schliephake, M. Heilmaier, R. Riedel, High-Temperature Creep Behavior of SiOC Glass-Ceramics: Influence of Network Carbon Versus Segregated Carbon, J. Am. Ceram. Soc. 97 (12) (2014) 3935–3942. doi:10.1111/jace.13206.
- [38] A. Saha, R. Raj, D. Williamson, A model for the nanodomains in polymer-derived SiCO, J. Am. Ceram. Soc. 89 (7) (2006) 2188–2195. doi:10.1038/srep42705.
- [39] P. Wadhwa, J. Heinrich, R. Busch, Processing of copper fiber-reinforced Zr41.2Ti13.8Cu12.5Ni10.0Be22.5 bulk metallic glass composites, Scripta Materialia 56 (1) (2007) 73 – 76. doi:10.1016/j.scriptamat.2006.08.053.
- [40] M. I. Mendelev, M. J. Kramer, R. T. Ott, D. J. Sordelet, D. Yagodin, P. Popel, Development of suitable interatomic potentials for simulation of liquid and amorphous Cu-Zr alloys, Philos. Mag. 89 (11) (2009) 967–987. doi:10.1080/14786430902832773.
- [41] F. Jiang, Z. B. Zhang, L. He, J. Sun, H. Zhang, Z. F. Zhang, The effect of primary crystallizing phases on mechanical properties of Cu46Zr47Al7 bulk metallic glass composites, J. Mater. Res. 21 (2006) 2638–2645. doi:10.1557/jmr.2006.0315.
- [42] F. Jiang, D. H. Zhang, L. C. Zhang, Z. B. Zhang, L. He, J. Sun, Z. F. Zhang, Microstructure evolution and mechanical properties of Cu46Zr47Al7 bulk metallic glass composite containing CuZr crystallizing phases, Mater. Sci. Eng. A 467 (2007) 139–145. doi:10.1016/j.msea.2007.02.093.
- [43] S. Pauly, J. Das, C. Duhamel, J. Eckert, Martensite formation in a ductile bulk metallic glass composite, Adv. Eng. Mater. 9 (2007) 487–491. doi:10.1002/adem.200700044.
- [44] S. Pauly, J. Das, J. Bednarcik, N. Mattern, K. B. Kim, D. H. Kim, J. Eckert, Deformation-induced martensitic transformation in Cu–Zr–(Al,Ti) bulk metallic glass composites, Scr. Mater. 60 (2009) 431–434. doi:10.1016/j.scriptamat.2008.11.015.
- [45] S. Plimpton, Fast parallel algorithms for short-range molecular dynamics, J. Comp. Phys. 117 (1995) 1–19. doi:10.2172/10176421.
- [46] B.-N. D. Ngô, A. Stukowski, N. Mameka, J. Markmann, K. Albe, J. Weissmüller, Anomalous compliance and early yielding of nanoporous gold, Acta Mater. 93 (2015) 144 – 155. doi:10.1016/j.actamat.2015.04.021.
- [47] A. Stukowski, Computational analysis methods in atomistic modeling of crystals, The Journal of The Minerals, Metals & Materials Society (TMS) 66 (3) (2014) 399–407. doi:10.1007/s11837-013-0827-5.
- [48] A. Stukowski, Visualization and analysis of atomistic simulation data with OVITO–the open visualization tool, Modelling and Simulation in Materials Science and Engineering 18 (1) (2010) 015012. doi:10.1088/0965-0393/18/1/015012.
- [49] S. O. F. Shimizu, J. Li, Theory of shear banding in metallic glasses and molecular dynamics calculations, Mater. Trans. 48 (11) (2007) 2923–2927. doi:10.2320/matertrans.mj200769.
- [50] G. Voronoï, Nouvelles applications des paramètres continus à la théorie des formes quadratiques., J. Reine Angew. Math. 133 (1908) 97–102. doi:10.1515/crll.1908.133.97.
- [51] G. Voronoï, Nouvelles applications des paramètres continus à la théorie des formes quadratiques., J. Reine Angew. Math. 134 (1908) 198–287. doi:10.1515/crll.1908.134.198.
- [52] G. Voronoï, Nouvelles applications des paramètres continus à la théorie des formes quadratiques., J. Reine Angew. Math. 136 (1909) 67–182. doi:10.1515/crll.1909.136.67.
- [53] W. Brostow, M. Chybicki, R. Laskowski, J. Rybicki, Voronoi polyhedra and Delaunay simplexes in the structural analysis of molecular-dynamics-simulated materials, Phys. Rev. B 57 (1998) 13448–13458. doi:10.1103/PhysRevB.57.13448.
- [54] J.-C. Lee, K.-W. Park, K.-H. Kim, E. Fleury, B.-J. Lee, M. Wakeda, Y. Shibutani, Origin of the plasticity in bulk amorphous alloys, J. Mater. Res. 22 (2007) 3087–3097. doi:10.1557/JMR.2007.0382.
- [55] Y. Q. Cheng, A. J. Cao, H. W. Sheng, E. Ma, Local order influences initiation of plastic flow in metallic glass: Effects of alloy composition and sample cooling history, Acta Materialia 56 (18) (2008) 5263–5275. doi:10.1016/j.actamat.2008.07.011.
- [56] O. Adjaoud, K. Albe, Interfaces and interphases in nanoglasses: Surface segregation effects and their implications on structural properties, Acta Mater. 113 (2016) 284 – 292. doi:10.1016/j.actamat.2016.05.002.
- [57] A. S. Argon, H. Y. Kuo, Free-energy spectra for inelastic deformation of 5 metallic-glass alloys, J. Non-Cryst. Solids 37 (2) (1980) 241–266. doi:10.1016/0022-3093(80)90155-6.
- [58] M. E. Kassner, K. Smith, V. Eliasson, Creep in amorphous metals, J. Mater. Res. Technol. 4 (1) (2015) 100–107. doi:10.1016/j.jmrt.2014.11.003.
- [59] E. Ma, Tuning order in disorder, Nat. Mater. 14 (6) (2015) 547–552. doi:10.1038/nmat4300.
- [60] J. Ding, S. Patinet, M. L. Falk, Y. Cheng, E. Ma, Soft spots and their structural signature in a metallic glass, Proceedings of the National Academy of Sciences 111 (39) (2014) 14052–14056. doi:10.1073/pnas.1412095111.
- [61] S. Pauly, G. Liu, S. Gorantla, G. Wang, U. Kühn, D. H. Kim, J. Eckert, Criteria for tensile plasticity in Cu–Zr–Al bulk metallic glasses, Acta Mater. 58 (14) (2010) 4883–4890. doi:10.1016/j.actamat.2010.05.026.
- [62] G. Wang, S. Pauly, S. Gorantla, N. Mattern, J. Eckert, Plastic flow of a Cu50Zr45Ti5 bulk metallic glass composite, J. Mater. Sci. Technol. 30 (6) (2014) 609–615. doi:10.1016/j.jmst.2014.05.003.
- [63] T. Brink, D. Şopu, K. Albe, Solid-state amorphization of Cu nanolayers embedded in a glass, Phys. Rev. B 91 (2015) 184103. doi:10.1103/PhysRevB.91.184103.