Adsorption-Induced Slip Inhibition for Polymer Melts on Ideal Substrates
Abstract
Hydrodynamic slip of a liquid at a solid surface represents a fundamental phenomenon in fluid dynamics that governs liquid transport at small scales. For polymeric liquids, de Gennes predicted that the Navier boundary condition together with the theory of polymer dynamics imply extraordinarily large interfacial slip for entangled polymer melts on ideal surfaces; this Navier-de Gennes model was confirmed using dewetting experiments on ultra-smooth, low-energy substrates. Here, we use capillary leveling – surface tension driven flow of films with initially non-uniform thickness – of polymeric films on these same substrates. Measurement of the slip length from a robust one-parameter fit to a lubrication model is achieved. We show that at the lower shear rates involved in leveling experiments as compared to dewetting ones, the employed substrates can no longer be considered ideal. The data is instead consistent with physical adsorption of polymer chains at the solid/liquid interface. We extend the Navier-de Gennes description using one additional parameter, namely the density of physically adsorbed chains per unit surface. The resulting formulation is found to be in excellent agreement with the experimental observations.
When a liquid flows along a solid surface, molecular friction at the solid/liquid interface can have a large effect on the overall dynamics. For a sufficiently high solid/liquid interfacial friction, the fluid velocity parallel to the interface goes to zero at the boundary. This “no-slip” boundary condition is a standard approximation for describing fluid flow at macroscopic length scales. In the past few decades, there have been many experiments measuring deviations from the no-slip boundary condition at microscopic length scales Léger et al. (1999); Neto et al. (2005); Lauga et al. (2007); Bäumchen and Jacobs (2010); Rothstein (2010). These measurements have stimulated the interest in hydrodynamic slip for both the fundamental understanding of the molecular mechanisms involved, as well as the impact of slip on technological applications Ajdari and Bocquet (2006); Heryudono et al. (2007); Ren and Stein (2008); Vermesh et al. (2009); Bottaro (2014); Striolo (2014); Ilton et al. (2015); Chen et al. (2015); Secchi et al. (2016); Inn and Wang (1996); Pryamitsyn and Ganesan (2006); Begam et al. (2015); Blake (2006); Klein et al. (1994, 1991).
Hydrodynamic slip was first modelled by Navier Navier (1823) using a solid/liquid stress balance at the substrate, which can be used to define the slip length . As shown schematically in Fig. 1a, the linear extrapolation length of the horizontal fluid velocity profile to zero is the slip length, . Experimental techniques used to quantitatively measure the slip length can be broadly classified into four main categories Bouzigues et al. (2008): 1) hydrodynamic drainage experiments, where the pressure is measured as fluid is squeezed out of (or drawn into) a small gap between two solid surfaces Craig et al. (2001); Restagno et al. (2002); Vinogradova and Yakubov (2003); Garcia et al. (2016), 2) a direct measurement of the velocity profile near the interface, by either using tracer particles Ou and Rothstein (2005); Joly et al. (2006); Li et al. (2015) or fluorescence recovery Pit et al. (2000), 3) pressure-drop experiments for flows driven through microchannels Cheng and Giordano (2002); Cheikh and Koper (2003); Choi et al. (2003), and 4) dewetting experiments, which measure the retraction of a thin layer of fluid from a low-energy substrate Redon et al. (1994); Fetzer et al. (2005); Münch and Wagner (2011); Haefner et al. (2015). Reported slip lengths from methods 1) to 4) vary from nm to mm Granick et al. (2003); Wang and Drda (1996), while several studies also indicate the validity of the no-slip boundary condition () Zettner and Yoda (2003); Honig and Ducker (2007); Schaeffel et al. (2013); Ahmad et al. (2015). From these experiments, some of the parameters affecting the magnitude of hydrodynamic slip have been elucidated which include the interfacial properties Barrat and Bocquet (1999); Cho et al. (2004); Cottin-Bizonne et al. (2005), surface roughness Pit et al. (2000); Zhu and Granick (2002), shear rate Léger et al. (1999); Mhetar and Archer (1998); Craig et al. (2001), and molecular weight in polymer fluids Inn and Wang (1996); Wang and Drda (1996); Bäumchen et al. (2009). Thus, is highly sensitive to the solid/liquid combination.
For polymer fluids flowing across ultra-smooth, low-energy surfaces, which act as ideal surfaces de Gennes (1979), dewetting experiments have measured large () slip lengths Bäumchen et al. (2009, 2012, 2014). These results confirmed the scaling of the slip length with molecular weight for polymeric fluids, as originally predicted by de Gennes based on connecting the Navier boundary condition to polymer theory de Gennes (1979). Specifically, Navier assumed that the substrate/liquid stress balance can be expressed as , where and are the linear friction coefficient, the flow velocity parallel to the substrate and the viscosity, and denotes differentiation with respect to the surface-normal. De Gennes assumed a constant and used the classic result of a strongly varying viscosity with molecular weight Rubinstein and Colby (2003), . These essential ingredients allowed the prediction of the Navier-de Gennes model and subsequent experimental verification of the scaling law .
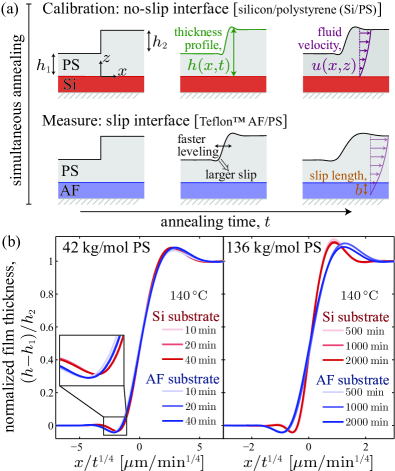
Here, we employ a different experimental technique with shear rates orders of magnitude smaller than those characteristic of dewetting and show that slip is inhibited even on an ideal surface, which is induced by adsorption of polymer chains. We use capillary leveling Buck et al. (2004); McGraw et al. (2012), an experimental approach which invokes a film with an initially non-uniform thickness profile, resulting in an excess surface area compared to a flat film, the latter representing a metastable equilibrium. To suppress the energy cost of the excess surface area, surface tension causes the film to flow, driving it towards a uniform thickness. For an initially stepped film (see Fig. 1a), and after a transient regime, the surface profile evolves in a self-similar fashion – that is, flow causes the profile to broaden, but the characteristic shape remains fixed and the broadening is determined by a power law in time. By monitoring the self-similar profile and fitting it to a lubrication model, quantitative nano-rheological information about the film can be obtained.
Previous works on capillary leveling measured the viscosity of thin polymer films supported by a substrate with a no-slip () boundary condition McGraw et al. (2012), and addressed the infinite-slip () limit using freestanding polymer films where the two free interfaces provide no resistance to flow Ilton et al. (2016). In between the no-slip and infinite-slip extremes, the current work demonstrates the utility of capillary leveling as a quantitative probe of finite interfacial slip. We find that the measured slip length is independent of both temperature and sample geometry over the ranges studied. However, the slip length increases with the molecular weight of the polymer, and eventually saturates to a plateau at large molecular weight despite the ideal character of the substrate. This latter fact contrasts drastically with the previous high-shear-rate dewetting studies using identical materials and conditions Bäumchen et al. (2009, 2012, 2014); Haefner et al. (2015). Inspired by the case of chemically-grafted substrates Brochard-Wyart et al. (1996), we propose a low-shear-rate description based on the presence of a dilute number of physically adsorbed polymer chains, which reconciles the two sets of experiments, and extends the Navier-de Gennes model described above.
I Results
I.1 Experimental approach
Capillary leveling of stepped films is used to measure the slip length of polystyrene (PS) on Teflon™ fluoropolymer (AF) substrates (see Methods), a combination of materials which has been previously shown to exhibit interfacial slip Bäumchen et al. (2009, 2012, 2014); Haefner et al. (2015). As a calibration, identical films of PS are prepared on silicon (Si) substrates since the Si/PS interface has no interfacial slip McGraw et al. (2012). Both types of samples are annealed simultaneously and side-by-side as outlined schematically in Fig. 1a, and surface profiles are obtained with atomic force microscopy (AFM). The self-similar profile of the Si/PS sample provides a calibration measurement of the PS capillary velocity, , where and are the surface tension and viscosity, respectively. Note that the value of depends on temperature and molecular weight, which are identical for the simultaneously studied Si/PS and AF/PS samples. The protocol thus allows the unambiguous and quantitative determination of the slip length of the solid/liquid (AF/PS) interface, the only differing quantity between the two simultaneously annealed samples. The measured film thickness profiles are self-similar in the reduced variable , where is the horizontal coordinate and is the annealing time, for PS stepped films leveling on both substrates (Fig. 1b). We find that PS films broaden more rapidly on the AF substrates than on the Si calibration substrates (Fig. 1b) for all investigated molecular weights, and this faster broadening is more significant at higher PS molecular weight. In order to demonstrate that we can resolve even the smaller slip lengths, we show a zoom on the dip region of the lower molecular weight film as an inset. There, it can clearly be seen that the film on AF has also leveled further than that on Si. As it will be shown below (Fig. 3), we resolve slip lengths at the level of tens of nm. Capillary leveling thus provides one advantage over dewetting, for which small slip lengths have comparatively larger measurement error (Fig. 3).
I.2 Theoretical approach
To extract quantitatively the slip length at the solid/liquid interface, we employ a continuum hydrodynamic model for the thin liquid film. Using the incompressible Stokes’ equations in the lubrication approximation Oron et al. (1997), and allowing for weak slip111We have also analyzed our experiments using the intermediate-slip thin-film equation outlined in Ref. Münch et al. (2005). In the worst case, this results in a small (on the order of ) increase in the measured slip length, which does not affect any of the conclusions of this work. Besides, we stress that strong-slip Münch et al. (2005) or infinite-slip Ilton et al. (2016) descriptions would be incompatible with the observed self-similarity (see Fig. 1b). (slip length much smaller than the characteristic film thickness) at the solid/liquid interface, leads to a partial differential equation describing the evolution of the film thickness profile Münch et al. (2005):
| (1) |
One can nondimensionalize this equation by introducing an arbitrary reference length scale , and the associated time scale . Furthermore, for a given stepped initial profile (Fig. 1a), the rescaled solution of Eq. (1) is self-similar in the variable Münch et al. (2005); Salez et al. (2012a):
| (2) |
but depends intrinsically on two parametric ratios, and . As a particular case, for a stepped initial profile with one can linearize Eq. (1). Nondimensionalizing the obtained equation by introducing the previous length scale , but a different time scale , one obtains the result that the rescaled solution is now a single universal function of only the following generalized variable:
| (3) |
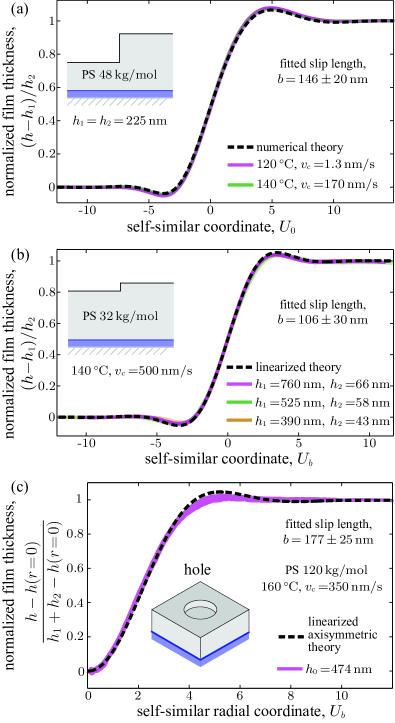
In general, numerical solutions of Eq. (1) Salez et al. (2012a) can be used to fit the data (Fig. 2a). For the particular case of , analytical solutions of the linearized version of Eq. (1) Salez et al. (2012b) can also be used to fit the data (Fig. 2b). Since is fixed by the simultaneous no-slip calibration experiment, and the sample geometry is directly measured using AFM, the slip length is the only free parameter in fitting the theory to experimentally measured AF/PS profiles (Fig. 2). The slip length is found to be independent of temperature (Fig. 2a) in the considered range, and is not sensitive to changes in the sample geometry through and (Fig. 2b).
Complementary experiments were performed in a different geometry, in which the PS film was created with a cylindrical hole at the top Backholm et al. (2014) (see Methods) instead of a step. The result is shown in Fig. 2c. The slip length is determined by fitting the radially averaged normalized profile to the analytical asymptotic solution of the linearized axisymmetric thin-film equation Backholm et al. (2014) – including weak slip through the variable above, where becomes the radial coordinate here.
I.3 Effect of molecular weight on slip
The effect of chain length on interfacial slip was studied using a series of 13 different PS molecular weights kg/mol spanning the range between unentangled and well-entangled PS Rubinstein and Colby (2003); Fetters et al. (1999). Results are shown in Fig. 3a (blue circles). At low molecular weight, the slip length increases with increasing PS molecular weight, but becomes approximately constant for molecular weights greater than kg/mol.
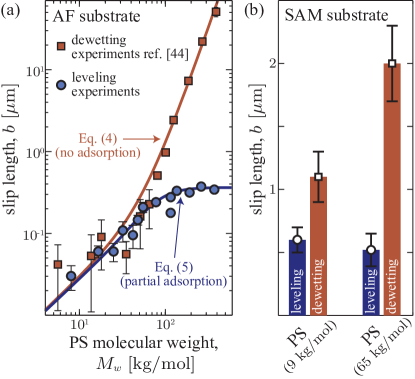
The molecular weight dependence of the AF/PS slip length has previously been found in dewetting studies (Fig. 3a, orange squares) to increase sharply at large molecular weight Bäumchen et al. (2009, 2012, 2014), which contrasts with the leveling results (Fig. 3a, blue circles) in the current work. Although the results from the two techniques agree at low PS molecular weight, the leveling results exhibit slip lengths that are reduced by two orders of magnitude at the highest molecular weights.
To determine if the difference in slip length at high molecular weight is specific to AF/PS, we performed a set of experiments with PS on self-assembled monolayer (SAM) substrates which are known to provide a slip boundary condition for PS Fetzer et al. (2005); Bäumchen et al. (2014). In the SAM/PS experiments, both leveling and dewetting measurements were performed for two different molecular weights (9 kg/mol and 65 kg/mol). Results are shown in Fig. 3b. As for AF/PS, both molecular weights show a discrepancy between the slip length accessed with leveling and dewetting. Furthermore, the difference grows with molecular weight. Therefore, the observed difference in slip length between dewetting and leveling experiments exists also in the SAM/PS system, and is thus not specific to AF/PS.
II Discussion
Using lubrication theory Oron et al. (1997) applied to the leveling experiments, typical shear rates at the substrate can be estimated through . Using the experimental data (Fig. 1), we find strain rates of order for the molecular weights used. This range is three orders of magnitude lower than the average shear rates calculated for dewetting with the same molecular weights Bäumchen et al. (2012), and even lower if the maximum shear rate at the dewetting contact line is used.
A quantitative analysis of the residence time for polymer molecules under flow illustrates the effects of the different shear rates between leveling and dewetting experiments (see Supplemental Information for details). The energy associated with the external force acting on an adsorbed polymer chain is estimated as , where denotes the (Laplace) pressure and the radius of gyration of the chain. Typical values from the leveling experiments (kPa/m), with = 29 nm Rubinstein and Colby (2003), provide J, which is substantially smaller than thermal energy J at C, or the van der Waals interaction energies. Conversely, the energy associated with dewetting experiments is larger than or van der Waals interaction energies by about one order of magnitude, thus crossing the threshold energy scale for chain desorption. The low shear rates for leveling thus lead to residence times for polymer chains at the solid/liquid interface that are long compared to the typical polymer relaxation time, and these adsorbed chains are expected to significantly contribute to the solid/liquid friction. This analysis is supported by studies which find a shear dependence of polymer adsorption Cohen and Metzner (1982); McGlinn et al. (1988) and a recent work demonstrating that dewetting processes are faster when chain adsorption becomes weaker Wang et al. (2017). Assuming that such an adsorption scenario is operative in leveling but not in dewetting, the large difference in measured slip lengths at high molecular weights between the low-shear-rate leveling experiments and high-shear-rate dewetting experiments (Fig. 3) can be rationalized, as detailed below.
The Navier-de Gennes model de Gennes (1979) predicts that under ideal conditions of no adsorption, where the polymer melt slips along a smooth passive surface, the slip length follows the form:
| (4) |
where is the monomer size, is the polymer-melt viscosity, is the viscosity of a melt of monomers, is the monomeric molecular weight, and is the entanglement molecular weight. The right-hand side of Eq. (4) corresponds to a smooth interpolation between the Rouse and mean-field reptation regimes for the polymer-melt viscosity Rubinstein and Colby (2003). To be consistent with the reference dewetting measurements Bäumchen et al. (2009); Hénot et al. (2017), we have chosen the scaling of Eq. (4) to match the large-molecular-weight limit () found previously. We stress that the choice of a different power law (namely, the empirical reptation scaling ) does not alter the conclusions of the present work. Using the parameters and data from Ref. Bäumchen et al. (2009) (i.e. nm, , ), we recall on Fig. 3a (orange line) that Eq.(4) agrees with the dewetting data over the entire molecular-weight range used.
We now turn to the case of low-shear-rate experiments, and we describe the influence of transient physically adsorbed chains in an analogous fashion to the case of permanent chemically grafted chains Brochard-Wyart et al. (1996). In the dilute-adsorption regime, adding the adsorption-induced frictional stress of Eq. (10b) from Ref. Brochard-Wyart et al. (1996) to the previous ideal frictional stress , within the Navier-de Gennes construction de Gennes (1979), leads to the dilute-adsorption prediction for the slip length:
| (5) |
where and is the number of adsorbed chains in one cross-sectional chain area . Invoking the parameters from Ref. Bäumchen et al. (2009) as above, the dimensionless number is thus the only unknown quantity, and we now make the assumption (justified from the fit below) that does not vary (or varies weakly) with . Stated differently, the density of physically adsorbed chains per unit surface is assumed to scale inversely with the cross-sectional chain area.
By fitting Eq. (5) to the leveling experimental data in Fig. 3a, we find an excellent agreement (blue line) and extract . Therefore, with a single free parameter we are able to reconcile the two very different experimental measurements of the slip length on the same AF/PS system. The saturation value of the slip length at high molecular weights and for low shear rates appears to be set by , where is the number of monomers between entanglements (omitting the numerical prefactor in front). The prefactor is expected to increase with shear rate, and to eventually diverge, thus allowing for a continuum of curves in between the two shown in Fig. 3a. In addition, the leveling data appears to have a sufficient resolution to observe for the first time the low- Rouse limit of the Navier-de Gennes prediction. We add two remarks: i) we self-consistently find which validates the dilute-adsorption hypothesis; ii) is indeed nearly constant, as having a variation of with would correspond to not having a plateau for at large .
Although the substrates we use are very smooth (see Methods), it is reasonable to expect that chain adsorption may occur at least temporarily at low shear stresses. First, even ultra-smooth surfaces show contact-angle hysteresis: if a contact line can be pinned on atomic-scale roughness, then so too can polymer chains. Secondly, unfavorable wetting does not imply repulsive interaction between the solid and the liquid, as wetting is rather controlled by a balance between this interaction and the solid-air interaction. Finally, molecular dynamics simulations have shown that adsorbed groups of connected monomers can occur at unfavorable interfaces, and the length of these adsorbed groups increases with molecular weight Smith et al. (2005). Chains which are adsorbed for long enough durations of time to affect the interfacial fluid dynamics are likely to have multiple attached monomers. Therefore, larger adsorbed chains should exclude other chains from adsorbing to the substrate. The fact that is a constant smaller than 1 could be a signature of this exclusion mechanism.
In conclusion, we have demonstrated that capillary leveling can quantitatively probe interfacial dynamics at low shear rates. The use of simultaneously-annealed measurement samples on AF substrates and calibration samples on no-slip Si substrates, combined with weak-slip lubrication theory, allow for a robust one-parameter-fit of the slip length to the experimental data. For the case of PS films on an AF substrate, we find the slip length to increase with PS molecular weight before reaching a plateau value at large molecular weights. This contrasts with previous dewetting measurements on the same AF/PS system, which showed a strong increase in slip length at large PS molecular weights, consistent with the Navier-de Gennes model. Inspired by previous results for grafted chains, we propose an extension of the Navier-de Gennes model which takes into account a dilute physical adsorption of polymer chains in the low-shear-rate leveling experiments, and no adsorption in the high-shear-rate dewetting experiments. With one free parameter, the proposed extension of the Navier-de Gennes model is able to capture the molecular-weight dependence of the slip length for both sets of experiments. Beyond providing new fundamental insights on the actively-studied problem of hydrodynamic slip, these results demonstrate that even ultra-smooth low-energy surfaces such as Teflon cannot always be considered as ideal substrates.
III Methods
III.1 Substrate preparation and characterization
Silicon (Si) wafers (obtained from University Wafer and Si-Mat) were cleaved into 1 cm 1 cm squares. To create the calibration samples, the silicon wafers were rinsed with ultra-pure water (18.2 Mcm, Pall), methanol, and toluene (Fisher Scientific, Optima grade). To create a slip substrate, the wafers were coated with a thin film of the amorphous fluoropolymer AF (AF1600/AF2400, obtained from Sigma Aldrich) by dip coating from a dilute solution (solvent FC-72, obtained from Acros Organics, 0.5% w/w concentration solution, 0.5 mm/s retraction speed). Following the manufacturer’s recommended procedure, the AF substrates were annealed for 20 minutes at above the glass-transition temperature of AF ( for AF1600 or for AF2400) to remove residual solvent. The AF film thickness was 10-15 nm, measured using ellipsometry (EP3, Accurion). Atomic force microscopy (AFM, Caliber, Veeco; Dimension and Multimode, Bruker) measurements showed that the AF substrates have a RMS surface roughness, and that PS droplets have a Young’s contact angle of on these substrates. As a second set of ultra-smooth, low-energy substrates, we decorated Si wafers with a dense self-assembled monolayer (SAM) of octadecyltrichlorosilane (OTS) and dodecyltrichlorosilane (DTS, both purchased from Sigma-Aldrich). The SAM was composed of a mixture of equal parts OTS and DTS, providing the largest slip length for low-molecular-weight PS, see McGraw et al. (2017) for details. Silane molecules covalently bind to the native oxide layer of the Si wafer during the established procedure Lessel et al. (2015); McGraw et al. (2017) for fabrication. These substrates have an RMS roughness of and PS droplets have a long-time, receding contact angle of on these mixed OTS/DTS SAMs McGraw et al. (2017).
III.2 Polymer film preparation
Polystyrene (PS) with molecular weight () ranging between 8–373 kg/mol and polydispersity less than 1.1 was obtained from Polymer Source and PSS. Films with an initially stepped thickness profile (as in Fig. 1a) were made using a previously-described technique McGraw et al. (2012), with only minor modification. A bottom PS film (thickness range ) and a top PS film (thickness range ) were spun cast from a dilute toluene solution (liquid chromatography grade) onto freshly cleaved mica substrates (Ted Pella). The PS films were pre-annealed on mica in a home-built vacuum oven for at least ten times longer than the calculated longest relaxation time of the PS Rubinstein and Colby (2003) (pre-annealing temperature 140-180, pre-annealing time 4-72 hours; depending on the PS molecular weight). After annealing, the bottom PS film was floated onto an ultra-pure water bath (18.2 Mcm, Pall), and picked up onto either a silicon substrate (calibration) or AF substrate (measurement). The bottom film was then allowed to dry for at least 2 hours before undergoing another annealing (annealing for at least two times the calculated longest relaxation time) to relax residual stress. The top PS film was then floated off its mica substrate onto the water bath. Sharp edges in the top PS film were created by the floating process for low PS Bäumchen et al. (2013), or for high PS by a procedure which involved floating onto Si, cleaving, and refloating onto the water bath McGraw et al. (2012). The sharp-edged top film was then picked up off the water bath with the previously-prepared bottom PS film on a substrate. A final drying of the film at room temperature concluded the sample preparation procedure. Identical procedures were applied for the experiments on the SAM substrates. Additional samples where the second film was prepared with a hole (as in Fig. 2c) were made in the same manner as the stepped films described above, except for the creation of sharp edges. For the hole geometry, a top film was floated onto the water bath and picked up using a metal washer with a millimetric circular hole to create a freestanding film. The top film was then heated above the PS glass-transition temperature in the freestanding state until small holes were nucleated with a diameter between and . After quenching to room temperature, the top film was transferred onto the bottom film supported by a solid substrate. Full details on the hole-geometry sample preparation are presented in Ref. Backholm et al. (2014).
III.3 Experimental setup
Pairs of otherwise identically-prepared samples were used with only the substrate being different (Si or AF). The film thickness profile of each sample was determined by measuring the surface topography of the film using AFM, and averaging the 3D topography along the direction of translational quasi-invariance of the sample to obtain a 2D thickness profile. The pairs of samples were then placed side-by-side for simultaneous annealing in either the home-built vacuum oven or on a hot stage (Linkam, UK). For a given pair of samples, the annealing temperature was held constant (between 120 and 160), and chosen such that the PS was in its liquid melt state inducing the capillary-driven leveling of the thickness profiles. After a chosen duration of annealing , the samples were rapidly quenched to room temperature, deep into the glassy state of PS, where the leveling process was temporarily halted. The broadening of the thickness profiles were measured using AFM. The samples were then further annealed, quenched, and measured again using AFM. The process of alternate annealing and AFM measurements was repeated until the measured thickness profiles became self-similar (Fig. 1b).
IV Acknowledgements
The authors thank Vincent Bertin, Pascal Damman, Frédéric Restagno, Barbara Wagner, Andreas Münch and Dirk Peschka for interesting discussions. They acknowledge financial support from the German Research Foundation (DFG) under grant BA3406/2 and NSERC (Canada). T.S. acknowledges financial support from the Global Station for Soft Matter, a project of Global Institution for Collaborative Research and Education at Hokkaido University. O.B. acknowledges financial support from the Joliot ESPCI Paris Chair and the Total-ESPCI Paris Chair. J.D.M. and M.A. were supported by LabEX ENS-ICFP: No. ANR-10- LABX-0010/ANR-10-IDEX-0001-02 PSL.
V Author Contributions
M.I., T.S., J.D.M., E.R., K.D.-V. and O.B. conceived the project and designed research. M.I., P.D.F., M.R., M.A., J.D.M. and O.B. performed experiments. T.S., M.B., J.D.M. and E.R. developed the theory. All authors contributed to the analysis and interpretation of the results. M.I., T.S., J.D.M., E.R., K.D.-V. and O.B. wrote the manuscript.
VI Additional information
Supplementary Information accompanies this paper at [URL].
Competing financial interests: The authors declare no competing financial
interest.
References
- Léger et al. (1999) L. Léger, E. Raphaël, and H. Hervet, Advances in Polymer Science 138, 185 (1999).
- Neto et al. (2005) C. Neto, D. R. Evans, E. Bonaccurso, H.-J. Butt, and V. S. J. Craig, Reports on Progress in Physics 68, 2859 (2005).
- Lauga et al. (2007) E. Lauga, M. Brenner, and H. Stone, in Springer Handbook of Experimental Fluid Mechanics, edited by C. Tropea, A. L. Yarin, and J. F. Foss (Springer Berlin Heidelberg, 2007) Chap. 19, pp. 1219–1240.
- Bäumchen and Jacobs (2010) O. Bäumchen and K. Jacobs, Soft Matter 6, 6028 (2010).
- Rothstein (2010) J. P. Rothstein, Annu. Rev. Fluid Mech 42, 89 (2010).
- Ajdari and Bocquet (2006) A. Ajdari and L. Bocquet, Physical Review Letters 96, 186102 (2006).
- Heryudono et al. (2007) A. Heryudono, R. J. Braun, T. A. Driscoll, K. L. Maki, L. P. Cook, and P. E. King-Smith, Mathematical Medicine and Biology 24, 347 (2007).
- Ren and Stein (2008) Y. Ren and D. Stein, Nanotechnology 19, 195707 (2008).
- Vermesh et al. (2009) U. Vermesh, J. W. Choi, O. Vermesh, R. Fan, J. Nagarah, and J. R. Heath, Nano Letters 9, 1315 (2009).
- Bottaro (2014) A. Bottaro, Istituto Lombardo (Rend. Scienze) 148, 239 (2014).
- Striolo (2014) A. Striolo, MRS Bulletin 39, 1062 (2014).
- Ilton et al. (2015) M. Ilton, O. Bäumchen, and K. Dalnoki-Veress, Physical Review Letters 115, 046103 (2015).
- Chen et al. (2015) F. Chen, D. Peng, C.-H. Lam, and O. K. C. Tsui, Macromolecules 48, 5034 (2015).
- Secchi et al. (2016) E. Secchi, S. Marbach, A. Niguès, D. Stein, A. Siria, and L. Bocquet, Nature 537, 210 (2016).
- Inn and Wang (1996) Y. Inn and S.-Q. Wang, Physical Review Letters 76, 467 (1996).
- Pryamitsyn and Ganesan (2006) V. Pryamitsyn and V. Ganesan, Journal of Rheology 50, 655 (2006).
- Begam et al. (2015) N. Begam, S. Chandran, M. Sprung, and J. K. Basu, Macromolecules 48, 6646 (2015).
- Blake (2006) T. D. Blake, Journal of Colloid and Interface Science 299, 1 (2006).
- Klein et al. (1994) J. Klein, E. Kumacheva, D. Mahalu, D. Perahia, and L. J. Fetters, Nature 370, 634 EP (1994).
- Klein et al. (1991) J. Klein, D. Perahia, and S. Warburg, Nature 352, 143 EP (1991).
- Navier (1823) C. Navier, Mémoires de l’Académie des Sciences de l’Institut de France 6, 389 (1823).
- Bouzigues et al. (2008) C. Bouzigues, L. Bocquet, E. Charlaix, C. Cottin-Bizonne, B. Cross, L. Joly, A. Steinberger, C. Ybert, and P. Tabeling, Philosophical Transactions of the Royal Society of London A: Mathematical, Physical and Engineering Sciences 366, 1455 (2008).
- Craig et al. (2001) V. S. J. Craig, C. Neto, and D. R. M. Williams, Physical Review Letters 87, 054504 (2001).
- Restagno et al. (2002) F. Restagno, J. Crassous, É. Charlaix, C. Cottin-Bizonne, and M. Monchanin, Review of Scientific Instruments 73, 2292 (2002).
- Vinogradova and Yakubov (2003) O. I. Vinogradova and G. E. Yakubov, Langmuir 19, 1227 (2003).
- Garcia et al. (2016) L. Garcia, C. Barraud, C. Picard, J. Giraud, E. Charlaix, and B. Cross, Review of Scientific Instruments 87, 113906 (2016).
- Ou and Rothstein (2005) J. Ou and J. P. Rothstein, Physics of Fluids 17, 103606 (2005).
- Joly et al. (2006) L. Joly, C. Ybert, and L. Bocquet, Physical Review Letters 96 (2006).
- Li et al. (2015) Z. Li, L. D’eramo, C. Lee, F. Monti, M. Yonger, B. Chollet, B. Bresson, Y. Tran, and P. Tabeling, Journal of Fluid Mechanics 766, 146 (2015).
- Pit et al. (2000) R. Pit, H. Hervet, and L. Léger, Physical Review Letters 85, 980 (2000).
- Cheng and Giordano (2002) J.-T. Cheng and N. Giordano, Physical review E 65, 031206 (2002).
- Cheikh and Koper (2003) C. Cheikh and G. Koper, Physical review letters 91, 156102 (2003).
- Choi et al. (2003) C.-H. Choi, K. J. A. Westin, and K. S. Breuer, Physics of fluids 15, 2897 (2003).
- Redon et al. (1994) C. Redon, J. B. Brzoska, and F. Brochard-Wyart, Macromolecules 27, 468 (1994).
- Fetzer et al. (2005) R. Fetzer, K. Jacobs, B. Wagner, and T. P. Witelski, Physical Review Letters 95, 127801 (2005).
- Münch and Wagner (2011) A. Münch and B. Wagner, Journal of physics. Condensed matter 23, 184101 (2011).
- Haefner et al. (2015) S. Haefner, M. Benzaquen, O. Bäumchen, T. Salez, R. Peters, J. D. McGraw, K. Jacobs, E. Raphaël, and K. Dalnoki-Veress, Nature Communications 6, 7409 (2015).
- Granick et al. (2003) S. Granick, Y. Zhu, and H. Lee, Nature materials 2, 221 (2003).
- Wang and Drda (1996) S.-Q. Wang and P. A. Drda, Macromolecules 29, 2627 (1996).
- Zettner and Yoda (2003) C. Zettner and M. Yoda, Experiments in Fluids 34, 115 (2003).
- Honig and Ducker (2007) C. D. F. Honig and W. A. Ducker, Phys. Rev. Lett. 98, 028305 (2007).
- Schaeffel et al. (2013) D. Schaeffel, S. Yordanov, M. Schmelzeisen, T. Yamamoto, M. Kappl, R. Schmitz, B. Dünweg, H.-J. Butt, and K. Koynov, Phys. Rev. E 87, 051001 (2013).
- Ahmad et al. (2015) K. Ahmad, X. Zhao, Y. Pan, W. Wang, and Y. Huang, The Journal of Physical Chemistry C 119, 12531 (2015) .
- Barrat and Bocquet (1999) J.-L. Barrat and L. Bocquet, Physical Review Letters 82, 4671 (1999).
- Cho et al. (2004) J.-H. Cho, B. Law, and F. Rieutord, Physical Review Letters 92, 166102 (2004).
- Cottin-Bizonne et al. (2005) C. Cottin-Bizonne, B. Cross, A. Steinberger, and E. Charlaix, Physical Review Letters 94, 056102 (2005).
- Zhu and Granick (2002) Y. Zhu and S. Granick, Physical Review Letters 88, 106102 (2002).
- Mhetar and Archer (1998) V. Mhetar and L. Archer, Macromolecules 31, 8607 (1998).
- Bäumchen et al. (2009) O. Bäumchen, R. Fetzer, and K. Jacobs, Physical Review Letters 103, 1 (2009).
- de Gennes (1979) P.-G. de Gennes, Comptes rendus hebdomadaires des séances de l’Académie des Sciences Série B, Sciences physiques 288, 219 (1979).
- Bäumchen et al. (2012) O. Bäumchen, R. Fetzer, M. Klos, M. Lessel, L. Marquant, H. Hähl, and K. Jacobs, Journal of Physics: Condensed Matter 24, 325102 (2012).
- Bäumchen et al. (2014) O. Bäumchen, L. Marquant, R. Blossey, A. Münch, B. Wagner, and K. Jacobs, Physical Review Letters 113, 014501 (2014).
- Rubinstein and Colby (2003) M. Rubinstein and R. H. Colby, Polymer Physics (OUP Oxford, 2003).
- Buck et al. (2004) E. Buck, K. Petersen, M. Hund, G. Krausch, and D. Johannsmann, Macromolecules 37, 8647 (2004).
- McGraw et al. (2012) J. D. McGraw, T. Salez, O. Bäumchen, E. Raphaël, and K. Dalnoki-Veress, Physical Review Letters 109, 1 (2012).
- Ilton et al. (2016) M. Ilton, M. M. P. Couchman, C. Gerbelot, M. Benzaquen, P. D. Fowler, H. A. Stone, E. Raphaël, K. Dalnoki-Veress, and T. Salez, Physical Review Letters 117, 167801 (2016).
- Brochard-Wyart et al. (1996) F. Brochard-Wyart, C. Gay, and P.-G. de Gennes, Macromolecules 29, 377 (1996).
- Oron et al. (1997) A. Oron, S. Davis, and S. Bankoff, Reviews of Modern Physics 69, 931 (1997).
- Münch et al. (2005) A. Münch, B. Wagner, and T. P. Witelski, Journal of Engineering Mathematics 53, 359 (2005).
- Salez et al. (2012a) T. Salez, J. D. McGraw, S. L. Cormier, O. Bäumchen, K. Dalnoki-Veress, and E. Raphaël, The European Physical Journal E 35, 114 (2012a).
- Salez et al. (2012b) T. Salez, J. D. McGraw, O. Bäumchen, K. Dalnoki-Veress, and E. Raphaël, Physics of Fluids 24, 102111 (2012b).
- Backholm et al. (2014) M. Backholm, M. Benzaquen, T. Salez, E. Raphaël, and K. Dalnoki-Veress, Soft matter 10, 2550 (2014).
- Fetters et al. (1999) L. Fetters, D. Lohse, S. Milner, and W. Graessley, Macromolecules 32, 6847 (1999).
- Cohen and Metzner (1982) Y. Cohen and A. B. Metzner, Macromolecules 15, 1425 (1982).
- McGlinn et al. (1988) T. McGlinn, D. Kuzmenka, and S. Granick, Physical review letters 60, 805 (1988).
- Wang et al. (2017) L. Wang, L. Xu, B. Liu, T. Shi, S. Jiang, and L. An, Soft Matter 13, 3091 (2017).
- Hénot et al. (2017) M. Hénot, E. Drockenmuller, L. Léger, and F. Restagno, (2017), arXiv:1704.02742 .
- Smith et al. (2005) K. A. Smith, M. Vladkov, and J. L. Barrat, Macromolecules 38, 571 (2005).
- McGraw et al. (2017) J. McGraw, M. Klos, A. Bridet, H. Hähl, M. Paulus, J. Castillo, M. Horsch, and K. Jacobs, Journal of Chemical Physics 146, 203326 (2017).
- Lessel et al. (2015) M. Lessel, O. Bäumchen, M. Klos, H. Hähl, R. Fetzer, M. Paulus, R. Seemann, and K. Jacobs, Surface and Interface Analysis 47, 557 (2015), arXiv:1212.0998 .
- Bäumchen et al. (2013) O. Bäumchen, M. Benzaquen, T. Salez, J. D. McGraw, M. Backholm, P. Fowler, E. Raphaël, and K. Dalnoki-Veress, Physical Review E 88, 035001 (2013) .