Measurement of the evolution of the magnetic field of the quiet photosphere during a solar cycle
Abstract
The solar photosphere is filled by a magnetic field which is tangled on scales much smaller than the resolution capability of solar telescopes. This hidden magnetic field can be investigated via the Hanle effect. In 2007 we started a synoptic program to explore if the magnetic flux of the quiet photosphere varies with the solar cycle. For this purpose we applied a differential Hanle effect technique based on observations of scattering polarization in C2 molecular lines around 514.0 nm, taken generally every month. Our results now span almost one complete solar cycle.
1 Introduction
The solar photosphere is seething with a vast amount of magnetic flux tangled on scales much smaller than the resolution that can be achieved by solar telescopes. Observing techniques based on the Zeeman effect are in practice blind to such magnetic flux due to signal cancellation effects generated by mixed polarity fields present in a single resolution element. This hidden magnetism can be however investigated considering the Hanle effect observed with high precision spectropolarimetric measurements.
In 2007, when the minimum of the solar cycle was approaching, we started a synoptic program (Kleint et al. 2011, 2010) to explore possible variations with the solar cycle of this tangled magnetic flux. The observations consist in the measurement of the scattering polarization of C2 molecular lines in the spectral region around 514.0 nm in the quiet Sun. The magnetic flux is then inferred applying a differential Hanle effect technique as described by Stenflo et al. (1998).
2 The observations
The observations are generally carried out with the cadence of about one month at the Gregory-Coudé telescope in Locarno. With the ZIMPOL polarimeter (Ramelli et al. 2010; Gandorfer et al. 2004) we achieve a polarimetric resolution of the order of , thanks to a fast piezo-elastic modulator (42 kHZ) and a synchronous demodulation, done with a special dedicated CCD-camera. As a result of the fast modulation, seeing induced effects are avoided. The scattering polarization measurements are obtained with the spectrograph slit set parallel to the solar limb at a distance of about 5-10 arcsec from it (i.e, 0.1- 0.15) and subtends about 180 arcsec. A set of five observations is usually carried out in five heliographic positions: North Pole (N) , North-West at +45∘ latitude (NW), West equator (W), South-West at -45∘ latitude (SW) and South Pole (S). Including all calibrations (polarimetric, dark, flat-field), this set of observations takes about half a day.
Since beginning of this synoptic program, several improvements were applied to the instrumentation, such as the deployment of the version III of the ZIMPOL system in 2010 (Ramelli et al. 2010) or a new silver coating of the mirrors. Thanks to them it was possible to increase the observing efficency. A limb tracking system and other automatic systems allowed to fully automatize the observing procedure.
3 Results
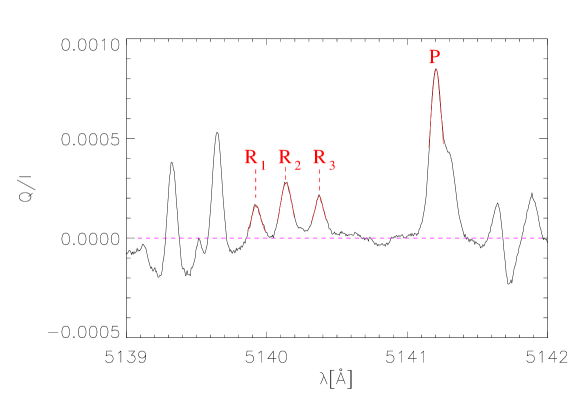
An example of the linear polarization profile (Q/I) obtained in a typical observation, is shown in Figure 1. The zero level of polarization has been shifted here in order to correspond to the average polarization measured in the continuum. The four marked peaks represent the R1, R2, R3 and P spectral lines of two different C2 triplets considered in this synoptic program.
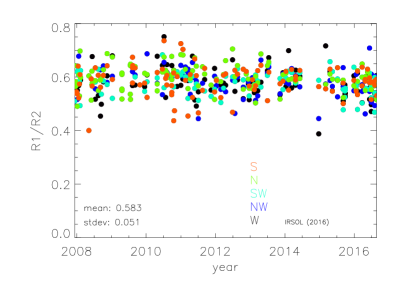
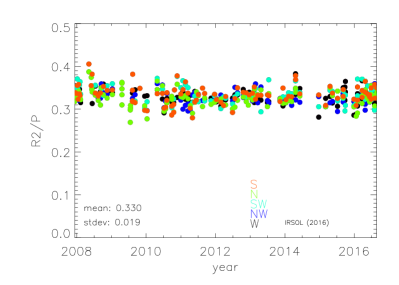
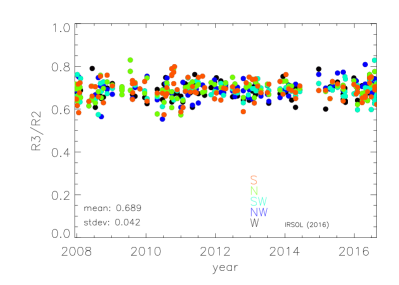
The temporal evolution of the observed ratios between the Q/I signal amplitudes of different C2 lines with respect to the continuum are reported in Figure 2 for the whole data set. The observing period from 2007 to 2016 includes both the minimum (2009) and the maximum (2014) of the present solar cycle. From the temporal evolution it is difficult to see significant variations.
In order to better analyze the correlation between the solar cycle and the observed ratios trough a more careful analysis we report in Figure 3 scatter plots of the measured ratios towards the smoothed International Sunspot Number (SSN)111Source: WDC-SILSO, Royal Observatory of Belgium, Brussels, which is an index directly related with the amount of solar activity. In order to reduce the scattering of the points we average for each observing day the ratios obtained at the different limb positions. We report one point on the scatter plots for each day during which we obtained at least three complete observations at different limb positions. Thus the statistics include 87 observing days. The smoothing of the SSN has been obtained considering the running average over a period of 30 days.


4 Conclusion
It is not easy to appreciate long term variations of the measured ratios among the polarization singals observed in C2 lines. The available data do not show a very clear correlation with solar activity, that could lead us to think that the turbulent unresolved magnetic field strength varies with the solar cycle. A more detailed and carefull interpretation and analysis of the results are in progress. The observing program will continue and provide more statistics. The data will soon cover a complete solar cycle.
Acknowledgments
IRSOL is supported by the Swiss Confederation (SEFRI) , Canton Ticino, the city of Locarno and the local municipalities. This research work was financed by SNF grants 200020_157103 and 200020_169418. We are grateful to the Fondazione Aldo e Cele Daccò for their financial contribution.
References
- Gandorfer et al. (2004) Gandorfer, A. M., Steiner, P., Povel, H. P., Aebersold, F., Egger, U., Feller, A., Gisler, D., Hagenbuch, S., & Stenflo, J. O. 2004, A&A, 422, 703
- Kleint et al. (2010) Kleint, L., Berdyugina, S. V., Shapiro, A. I., & Bianda, M. 2010, A&A, 524, A37
- Kleint et al. (2011) Kleint, L., Shapiro, A. I., Berdyugina, S. V., & Bianda, M. 2011, A&A, 536, A47
- Ramelli et al. (2010) Ramelli, R., Balemi, S., Bianda, M., Defilippis, I., Gamma, L., Hagenbuch, S., Rogantini, M., Steiner, P., & Stenflo, J. O. 2010, in SPIE Conf. Ser., vol. 7735, 77351Y
- Stenflo et al. (1998) Stenflo, J. O., Keller, C. U., & Gandorfer, A. 1998, A&A, 329, 319