Atlas of the solar intensity spectrum and its center to limb variation
Abstract
The solar limb darkening function is well known and is widely employed in models of the solar atmosphere. However, there has been a lack of systematic spectrally resolved measurements. Therefore we recently decided to start an observing campaign with the Gregory Coudé Telescope at IRSOL in Locarno in order to produce a spectral atlas obtained at 10 different heliocentric angles , chosen so that covers the interval from 0.1 to 1.0 in step of 0.1. The measurements carried out till now include the spectral range from 439 nm to 666 nm.
The collected data provide information about the anisotropy of the emergent radiation field on the solar surface, allowing a better modeling of the Second Solar Spectrum. In addition the data give observational constraints that should be taken into account when modeling the solar atmosphere.
1Istituto Ricerche Solari Locarno IRSOL, associated to Università della Svizzera Italiana, Locarno, TI, Switzerland;
2Hochschule RheinMain, Rüsselsheim, Deutschland;
3Institute of Astronomy, ETH Zurich, 8093 Zurich, Switzerland
1 Introduction
The Sun’s disk observed at visible wavelengths is limb darkened. The main reason is the temperature decrease with height in the layers from where the radiation is coming, when they are seen at different center-to-limb positions, which are usually defined by , where is the heliocentric angle. Due to the fact that the opacity, the height of formation and non-local thermodynamical equilibrium (non-LTE) effects vary along the profiles of the different lines present in the solar spectrum, the limb darkening function changes remarkably across the spectral lines.
The limb darkening is also directly related to the anisotropy of the emergent radiation at the solar surface, which is the source of the scattering polarization whose spectral dependence is referred to as the Second Solar Spectrum (Stenflo & Keller 1997). Spectrally resolved limb darkening measurements thus provide important information to be taken into account when modeling both the Second Solar Spectrum and the solar atmosphere.
The center-to-limb variation (CLV) of the intensity solar spectrum is richly structured, but in ways that differ profoundly from the usual intensity spectrum (in this context, the First Solar Spectrum) and from the Second Solar Spectrum. Thus Stenflo (2015) suggests referring to the intensity CLV as the Third Solar Spectrum (SS3).
2 Observations
The SS3 atlas presented in this work has been obtained with the Gregory-Coudé telescope at IRSOL in the spectral range from 439 nm to 666 nm at 10 different heliocentric angles corresponding to from 0.1 to 1.0 in step of 0.1. The spectrograph connected to the telescope is a Czerny Turner of 10 m focal length equipped with a grating with 316 grooves/mm, a blaze angle of 63∘ and whose size is 180 x 360 mm. The observations have been recorded with a ZIMPOL camera (Ramelli et al. 2010) that usually is used with masked CCD sensors for polarimetry, but which for this project has been equipped with an unmasked sensor that is better suited for intensity measurements. The data acquisition procedure has been almost fully automatized thanks to the usage of the scripting possibilities given by the ZIMPOL control software described by Ramelli et al. (2010). Accurate positioning has been done thanks to the Primary Image Guiding system reported by Küveler et al. (2011). A limb tracking system connected to the slit-jaw camera and based on a tilting glass plate, has been used to keep a constant limb distance, when the limb was visible in the field of view of the telescope (i.e. from to ). A Dove prism has been used to rotate the image observed in order to keep the orientation of the heliographic North parallel to the spectrograph slit. The observing sequence was chosen in order to have an observation at the center of the solar disc (), immediately before or after each observation taken at the different -positions. For each spectral window we also took a corresponding flat-field and dark observation. After a quality check some observations needed to be repeated.
3 Data reduction and results
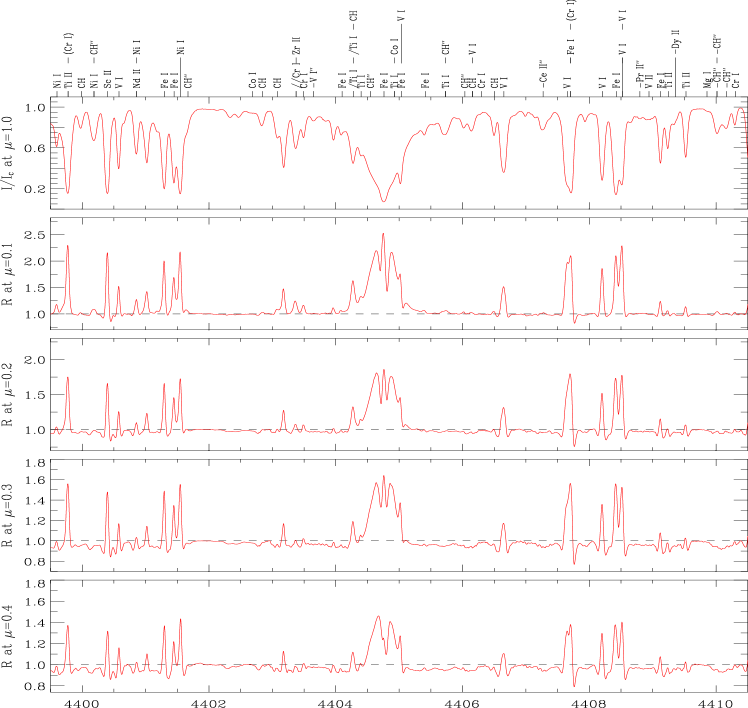
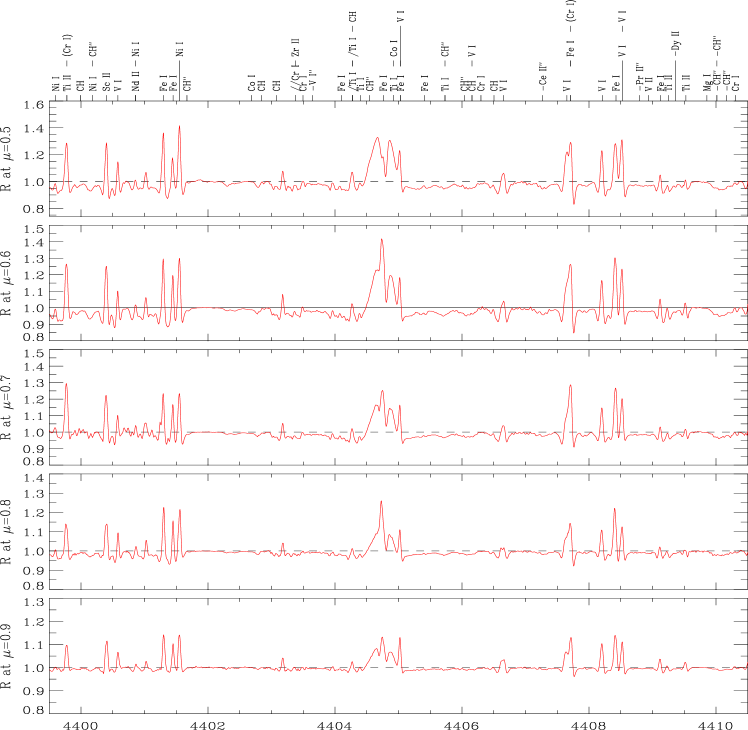
Each observation has been corrected for flat-field and dark. The spectral intensity profiles have been obtained averaging over 30 arcseconds along the spatial direction. Both the spectra at the different positions and the spectra at the disc center have been normalized so that the continuum is set to 1. The wavelength scale has been determined with the help of the FTS atlas (Kurucz et al. 1984). For each -position we calculate the ratio
| (1) |
The SS3 atlas obtained in this work displays the intensity spectrum at disc center and the 9 -profiles obtained at the different center to limb positions (see example in Figures 1 and 2). Our effort has been put in measuring precisely as possible the function. Since very precise and reliable measurements have been made by Neckel & Labs (1994) for center to limb variation in the continuum and by Kurucz et al. (1984) for the intensity spectrum at disc center , we suggest the reader that he should use for the intensity spectrum at a particular position
| (2) |
as best estimate.
Data are made available to the public on the IRSOL web-site at the address:
Acknowledgments
IRSOL is supported by the Swiss Confederation (SEFRI) , Canton Ticino, the city of Locarno and the local municipalities. This research work was financed by SNF grants 200020_157103 and 200020_169418. We are grateful to the Fondazione Aldo e Cele Daccò for their financial contribution.
References
- Kurucz et al. (1984) Kurucz, R. L., Furenlid, I., Brault, J., & Testerman, L. 1984, Solar flux atlas from 296 to 1300 nm
- Küveler et al. (2011) Küveler, G., Dao, V. D., & Ramelli, R. 2011, Astronomische Nachrichten, 332, 502
- Neckel & Labs (1994) Neckel, H., & Labs, D. 1994, Solar Phys., 153, 91
- Ramelli et al. (2010) Ramelli, R., Balemi, S., Bianda, M., Defilippis, I., Gamma, L., Hagenbuch, S., Rogantini, M., Steiner, P., & Stenflo, J. O. 2010, in SPIE Conf. Ser., vol. 7735, 77351Y
- Stenflo (2015) Stenflo, J. O. 2015, A&A, 573, A74
- Stenflo & Keller (1997) Stenflo, J. O., & Keller, C. U. 1997, A&A, 321, 927