First FAMU observation of muon transfer from p atoms to higher-Z elements
Abstract
The FAMU experiment aims to accurately measure the hyperfine splitting of the ground state of the muonic hydrogen atom. A measurement of the transfer rate of muons from hydrogen to heavier gases is necessary for this purpose. In June 2014, within a preliminary experiment, a pressurized gas-target was exposed to the pulsed low-energy muon beam at the RIKEN RAL muon facility (Rutherford Appleton Laboratory, UK). The main goal of the test was the characterization of both the noise induced by the pulsed beam and the X-ray detectors. The apparatus, to some extent rudimental, has served admirably to this task. Technical results have been published that prove the validity of the choices made and pave the way for the next steps. This paper presents the results of physical relevance of measurements of the muon transfer rate to carbon dioxide, oxygen, and argon from non-thermalized excited p atoms. The analysis methodology and the approach to the systematics errors are useful for the subsequent study of the transfer rate as function of the kinetic energy of the p currently under way.
1 The FAMU project
The final objective of the FAMU experiment is to determine the proton Zemach radius by measuring the hyperfine splitting of the p ground state. In literature, the “standard” measurement of the Zemach radius of the proton is achieved using ordinary hydrogen. A comparison with the value extracted from muonic hydrogen may reinforce or delimit the proton radius puzzle [1].
The FAMU experimental method requires a detection system suited for time resolved X-ray spectroscopy [2]. The characteristic X-rays from muonic atoms formed in different targets have been detected using HPGe detectors and five scintillating counters based on LaBr3(Ce) crystals, whose output was recorded for 5 s using a 500 MHz digitizer to measure both energy and time spectrum of the detected events. The expected characteristic muonic X-rays of various elements and the mean lifetimes were determined through a detailed pulse analysis.
In the proposed laser spectroscopy experiment, muonic hydrogen atoms are formed in a hydrogen gas target. In subsequent collisions with molecules, the p de-excite at thermalized p in the state. A laser tuned on the hyperfine splitting resonance induces singlet-to-triplet transitions; when the p atoms in the state are de-excited back to the singlet state and the transition energy is converted into additional kinetic energy of the p system. Thus the p atom gains about two-thirds of the hyperfine transition energy ( meV). The energy dependence of the muon transfer from muonic hydrogen to another higher-Z gas is exploited to detect the transition which occurred in the p. Although, in general, the muon-transfer rate at low energies is energy independent, this is not the case for a few gases. Oxygen exhibits a peak in the muon transfer rate at epithermal energy [3]. Thus by adding small quantities of oxygen to hydrogen it is possible to observe, by measuring the time distribution of the characteristic X-rays from the muon-transfer events to the added gas, the number of hyperfine transitions which take place. The setup of this first FAMU experimental test is described in details in [2]: it consisted in a beam hodoscope placed in front of a high pressure gas in an aluminium vessel surrounded by X-rays detectors. For these tests, four different targets were exposed to the muon beam: a pure graphite block and three gas mixtures (pure , , , measured by weight). The hydrogen gas contained a natural admixture of deuterium. The aim was to study detector response in the environment of the muon beam at RIKEN RAL through the measurement of the muon transfer rate at room temperature. The muonic atom characteristic X-rays were detected using scintillating counters based on LaBr3(Ce) crystals (energy resolution 3% at 662 keV and decay time ns) read out by Hamamatsu R11265-200 PMTs and two HPGe detectors were used to obtain a benchmark spectrum. The waveforms were processed off-line to reconstruct the time and energy of each detected X-ray.
2 Muonic atom formation and muon transfer
At RAL muons are produced in bunches with a repetition rate of 50 Hz. Each bunch is consisting of two spills separated by about 320 ns. Each spill can be roughly described as a gaussian distribution with FWHM of 70 ns and the incident muon momentum has a gaussian distribution with [4]. The mean of the distribution can be tuned by beam users and it was chosen to be 61 MeV/c for the 2014 FAMU data acquisition.
Exiting the kapton window of the beam pipe collimator at a rate of about particle per second, muons cross the FAMU beam hodoscope [5] and reach the gas in the aluminium vessel after crossing a 3 mm thick aluminium window.
Muons loose energy mostly by the ionization process. The initial momentum was chosen in order to maximize the muon stop in the gas of the target. Once a muon is slowed down to zero, it is captured by the closest atom into high orbital states, forming a muonic atom.
The muon atomic orbit equivalent to the electron orbit has a principal quantum number and it is reached by the muon in femtoseconds from the instant of its atomic capture [6]. The muon cascades down rapidly to the lowest quantum state available, . In the case of light elements, de-excitation starts with Auger process until the quantum number reaches values from 3 to 6 at which radiative transitions take over. During radiative transitions X-rays are emitted at an energy corresponding to the energy levels difference. Due to momentum conservation, muonic hydrogen gains kinetic energy during this phase.
In pure hydrogen, once the muon is in the orbit it either decays () or is captured by the nucleus (). In hydrogen the capture to decay probability ratio is of the order of , while this ratio becomes about one around [6].
In presence of material impurities with mass number A1 and atomic number Z1, the muonic hydrogen system can undergo the transfer reaction , which results in the formation of a new muonic atom which then de-excites by Auger and radiative processes.
The muon transfer rate from hydrogen to higher-Z gases depends on the density of the gas, on the amount of impurities in the hydrogen gas and on the kinetic energy of the muonic hydrogen.
Once constructed, to avoid any contamination, the aluminium target was submitted to cycles of washing and heating. During transportation the target was filled with nitrogen at about 2 bar. For every gas change, the target was evacuated at a vacuum level below mbar. This procedure assured a contamination level smaller than one part per million during the data taking. HpGe detectors confirmed the purity of the gas inside the target.
3 Data analysis
The measurement of the transfer rate as function of the muonic hydrogen kinetic energy should be performed in stable thermalized condition. In this state, at a given temperature of the target, the kinetic energy of the p follows the Maxwell-Boltzmann distribution.
Although the 2014 apparatus was devoted to study the beam conditions and the signal to noise ratio attainable with the chosen detection system (LaBr3(Ce) and HPGe detectors), a detailed analysis has been carried out to measure the transfer rate from hydrogen to atoms with higher Z.
In this study the gas target was kept at a pressure of 38 bar at room temperature. In these conditions the thermalization of the muonic hydrogen, after formation, requires about 100 ns [7]. However at the concentration of (4% by weight) used in the gas mixture the population of muonic hydrogen is greatly suppressed by muon transfer to the within times well below 100 ns [7]. Hence the transfer arises in epithermal uncontrolled conditions at which the kinetic energy of muonic hydrogen during the muon transfer can be assumed to be distributed as a sum of two Maxwellians distributions, the first related to the gas temperature and the second one corresponding to the mean energy of 20 eV, (see [8] and references therein).
The 2014 data analysis showed a strong X-ray emission from K-lines de-excitation of muonic oxygen and carbon and at the same time no delayed oxygen or carbon lines emission after about 10–20 ns from the arrival of the last of the muon beam spills [2].
Since most of the muons are captured by the hydrogen in the mixture – as confirmed by a dedicated GEANT4 simulation [9] – and the percentage of oxygen atoms is order of per mille, the detected oxygen and carbon lines mostly come from muon transfer from hydrogen to .
Hence, a study of the time evolution of the oxygen K-lines emission can be performed to measure the transfer rate. Since the transfer process is faster than 100 ns, this analysis concerns the X-rays from carbon and oxygen detected during the arrival of the muon beam itself within the prompt X-ray background emission from all the elements of the target, mostly aluminium. In this situation the p can be excited and have a very wide energy distribution, so the level of epithermicity is undetermined.
The variation of the number of muonic hydrogen atoms present in the target in the time interval can be expressed by:
| (3.1) |
where is the number of muonic hydrogen generated in the time interval , and is the total disappearance rate of the muonic hydrogen atoms:
| (3.2) |
Here is the rate of disappearance of the muons bounded to proton (that includes both muon decay and nuclear capture), is the formation rate of the molecular ion in collision of with a hydrogen nucleus, denotes the muon transfer rate from p to deuterium, and are the muon transfer rates from to the admixture nuclei of charge ( etc). The formation and muon transfer rates are all normalized to the liquid hydrogen number density (LHD) cm-3, and is the target gas number density in LHD units. The atomic concentrations of hydrogen, deuterium, and heavier-nuclei admixture in the gas target, denoted by , , , are related to the number densities of the latter, , , and , by:
The key point of this analysis is that the time evolution of the emission of prompt X-rays from the aluminium of the target resembles the time shape of the beam pulses and can be used as a description of the formation rate of muonic hydrogen .
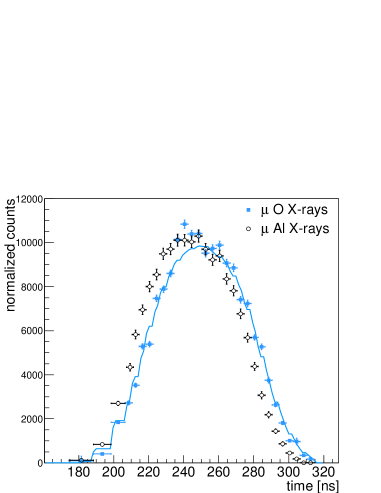
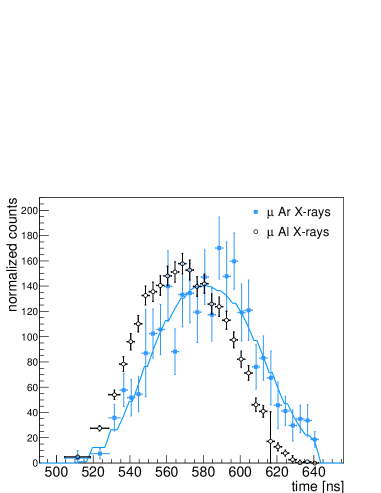
Figure 1 shows the time distribution of X-rays originating from muonic aluminium atoms formed in the vessel (346 keV line) and the X-rays coming from oxygen (133 keV line) and argon (644 keV line). It can be noticed that the aluminium X-ray distribution precedes in time the contaminant X-ray gas distribution. The data for the argon sample were acquired with a smaller statistic, resulting in larger fluctuations. The solid line in figures is a fit to the data, as explained later in this section. The hypothesis that the X-ray time distributions from muonic aluminium and oxygen (argon) are compatible was rejected performing the Kolmogorov test on unbinned data which give zero probability both for oxygen and argon.
The time difference between X-ray distributions from muonic aluminium and the muonic atoms of the gas admixed to hydrogen has also been studied using a GEANT4 simulation of the experimental set-up. The simulation reproduces the structure of the target, the detectors, and space and time distributions of the muon beam. However, the process of muon transfer has not yet been implemented and as a consequence only the timing of the “prompt” X-ray emission can be evaluated.
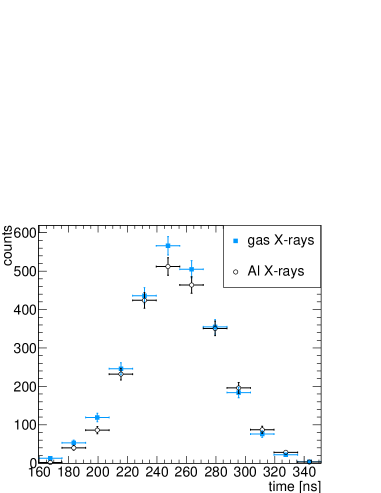
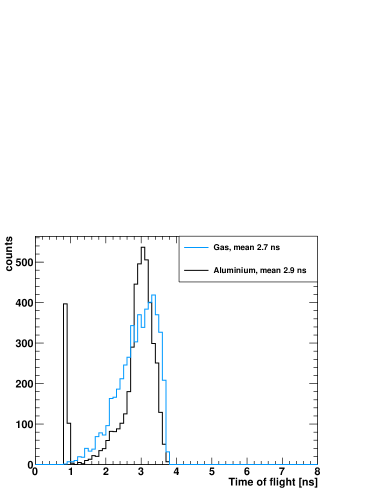
Figure 2, on the left, shows the results of the simulations of the time evolution of muon stopping in the aluminium of the target and in the gas. The distributions are almost overlapping; according to a Kolmogorov test, there is a probability of 83% that the two distribution belong to the same population. The same conclusion can be derived by studying the time of flight of muons before the stop in the gas or in the aluminium, see Fig. 2 on the right, with the mean from the gas distribution at 2.7 ns and the mean from the aluminium distribution at 2.9 ns. The peak at about 1 ns for aluminium corresponds to events stopping in the entrance window. This type of events accounts for only about 10% of the events of muon stop in aluminium. The remaining 90% of muons stops in the lateral walls of the target in a good time coincidence of muons stopping in the gas, blue line in figure. This effect can be explained by observing that the muon beam momentum was tuned at 61 MeV/c. Hence, most of the muons are able to cross the 3 mm thick aluminium entrance window without stopping. Subsequently, they loose energy in the gas till stopping in hydrogen or eventually reaching the aluminium lateral walls from where, according to the simulation, the most part of the aluminium muonic X-rays are coming. The difference between the distributions obtained from the simulation, fig. 2 on the right, can not account for the time difference of about 5–10 ns observed in the real data between aluminium and (argon) X-rays distributions (see Fig. 1). This implies that a physical process like the muon transfer from muonic hydrogen to and argon is responsible for this time difference.
| Gas mixture | terms | Free parameter | Fixed parameters | |
| in eq. 3.2 | ||||
| Transfer rate to | ||||
| Transfer rate to Oxygen | s-1 | |||
| Transfer rate to Argon | ||||
Through a study of the time evolution of the X-ray events coming from the gas, it is possible to determine the average transfer rate in this particular situation, when in the X-ray spectrum contributions from the direct muon capture, muon transfer from excited p atoms [10], and from the ground-state p atoms coexist. The prompt aluminium signal from the target material (345 keV line) was chosen as a time reference. In the case of as contaminant in the gas, Eq. 3.2 becomes , where and are the oxygen and carbon atomic concentrations respectively (with ) and , are the corresponding transfer rates. Since in the condition of this measurement the transfer rates to oxygen and carbon are unknown, it was decided not only to evaluate a single average transfer rate to the molecule () but also to evaluate the transfer rate to oxygen by using a fixed value of . In this latter case we used s-1 from [11, 12] and the disagreement with other measurements [13] was considered in the estimation of systematic errors. In the case of argon a single transfer rate was evaluated. Gas parameters depend on the composition, temperature, and pressure as described below, and are summarized in Table 1; values were set as follows:
-
•
filling was performed at “room temperature” K, at a pressure bar, with concentration of %, mass weighted, and at room temperature K, at a pressure bar, with a concentration of % mass weighted, for argon;
-
•
the number densities of the gas mixtures are and in LHD atomic units, as derived from previous values;
-
•
the atomic concentrations of carbon and argon are derived from previous values; the deuteron concentrations
and were derived from a laboratory measurement [14]; - •
A fit of the (oxygen and carbon), oxygen, and argon X-rays time evolution can be performed numerically integrating Eq. 3.1 by leaving , , and as free parameters. We considered the X-ray lines from carbon and from oxygen when evaluating , the from oxygen for , and from argon for . The fit to the data is shown as solid lines in Fig. 1 for oxygen and argon. The step-like behaviour is due to the numerical integration procedure used to calculate the function for each time bin. The reduced of the fit is about 1.6 for oxygen and 0.7 for argon. However, for oxygen, it can be noticed that there is a significant deviation of the fit with respect to the data around 240 ns that could be ascribed to unaccounted contribution to the transfer rate from excited muonic hydrogen states.
| [Units: s-1] | oxygen | argon | |
|---|---|---|---|
| Transfer rate | |||
| Sytematic errors breakdown | |||
| Timing (Sec.4.1) | |||
| Background (Sec.4.2) | |||
| Method (Sec.4.3) | |||
| Temperature (Sec.4.4) | |||
| Concentration (Sec.4.5) | |||
| (Sec.4.6) | n/a | n/a | |
The measured transfer rate to , oxygen and argon are reported in Table 2. Statistical errors are smaller than estimated systematic errors (summed in quadrature). A description of systematic errors evaluation is reported in section 4. Due to the experimental condition, the mean kinetic energy of the muonic hydrogen cannot be determined precisely. The whole energy range between the mean kinetic energy of thermalized gas (0.038 eV at 300 K) and the mean kinetic energy (10 eV) of the sum of the two Maxwellians described previously [8] should be considered.
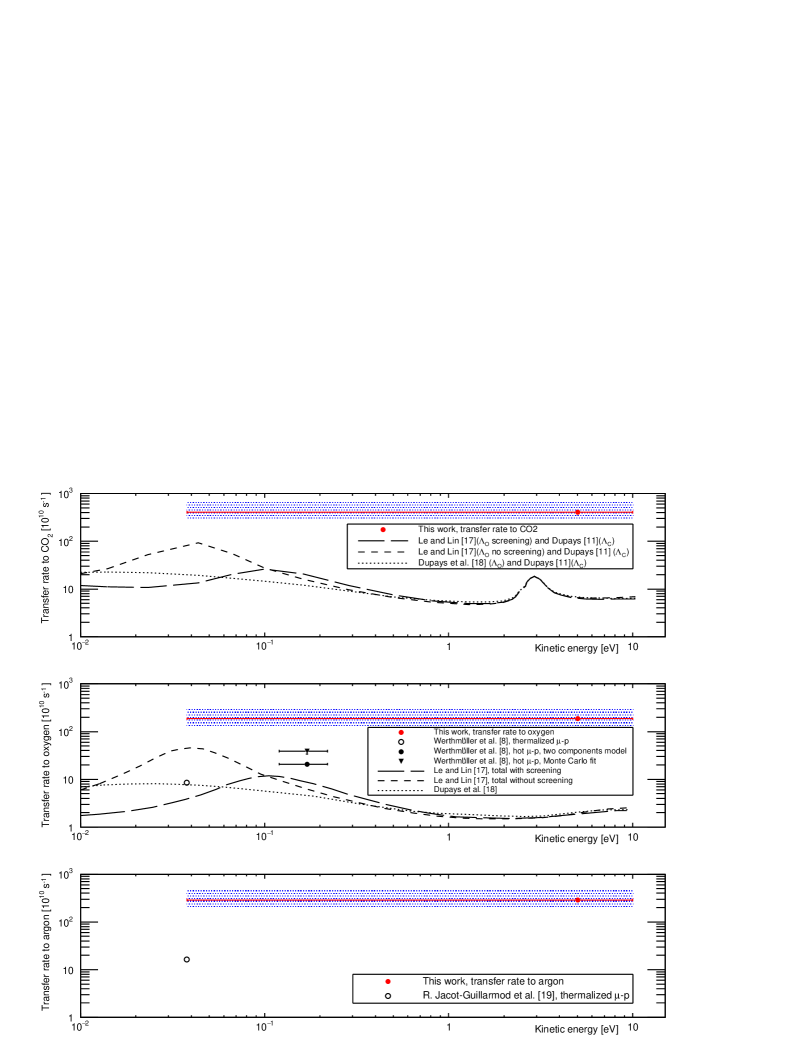
Figure 3 shows our results together with previous measurements and theoretical calculation. In the top panel, our result is compared to theoretical calculations obtained by combining transfer rate to oxygen [18, 19] and to carbon [12] in the proportion of 2:1. The transfer rate to oxygen estimated by fixing the muon transfer rate to carbon is shown in the middle panel. Results from other measurements obtained at PSI are shown. Open circles represent measurements made in thermalized conditions at 300 K. Values denoted by black symbols were derived in non-thermalized conditions (“hot” p), evaluated using the “two components” model and the “three exponential model” using a Monte Carlo to determine the best set of parameters [8]. The dotted lines show theoretical calculations obtained using a computational method to study three-body rearrangement processes [19]. Dashed lines represent other theoretical calculations of the transfer rate to oxygen obtained by taking or not into account the Thomas-Fermi screening in oxygen [18]. The bottom panel of Fig. 3 shows the result obtained for argon together with a previous measurement [20] obtained with thermalized p.
As described previously, our measurement taken with not-thermalized p implies a wide range of possible energy distributions of which it is not possible to experimentally estimate an average. The full kinetic energy range has been reported in figures as horizontal “error bars”. Where not visible, statistical errors are included in the points. Colored bands show the estimated systematic uncertainties described in the following section.
The value extracted from our measurement of the transfer rates is larger than previous experiments and of the theoretical calculation and could be interpreted as an upper limit. Since the current experimental setup was not devoted to the transfer rate measurement, these results can be influenced and increased by effects such as the high level of epithermicity, the presence of a prompt component in the X-rays distribution and a contribution from muon transfer from excited states of the p atoms. It is worthwhile to notice that the order of magnitude of the obtained average transfer rates agrees with the semi-classical calculations for the transfer from the 2S state of p atoms [21].
4 Estimation of systematic uncertainties
The accuracy of this measurement is limited above all by the systematic uncertainties, an effect of the conditions under which it was performed. Estimation of systematic errors was performed using the muonic oxygen lines. Uncertainties on the transfer rates to and argon were extrapolated from this study.
4.1 Timing of signals
This measurement of the transfer rate to oxygen is performed by comparing the time evolution of muonic X-ray from aluminium and oxygen. The concentration being very high (4% by weight), the transfer happens faster than thermalization and the time evolution of X-rays spectrum of aluminium and gas are very close and nearly in coincidence with muon arrival. Consequently, any uncertainty in the time measurement has a great impact on the measurement. Since both signals are measured simultaneously with the same setup, there is no reason to assume an experimental systematics in absolute time measurement. However, according to the simulation, there is a difference of 0.2 ns between the X-ray time arrival from the gas and from the aluminium, with gas X-rays arriving earlier as explained in previous section. The simulated results can be biased by the following issue: the muon transfer physical mechanism is not included in GEANT4 and the beam profile and divergence used in the simulation have been obtained by RIKEN specialists using a different setup and positions with respect to the FAMU target. According to the simulation, the time difference between the mean of the aluminium and oxygen/carbon X-rays time distributions can vary up to 2 ns when taking into account the uncertainties in the beam profile and divergence, the beam momentum, the position of the target respect to the beam pipe, the position of the detector with respect to the target.
The effect of such a variation has been tested on the real data by artificial shifting the average of the aluminium distribution in time by 2 ns. The transfer rate obtained fitting the shifted data was used to estimate the systematic uncertainty, reported in Table 2.
4.2 Background subtraction
In order to obtain the number of X-ray events for each time bin, it is necessary to subtract the background below the X-ray carbon, oxygen, and aluminium lines. Background can be determined using spectroscopic algorithms embedded in ROOT [22], parametrizing with exponential functions the region close to the peaks or by comparing the energy spectra obtained with pure hydrogen in the target with the one with contaminant. The last method was used to obtain the final results, while the other two were used to study how the result varies when changing the background estimation method. Moreover, the normalization of the background introduces small fluctuations in the total number of observed events that count as systematic effects. The estimated background subtraction systematic is of the order of 16%.
4.3 Systematics of the method
Since the transfer time is much smaller than the time interval between the two beam pulses, the fitting procedure of the time evolution explained in the previous section can be applied twice for each trigger. We noticed that, also depending on the background signal subtraction method, the obtained results differ more than the statistical fluctuations. Hence, the difference between the results extracted from the two subsequent muon beam peaks has been treated as systematic error intrinsic to the method.
4.4 Temperature
The 2014 FAMU target was not equipped with temperature sensors and the temperature of the gas during filling cannot be precisely determined. The best estimate of the room temperature is 2935 degrees Kelvin. Different temperature of the gas during the filling procedure implies a different gas density . By propagating the five degrees temperature uncertainty on we re-fitted the time evolution. A temperature variation of five degrees corresponds to a variation of the result of about 2%.
4.5 Concentration of gas mixture
The gas used were high purity gases, 99.9995 and 99.9999% pure, corresponding to a contamination of other gases smaller than 5 and 1 ppm respectively. The simulation proved that such a contamination implies negligible effects in our results. However, the gas mixture was prepared by the gas supplier by weight with a relative error of 3%. Propagation of this uncertainty in the fitting formula brings both different atomic concentrations and gas densities. The overall effect on the final measurement is of about 3%.
4.6 Other systematics
When measuring the transfer rate to oxygen it is necessary to fix the value of the transfer rate to carbon, our measurement was obtained with s-1. Since there are conflicting experimental results [11, 13], and since the theoretical calculation shows a variation of the transfer rate to carbon as function of the kinetic energy, we varied between and s-1. This results in a relative difference of 1.5 and 2% respectively in the transfer rate. This difference is included the systematics of the oxygen measurement, Table 2.
Other systematic uncertainties were investigated and were considered negligible if their effect was smaller than 1%. The following items were proved to have negligible effects on the final measurement:
-
•
literature error in the muon decay time (proton-bounded) ;
-
•
literature error in the transfer rate to molecule ;
-
•
error in the transfer rate to deuterium ;
-
•
error in the isotopic composition of hydrogen gas ;
-
•
error in the target pressure measurement;
-
•
effect of the target composition alloy (Al6061) which is a mixture of mainly aluminium with a small component of Mg, Si and other heavier elements (studied using the simulation).
Other consistency checks were also performed on data by selecting separately and the other lines and by studying energy and time spectra obtained using the empty target and a carbon sample.
5 Conclusions
The data analysis described here is evidencing the quality of our experiment’s detection system and of the muon beam characteristics available at the PORT-4 of the RIKEN-RAL facility.
We have given a detailed description of the approach to the studies of the signal and of the background noise that have lead to significant results on muon transfer rate. The first results reported in a previous paper [2] showed a very promising situation for the subsequent steps. In the present work we have performed a further analysis of those data with the intent of extracting the transfer rate although to this end the experimental conditions are far from favorable, demonstrating in this way the reliability of detection system and of the analysis method.
The study has been carried on to test the capabilities of the target and detectors and to estimate the source of systematic errors in this type of measurement. Through a careful analysis it was possible to extract a value for the muon transfer rate from hydrogen to , oxygen, and argon. The expectations, given the experimental condition where the transfer arises very quickly well before any thermalization of the muonic hydrogen, are confirmed.
The found transfer rates are higher than what has been previously measured due to a highly variable level of epithermicity and to the possible presence of a fraction of prompt component in the muonic X-rays spectra and where a contribution of the muon transfer from p atoms excited states could also play a role.
These results further demonstrate the possibility to perform high precision measurements at the high quality muon beams of the RIKEN-RAL facility. The next precision measurement of the transfer rate from muonic hydrogen to nuclei of higher Z will be performed using a temperature-stabilized cryogenic hydrogen gas-target with optimized concentrations of admixed gas.
Acknowledgments
The research activity presented in this paper has been carried out in the framework of the FAMU experiment funded by Istituto Nazionale di Fisica Nucleare (INFN). The use of the low energy muons beam has been allowed by the RIKEN RAL Muon Facility. We thank the RAL staff (cooling, gas, and radioactive sources sections) and especially Mr. Chris Goodway, Pressure and Furnace Section Leader, for their help, suggestions, professionality and precious collaboration in the set up of the experiment at RIKEN-RAL port 4.
We gratefully recognize the help of T. Schneider, CERN EP division, for his help in the optical cutting of the scintillating fibers of the hodoscope detector and the linked issues and N. Serra from Advansid srl for useful discussions on SiPM problematics.
We thank our colleagues Chiara Boschi and Ilaria Baneschi (IGG, CNR Pisa) for their help in the measurement of the gas isotopic composition.
A. Adamczak and D. Bakalov acknowledge the support within the bilateral agreement between the Bulgarian Academy of Sciences and the Polish Academy of Sciences. D. Bakalov, P. Danev and M. Stroilov acknowledge the support of Grant 08-17 of the Bulgarian Science Fund.
References
- [1] R. Pohl et al., The size of proton, Nature 466 (2010) 2013.
- [2] A. Adamczak et al., Step towards the hyperfine splitting measurement of the muonic hydrogen ground state: pulsed muon beam and detection system characterization, J. of Inst. 11 (2016) P05007.
- [3] A. Werthmüller et al., Transfer of negative muons from hydrogen to oxygen, Hyp. Interact. 103 (1996) 147.
- [4] T. Matsuzaki et al., The RIKEN-RAL pulsed Muon Facility, Nucl. Instr. Meth. A 465 (2001) 365.
- [5] M. Bonesini et al., The construction of the Fiber-SiPM beam monitor system of the R484 and R582 experiments at the RIKEN-RAL muon facility,J. of Inst. 12 (2017) C03035.
- [6] N. C. Mukhopadhyay, Nuclear muon capture, Phys. Rep. 30 (1977) 1.
- [7] D. Bakalov et al., Theoretical and computational study of the energy dependence of the muon transfer rate from hydrogen to higher–Z gases, Phys. Lett. A 379 (2015) 151.
- [8] A. Werthmüller et al., Energy dependence of the charge exchange reaction from muonic hydrogen to oxygen, Hyp. Interact. 116 (1998) 1.
- [9] S. Agostinelli et al., Geant4 – a simulation toolkit, Nucl. Instr. Meth. A 506 (2003) 250.
- [10] Y.A. Thalmann et al.,Muon transfer from excited states of hydrogen and deuterium to nitrogen, neon, and argon. Phys. Rev. A 57 (1998) 1713.
- [11] S. G. Basiladze et al., Eksp. Teor. Fiz. 49 (1965) 1042 [ Sov. Phys. JETP 22 (1966) 725].
- [12] A. Dupays Muon transfer from muonic hydrogen to carbon. Phys. Rev. A 72 (2005) 054501.
- [13] L. Schellenberg et al., Muon Transfer with a New High Pressure Gastarget, Muonic Atoms and Molecules, edited by L. A. Schaller and C. Petitjean (Birkhauser-Verlag, Basel) (1993) 187.
- [14] C. Boschi and I. Baneschi, CNR Internal Report (2016), unpublished.
- [15] V. A. Andreev et al., Measurement of the formation rate of muonic hydrogen molecules, Phys. Rev. C 91 (2015) 055502.
- [16] C. Chiccoli et al., The Atlas of the Cross Sections of Mesic Atomic Processes, Muon Catal. Fusion 7 (1992) 87.
- [17] T. Suzuki, D. F. Measday, J. P. Roalsvig, Total nuclear capture rate for negative muons, Phys. Rev. C 35 (1987).
- [18] Anh-Thu Le and C. D. Lin, Muon transfer from muonic hydrogen to atomic oxygen and nitrogen, Phys. Rev. A 71 (2005) 022507.
- [19] A. Dupays et al., Nonzero total-angular-momentum three-body dynamics using hyperspherical elliptic coordinates: Application to muon transfer from muonic hydrogen to atomic oxygen and neon. Phys. Rev. A 69 (2004) 062501.
- [20] R. Jacot–Guillarmod et al., Muon transfer from thermalized muonic hydrogen isotopes to argon, Phys. Rev. A 55 (1997) 3447.
- [21] G. Fiorentini and G. Torelli, Muon transfer to heavy atoms: A probe for the study of the ( p)2S system Il Nuovo Cimento 36 A (1976) 317.
- [22] R. Brun and F. Rademakers, ROOT - An Object Oriented Data Analysis Framework, Nucl. Inst. & Meth. in Phys. Res. A, 389 (1997) 81. See also http://root.cern.ch/.