A Simple and Realistic Pedestrian Model
for Crowd Simulation and Application
Abstract
The simulation of pedestrian crowd that reflects reality is a major challenge for researches. Several crowd simulation models have been proposed such as cellular automata model, agent-based model, fluid dynamic model, etc. It is important to note that agent-based model is able, over others approaches, to provide a natural description of the system and then to capture complex human behaviors.
In this paper, we propose a multi-agent simulation model in which pedestrian positions are updated at discrete time intervals. It takes into account the major normal conditions of a simple pedestrian situated in a crowd such as preferences, realistic perception of environment, etc. Our objective is to simulate the pedestrian crowd realistically towards a simulation of believable pedestrian behaviors. Typical pedestrian phenomena, including the unidirectional and bidirectional movement in a corridor as well as the flow through bottleneck, are simulated. The conducted simulations show that our model is able to produce realistic pedestrian behaviors. The obtained fundamental diagram and flow rate at bottleneck agree very well with classic conclusions and empirical study results. It is hoped that the idea of this study may be helpful in promoting the modeling and simulation of pedestrian crowd in a simple way.
Index Terms:
Microscopic multi-agent model, pedestrian crowd simulation, semicontinuous pedestrian model.1 Introduction
Pedestrian crowd is a phenomenon that can be observed in several situations such as in the street, intersection, square, etc. A number of researchers have been interested in studying this phenomenon. In fact, when the density of the crowd is high, several accidents and disasters could occur. More the crowd becomes dense, more the situation is dangerous. Therefore, researchers face an increasing challenge to find solutions that seriously improve pedestrian management and safety during crowd. In such a context, simulation is an appropriate tool. It could be really interesting to be able to simulate pedestrian movements in such environments.
For this purpose, several crowd simulation models have been proposed. These models are generally classified into two categories [1]: macroscopic models that include regression models and flow dynamic models, and microscopic models including cellular automata models and agent-based models. Each model can be specifically categorized into continuous, discrete, and semicontinuous according to the space and time of the system. The macroscopic approaches simulate the behavior of the crowd as a whole and do not consider individual features. However, the microscopic approaches are interested in the behaviors, actions, and decisions of each pedestrian as well as interactions with others [2]. Therefore, the microscopic models allow us to obtain more realistic results of simulation. This is why we will focus only on microscopic models and more specifically on agent-based models. In fact, the agent-based models are able, over others approaches, to be flexible, to provide a natural description of the system, and to capture complex human behaviors [3].
In this paper, a semicontinuous pedestrian model is developed in which the space occupied by pedestrians is continuously evolving, but time is measured by intervals. It is worth noting that each pedestrian in the proposed model is regarded as a self-adapted agent, and the movement is implemented in a utility maximization approach by considering various human factors. The model is able to calculate normal pedestrian distributions in space and pedestrian movements at normal step frequencies over time. The goal of our work is to model realistic pedestrian crowd by simulating realistic pedestrian behaviors. Face this challenge; we need to carefully study human nature such as preferences, realistic perception of environment, etc. Rules governing the selection of step size and moving direction guarantee that the model can be used to accurately compute the distance and speed of pedestrian movement. In the model, pedestrians are not treated as particles, and the sizes of their bodies are considered. The model is thus suitable for simulating the movements of dense crowds.
The rest of our paper is as follows: section 2 describes related works. In section 3, we propose our system model which takes into account the various human nature factors. Section 4 presents our simulations and a discussion of the work. Finally, we conclude the paper and give perspectives in section 5.
2 Related Works
There are several crowd simulation models which can be classified into two categories: macroscopic models and microscopic models. Macroscopic approaches include regression models [4] and flow dynamic models [5, 6]. Microscopic approaches include cellular automata models [7, 8, 9] and agent-based models [3, 10, 11, 12, 13, 14]. The macroscopic approaches simulate the behavior of the crowd as a whole. In fact, macroscopic models do not consider individual features such as physical abilities, direction of movement, and individual positioning [15]. This causes a lack of realism. On the other hand, the microscopic approaches are interested in the behaviors, actions, and decisions of each pedestrian as well as interactions with others [2]. Therefore, the microscopic models allow us to obtain more realistic outputs of simulation. For this reason, in our work, we adopt a microscopic approach. Among the specific categories of the microscopic systems, we focus on semicontinuous multi-agent model in which pedestrian space is continuous, and pedestrian positions are updated at discrete time intervals. In the following, we describe the major microscopic models.
2.1 Cellular Automata Model
A cellular automaton [7, 8, 9] is a collection of cells on a grid. Each cell contains a state chosen among a finite set and can change over time. The pedestrian transitions from one state to another consist firstly on the awareness of the environment and secondly on the possibility to move to the state of its neighboring cells. Finally, the transitions of states are executed. The change of cell state is based on a set of rules that are applied simultaneously to all grid cells, producing a new generation of cells which depends entirely on the previous generation.
Cellular automata model is a simple and fast implementation, but criticized for lacking realism. In fact, this model limits the pedestrian spatial movement like a checkerboard. Another limitation of cellular automata is the difficulty to model changing pedestrian velocities and to simulate heterogeneous pedestrian behaviors.
3 System Model
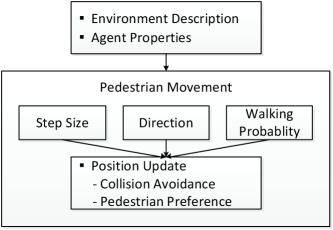
Our system is based on a semicontinuous microscopic approach and particularly in a multi-agent architecture, in which each pedestrian moves a certain step size in the moving direction at each discrete time instant. The overview of system architecture is displayed in Fig. 1. The description on the environment and the properties of the agents are required as inputs for the system. The pedestrian movement is represented as step size, direction, and walking probability, which are used to update the position of a pedestrian. In the model, a rule of determining step size and movement direction has been used to avoid pedestrian overlapping each other, and the design of the pedestrian behavior is based on the perception of the environment. This combination has allowed us to obtain a simple and realistic pedestrian model for crowd simulation. In our model, each pedestrian is represented by an agent, who is required to move step by step toward the goal while adjusting the step size and moving direction according to the environment and avoiding collisions with other pedestrians and obstacles. The pedestrian agent at time is characterized by:
-
•
Step size: The actual step size of an agent is defined as with step scale factor and desired step size of .
-
•
Direction: The possible moving direction is described by with direction shift factor and desired direction of .
-
•
Position: The environment of our system is indexed by a Cartesian coordinate system as . Thus, a position is defined as the pair of coordinates in the Cartesian coordinate system.
Each agent has its own autonomous behavior. Indeed, the behavior of a pedestrian agent is divided into three phases: strategic phase, tactical phase, and operational phase.
3.1 Strategic Phase
At each time step , we consider that a pedestrian agent moves through a given environment, which represents for street, intersection, square, etc. Being in the environment, the agent has to follow a well defined direction. The agent objective is to move away by minimizing interactions with other pedestrians and maximizing its utility. In other words, the aim of each agent is to walk at the desired step size and direction, minimizing time travel.
Strategic phase defines the global plan of a pedestrian agent. In fact, the global plan is the set of step size and moving direction that the pedestrian has to take in each time interval. This set of step size and moving direction allows the pedestrian agent to reach its final goal. At the present, the strategic plan is given to each pedestrian agent in the beginning of a simulation. In our work, we focus more on the tactical and the operational phases as follows.
3.2 Tactical Phase
The tactical phase represents searches for possible positions to move. These searches are taken at each instant after the global plan is set up. The searches taken are based on the position update function, which is detailed in the following. If the pedestrian determines moving direction , it will try to move a step size in that direction. Due to other pedestrians or obstacles, there could be the case that movement to the desired position seems to be difficult. For this kind of cases, step scale factor and direction shift factor are needed to be considered. Here, the position update function is formulated as
| (1) |
where the walking state factor is defined as
| (4) |
with the walking probability of . Through this position update function, the position update process from time to can be derived as
| (5) |
where and are the current and the next positions of the pedestrian. The corresponding set of candidate movement position can be expressed as
| (6) |
where and . Here we set the constraint since pedestrians do not choose to move in the opposite direction to the main crowd flow, even if the direct way subsequently chosen is crowded [16].
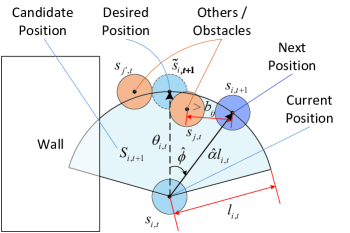
The current position and candidate position set of a pedestrian are shown in Fig. 2, for example. In the figure, the pedestrian, which is denoted by the blue circle, is moving in the desired position from the current position . The candidate position set is depicted as shaded area with sky-blue, in which pedestrian can move or remain stationary. The pedestrians in our system are represented by circles because circles will greatly benefit from geometrical calculation in programming.
3.3 Operational Phase
The operational phase describes decisions taken by pedestrian agent to reach the goal at each time after tactical phase. In the operational phase, the pedestrian agent determines the step size and moving direction suited to avoid people and obstacles. The decisions taken are based on the perception of the environment where the pedestrian agent is situated. These criteria of decisions are detailed in the following.
3.3.1 Collision Avoidance
In reality, each pedestrian occupies a certain space area. Thus, avoiding pedestrian overlapping is needed to be considered in microscopic pedestrian models. By the overlapping, we mean pedestrians are not allowed to either walk through each other or share the same space. This assumes that the movement of a pedestrian is affected by other pedestrians and obstacles in the surrounding environment.
Here, one rule of collision avoidance, which is used to avoid pedestrian overlapping, is proposed. In order to avoid collisions, the positions of other members in the crowd and those of obstacles should be excluded from the candidate position set. The positions of other people in the collision with the pedestrian at time can be expressed as
| (7) |
where from the and pedestrians’ body sizes of and , respectively. The body size means the diameter of a pedestrian, which makes certain distances among pedestrians and obstacles. The collision positions by other members in the crowd can be specifically divided into the two parts: body and rear. The positions in collision with the bodies can be described by
| (8) |
and the positions in the rear of bodies can be explained by
| (9) | |||||
where the corresponding sets of distances, directions, and angular differences are
| (10) | |||||
| (11) | |||||
and
| (12) |
respectively. The function is defined in mathematical term as
| (13) |
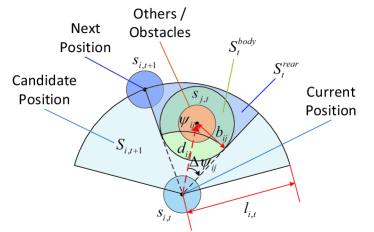
The resultant collision positions by other people can be defined as the union of two sets as . The process of above collision avoidance with other members in the crowd is elaborated in Fig. 3. The collision positions by obstacles and walls can be derived in a similar manner.
As a result, the positions incurring collisions can be represented by
| (14) |
and the candidate position set with collision avoidance is accomplished through the set difference as
| (15a) | |||||
| (16a) | |||||
| (17a) |
where and are corresponding modified sets of and , respectively. In this way, the overlapping positions with other pedestrians and obstacles can be eliminated in the candidate position set.
3.3.2 Pedestrian Preference
To have a realistic simulation of a crowd, we must understand the behavior of a pedestrian which has preferences for choosing the way of walking. A pedestrian normally chooses the fastest way to achieve its goal. In other words, if there are many possibilities, the pedestrian chooses the straightest way, with the minimum of changing direction, the most attractive and the less noisy. This is called “law of minimal change” [17]. Besides, a pedestrian typically prefers not to take detours.
Generally, individuals move according to the principle of “least effort” [2]. They choose the most familiar and the easiest one to achieve their goals. They aim to minimize time and costs by avoiding congestion and by maximizing their step size. If there is enough time to achieve the goal, a pedestrian chooses to walk at individually desired step size, corresponding to its most comfortable walking speed which is called “least energy-consuming” [2].
Here, one rule of determining pedestrian step size and moving direction is proposed, which is used to maximize pedestrian utility. At each time step , the positions of all pedestrians are updated synchronously. The process of selecting the position to move in the candidate position set avoiding collision is formulated as
| (18) |
where and are the step scale factor and direction shift factor maximizing following utility function,
| (19) |
with the weighting factors and on step scale and direction shift, respectively. The weighting factors, , describe the rate of pedestrian preference on maximizing step size and minimizing direction change. The resultant next position to move is shown as a circle with dark blue in Fig. 2 and Fig. 3, for example. In this way, the repulsive actions imposed by surroundings will be strong when a pedestrian closes to other ones or obstacles very much in movement direction.
Through the collision avoidance and pedestrian preference, pedestrians do not overlap each other after the position update at each time interval, although they could move a very small step size, even close to zero. In other words, their further close at the next time step is prevented, and the overlapping among them could be avoided.
In our model, the maximum movement range of a pedestrian in each time instant is limited, and hence the other pedestrians and obstacles in the range only affect the movement position of the pedestrian. It is very essential to say that in a crowd situation, generally, the pedestrian is not spontaneous regarding his behavioral strategy. This is why, the pedestrian tries to have the optimal behaviors avoiding the collision with the people around and follows the person in front [2].
4 Simulation Results and Discussion
We perform Matlab simulations using the proposed model under two scenarios, i.e., corridor and bottleneck. In the last decades, by means of experiment or modeling, researchers have carried out a large number of studies that focus on pedestrian behavior and movement characteristic, and they have obtained many landmark achievements. For example, the fundamental diagram and the flow rate at bottleneck are considered as the main microscopic observables that characterize pedestrian dynamics in normal state [18, 19, 20, 21, 22, 23, 24, 25, 26, 27]. To validate the proposed model in this paper, several simulations are conducted, and then simulation results will be compared with some classic conclusions and published empirical data provided by other literature.
4.1 Fundamental Diagram
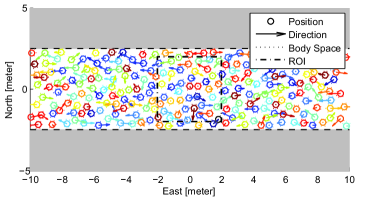
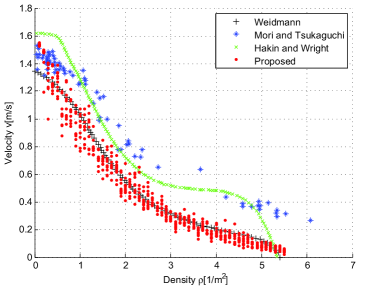
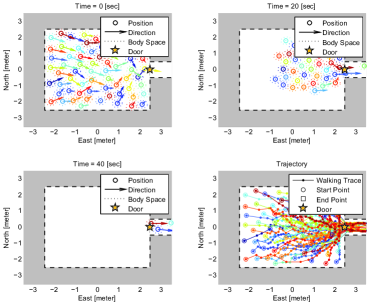
As shown in Fig. 4, we conduct a simulation in a corridor where each unidirectional pedestrian moves according to the proposed system. Several studies have investigated the fundamental diagram [18, 19, 20, 21, 22, 23] and suggest that the density-speed relation and the density-flow relation are two of the most important benchmark tests for crowd simulation. Hence, we validate our model from the viewpoint of the density-speed relation. In general, different density and velocity calculation methods can be used for pedestrian model [28]. These methods are basically consistent with on another. In this paper, a square area is selected as the region of interest (ROI) to extract the data as in Fig. 4. In other words, only the data on pedestrian movement in the ROI are considered. When a pedestrian on one of the two walkways moves in the desired direction and arrives at the exit boundary, then that pedestrian is removed from the walkway. At each time instant, the velocity of a pedestrian is calculated by dividing the step size by the incremental time interval. We iterate simulations ten times at each density and obtain the density-speed relation within ROI, as shown in Fig. 5 (the red dots).
Compared with other experimental data of unidirectional flow [18, 19, 20] it is clear that the simulation result has the same tendency with other density-speed relations. Moreover, the fundamental diagram obtained from our model is very close to that given by Weidmann [18]. It is indeed difficult to choose a standard fundamental diagram to evaluate our fundamental diagram. Many researchers have provided the fundamental diagrams deriving from their own experiments where the underlying data of Weidmann’s fundamental diagram are based on the literature research of publications, including field studies and experiment research. Compared with other researchers’ fundamental diagram, Weidmann’s fundamental diagram may be more comprehensive, and therefore, we compared our diagram with Weidmann’s diagram rather than with other diagrams.
4.2 Flow Rate at Bottleneck
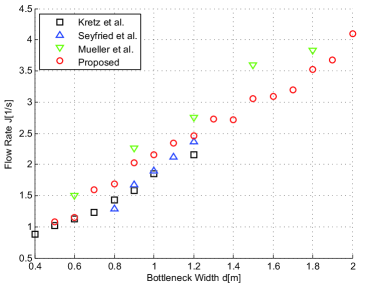
Flow rate in persons per second or the specific flow rate in persons per second per meter at the position of bottleneck is one of the most important parameters for planning and designing facilities, such as a door. Various published field survey results on flow rate were collected from different scenarios. Most of these results suggest that flow rate is nearly in a linear relationship with the width of the bottleneck. In this paper, the pedestrian movement from the room through the door with changeable width at the right boundary is studied as in Fig. 6. The width of the door is tested with different values from 0.5m to 2.0m, and the pedestrian density is set to full capacity to guarantee that the maximum flow rate can be reached at the door.
The maximum flow rates at bottleneck under different door widths are compared with field observation results in Fig. 7 (the red circles). Three different research results are cited here for this purpose, including the laboratory observation data collected by Kretz et al. [24], Seyfried et al. [25, 26], and Muller et al. [27]. The simulation results show consistency with many empirical data provided by other literature, which verifies that the proposed model is applicable to study unidirectional pedestrian model.
5 Conclusion
Pedestrian crowd is a complex phenomena in which several dangerous accident can occur, especially in dense situations. An appropriate solution to this problem is to test the phenomena through the simulation of pedestrian crowd. This solution could be useful only if the simulation model produces realistic pedestrian crowd situations.
For this reason, we present a simple and realistic pedestrian simulation model which is based on multi-agent systems and that includes the major human factors. Agents move a step toward the direction calculated by a utility maximization approach in which various factors that influence pedestrian movement are considered. The system was validated by modeling several basic pedestrian crowd phenomena and comparing the simulation results with published empirical data. The conducted simulations show that the model is consistent with the classic conclusions and published empirical data provided by other literature, and thus it provides realistic simulated pedestrian behaviors. Here, we have concentrated our work only in the behavior of normative personality. We can improve our model by considering different individual personalities.
Acknowledgment
This research was done in 2014, but has not been yet published due to some personal reasons. We decided to release this research to be opened to public accesss now in 2017.
References
- [1] O. Beltaief, S. El Hadouaj, and K. Ghedira, “Multi-agent simulation model of pedestrians crowd based on psychological theories,” in Logistics (LOGISTIQUA), 2011 4th International Conference on. IEEE, 2011, pp. 150–156.
- [2] R. Challenger, C. Clegg, and M. Robinson, “Understanding crowd behaviours,” UK Cabinet office. Crown, 2009.
- [3] E. Bonabeau, “Agent-based modeling: Methods and techniques for simulating human systems,” Proceedings of the National Academy of Sciences of the United States of America, vol. 99, no. Suppl 3, pp. 7280–7287, 2002.
- [4] J. S. Milazzo, N. M. Rouphail, J. E. Hummer, and D. P. Allen, “Effect of pedestrians on capacity of signalized intersections,” Transportation Research Record: Journal of the Transportation Research Board, vol. 1646, no. 1, pp. 37–46, 1998.
- [5] D. Helbing, “A fluid dynamic model for the movement of pedestrians,” arXiv preprint cond-mat/9805213, 1998.
- [6] R. L. Hughes, “The flow of human crowds,” Annual review of fluid mechanics, vol. 35, no. 1, pp. 169–182, 2003.
- [7] S. Wolfram, “Cellular automata as models of complexity,” Nature, vol. 311, no. 5985, pp. 419–424, 1984.
- [8] K. Nagel and M. Schreckenberg, “A cellular automaton model for freeway traffic,” Journal de physique I, vol. 2, no. 12, pp. 2221–2229, 1992.
- [9] C. Burstedde, K. Klauck, A. Schadschneider, and J. Zittartz, “Simulation of pedestrian dynamics using a two-dimensional cellular automaton,” Physica A: Statistical Mechanics and its Applications, vol. 295, no. 3, pp. 507–525, 2001.
-
[10]
N. Gilbert, Agent-based models. Sage, 2008, no. 153.
- [11] X. Pan, C. S. Han, K. Dauber, and K. H. Law, “A multi-agent based framework for the simulation of human and social behaviors during emergency evacuations,” Ai & Society, vol. 22, no. 2, pp. 113–132, 2007.
- [12] G. Antonini, M. Bierlaire, and M. Weber, “Discrete choice models of pedestrian walking behavior,” Transportation Research Part B: Methodological, vol. 40, no. 8, pp. 667–687, 2006.
- [13] N. Pelechano, J. M. Allbeck, and N. I. Badler, “Controlling individual agents in high-density crowd simulation,” in Proceedings of the 2007 ACM SIGGRAPH/Eurographics symposium on Computer animation. Eurographics Association, 2007, pp. 99–108.
- [14] C. M. Macal and M. J. North, “Agent-based modeling and simulation,” in Winter Simulation Conference. Winter Simulation Conference, 2009, pp. 86–98.
- [15] G. K. Still, “Crowd dynamics,” Ph.D. dissertation, University of Warwick, 2000.
- [16] D. Helbing, P. Molnar, I. J. Farkas, and K. Bolay, “Self-organizing pedestrian movement,” Environment and planning B, vol. 28, no. 3, pp. 361–384, 2001.
- [17] K. Nishinari, K. Sugawara, T. Kazama, A. Schadschneider, and D. Chowdhury, “Modelling of self-driven particles: Foraging ants and pedestrians,” Physica A: Statistical Mechanics and its Applications, vol. 372, no. 1, pp. 132–141, 2006.
- [18] U. Weidmann, “Transporttechnik der fussgänger,” 1992.
- [19] M. Mōri and H. Tsukaguchi, “A new method for evaluation of level of service in pedestrian facilities,” Transportation Research Part A: General, vol. 21, no. 3, pp. 223–234, 1987.
- [20] B. Hankin and R. Wright, “Passenger flow in subways,” OR, pp. 81–88, 1958.
- [21] A. Seyfried, B. Steffen, W. Klingsch, and M. Boltes, “The fundamental diagram of pedestrian movement revisited,” Journal of Statistical Mechanics: Theory and Experiment, vol. 2005, no. 10, p. P10002, 2005.
- [22] D. Helbing, A. Johansson, and H. Z. Al-Abideen, “Dynamics of crowd disasters: An empirical study,” Physical review E, vol. 75, no. 4, p. 046109, 2007.
- [23] H. E. Nelson and F. W. Mowrer, “Emergency movement,” The SFPE Handbook of Fire Protection Engineering, vol. 3, pp. 367–80, 2002.
- [24] T. Kretz, A. Grünebohm, and M. Schreckenberg, “Experimental study of pedestrian flow through a bottleneck,” Journal of Statistical Mechanics: Theory and Experiment, vol. 2006, no. 10, p. P10014, 2006.
- [25] A. Seyfried, O. Passon, B. Steffen, M. Boltes, T. Rupprecht, and W. Klingsch, “New insights into pedestrian flow through bottlenecks,” Transportation Science, vol. 43, no. 3, pp. 395–406, 2009.
- [26] A. Seyfried, M. Boltes, J. Kähler, W. Klingsch, A. Portz, T. Rupprecht, A. Schadschneider, B. Steffen, and A. Winkens, “Enhanced empirical data for the fundamental diagram and the flow through bottlenecks,” in Pedestrian and Evacuation Dynamics 2008. Springer, 2010, pp. 145–156.
- [27] K. Müller, “Zur gestaltung und bemessung von fluchtwegen für die evakuierung von personen aus bauwerken auf der grundlage von modellversuchen,” 1981.
- [28] J. Zhang, W. Klingsch, A. Schadschneider, and A. Seyfried, “Transitions in pedestrian fundamental diagrams of straight corridors and t-junctions,” Journal of Statistical Mechanics: Theory and Experiment, vol. 2011, no. 06, p. P06004, 2011.