An experimental and theoretical study
of Ni impurity centers in Ba0.8Sr0.2TiO3
Abstract
The local environment and the charge state of a nickel impurity in cubic Ba0.8Sr0.2TiO3 are studied by XAFS spectroscopy. According to the XANES data, the mean Ni charge state is 2.5+. An analysis of the EXAFS spectra and their comparison with the results of first-principle calculations of the defect geometry suggest that Ni2+ ions are in a high-spin state at the sites of the perovskite structure and the difference of the Ni2+ and Ti4+ charges is mainly compensated by distant oxygen vacancies. In addition, a considerable amount of nickel in the sample is in a second phase BaNiO3-δ. The measurements of the lattice parameter show a decrease in the unit cell volume upon doping, which can indicate the existence of a small amount of Ni4+ ions at the sites.
DOI: 10.1134/S106378341708025X
pacs:
61.05.cj, 61.72.Bb, 61.72.Dd, 77.84.CgI INTRODUCTION
In recent years, ferroelectric oxides with the perovskite O3 structure attract much attention when discussing a possibility of designing various solar energy converters based on these materials. In particular, the idea of practical application of the bulk photovoltaic effect consisting in the appearance of a photocurrent or very high photovoltages upon illumination of homogeneous crystals without an inversion center (including ferroelectrics) Sturman and Fridkin (1992) has been discussed since 1970s. Glass et al. (1974) However, since the quantum yield of this effect was low, the idea was not used in practice. In recent years, the interest to ferroelectric oxides was revitalized due to the appearance of new ideas how to increase the efficiency of solar energy converters based on the bulk photovoltaic effect. Qin et al. (2008); Alexe and Hesse (2011) The main disadvantage of ferroelectric oxides is their comparatively wide energy gap (3 eV), as a result of which they absorb only a small part of solar radiation. To solve this problem, it has long been proposed to dope the oxides with elements Blasse et al. (1981) that in some cases can result in the formation of color centers.
Recent theoretical works showed that the substitution for Ti in PbTiO3 with an impurity having electron configuration (Ni, Pd, Pt) compensated by an oxygen vacancy made it possible to decrease the energy gap of this material. Bennett et al. (2008); Gou et al. (2011) The experimental studies of SrTiO3 doped with a number of elements (Mn, Fe, Co, and Ni) Lebedev et al. (2009); Sluchinskaya et al. (2010, a, b, 2013, 2014) showed that the doping of SrTiO3 results in a strong absorption of light in the visible region and this effect is the most significant for Co and Ni impurities. However, since strontium titanate is not a ferroelectric, we have decided to study a well-known ferroelectric BaTiO3 doped with nickel, believing that its absorption spectrum can be matched to the solar radiation spectrum.
Since nickel is used for fabricating contacts to ferroelectric ceramics, at the first stages of studying nickel-doped barium titanate, the main attention was focused on the determination of nickel solubility in BaTiO3, its influence on the Curie temperature, the dielectric constant, and other properties as well as on the influence of Ni on the transition to a nonpolar hexagonal phase that is stable in undoped BaTiO3 at temperatures above 1460∘C. It was shown that incorporation of Ni decreased the transition temperature to the hexagonal phase; however, the nickel solubility and its concentration needed for this transition were strongly dependent on synthesis conditions and the available data are very contradictory. Glaister and Kay (1960); Huang and Tuan (2007a); Boujelben et al. (2009); Das et al. (2014); Böttcher et al. (2011) It was found that Ni in BaTiO3 acts as an acceptor. Duverger et al. (1994) The doping of barium titanate with nickel decreased the dielectric constant and the Curie temperature and also resulted in a smearing of the ferroelectric phase transition in BaTiO3 as the Ni concentration increased. Huang and Tuan (2007b); Huang et al. (2008); Kumar et al. (2009) The kinetics of the transformation between the cubic and hexagonal phases in BaTiO3 doped with various impurities was studied in Ref. Glaister and Kay, 1960. It was shown that nickel favors the transition to the hexagonal phase, while the doping of BaTiO3 with strontium prevents this transition. In Ref. Huang and Tuan, 2007a, it was noted that BaTiO3 doped with nickel changes its color to dark-brown.
Information on the charge state and the structural position of Ni in BaTiO3 was mainly obtained from the EPR data and is also very contradictory. The lines observed in the EPR spectra were ascribed either to Ni+ ions at the sites Kool et al. (2007) or to off-center Ni+ ions at the sites. Lenjer et al. (2000) In the EPR studies of nickel-doped hexagonal BaTiO3, Böttcher et al. (2011) Ni3+ ions substituting for Ti4+ ions in two different positions (Ti(1) and Ti(2)) were found. However, the concentration of these centers was less than 5% of the nominal amount of nickel; i.e., most of the Ni ions in the sample were in the EPR-inactive state.
In Refs. Lebedev and Sluchinskaya, 2016a, b we studied the charge state of Ni in BaxSr1-xTiO3 by XAFS (X-ray absorption fine structure) spectroscopy and showed that it changed from 4 to 2.5 as the barium content was increased. The first-principle calculations explained this result by different energies of the oxygen vacancy formation in SrTiO3 and BaTiO3. The calculations of the electronic structure of nickel-doped samples revealed the formation of an impurity band in the forbidden gap of BaTiO3 and SrTiO3 and explained the origin of the strong impurity absorption.
In Refs. Das et al., 2014; Langhammer et al., 2016, the appearance of the ferromagnetism in BaTiO3(Ni) ceramic samples at 300 K was observed and explained by the existence of oxygen vacancies Das et al. (2014) or the appearance of metallic nickel precipitates in the ceramics reduced in an Ar+H2 atmosphere. Langhammer et al. (2016) In addition, of interest are the studies of BaTiO3/Ni composites which exhibited interesting multiferroic properties, in particular, the possibility of the magnetization reversal by electric field, Geprägs et al. (2010) and also the works on development of a heterophase material with a very high dielectric constant near the percolation threshold. Pecharromán et al. (2001); Tuan and Chen (2009)
From the literature review it follows that BaTiO3(Ni) is indeed a promising material that can provide an effective solar radiation absorption. Because of this, the purpose of this work is to study the BaTiO3(Ni) samples synthesized in various conditions using X-ray diffraction and other structural methods. Since the doping impurity can enter and sites of the perovskite structure and exist in them in different charge states, Lebedev et al. (2009) we use the XAFS spectroscopy to determine the structural position, the local environment, and the charge state of impurities in BaTiO3.
II SAMPLES, EXPERIMENTAL AND CALCULATION TECHNIQUES
Since the structure of BaTiO3 can be transformed from the cubic to the hexagonal as a result of doping with nickel, and the addition of strontium prevents this transition, Glaister and Kay (1960) 20% SrTiO3 was added to BaTiO3 to retain its cubic structure.
The Ba0.8Sr0.2TiO3 samples doped with 3% Ni were prepared by solid-phase synthesis. The starting components were BaCO3, SrCO3, nanocrystalline TiO2 obtained by hydrolysis of tetrapropylorthotitanate and dried at 500∘C, and Ni(CH3COO)24H2O. The components were weighted in required proportions, ground in acetone, and calcined in air in alumina crucibles at 1100∘C for 4–8 h. The prepared powders were ground again and annealed in air at 1500∘C for 2 h. Then, a part of the samples was additionally annealed at 1100∘C for 8 h, but, as was shown by the measurements, this did not change their properties (the experiment was performed to verify whether the nickel charge state would change as the annealing temperature is changed). To incorporate the impurities into the site, the sample composition was intentionally deviated from stoichiometry to excess Ba. The synthesis of the NiTiO3 and BaNiO3-δ reference compounds was described in Refs. Sluchinskaya et al., 2013, 2014. The phase composition was checked by X-ray phase analysis.
The X-ray absorption spectra were measured in the regions of the extended fine structure (EXAFS) and near-edge structure (XANES) on the KMC-2 station of the BESSY synchrotron radiation source (the electron energy was 1.7 GeV and the maximum current was 290 mA) at the Ni -edge (8333 eV) at 300 K. The radiation was monochromatized by a Si1-xGex(111) double-crystal monochromator. The EXAFS spectra were recorded in fluorescence mode. The intensity of the radiation incident on a sample was measured using an ionization chamber, and the intensity of the fluorescence radiation was measured using a RÖNTEC X-flash silicon energy-dispersive detector with an operating area of 10 mm2.
The EXAFS spectra were analyzed using the widely used IFEFFIT program package. IFE An oscillating EXAFS function was extracted from the fluorescence excitation spectra (where is the X-ray quantum energy) using the ATHENA program. Then, by minimizing the root-mean-square deviation of the experimental curve from the curve calculated for a given model of the local environment of the impurity atom using the ARTEMIS program, the distances and the Debye–Waller factor for the th shell were calculated. Simultaneously, the energy origin correction was also varied. The coordination numbers were taken to be constant and were given by the structural model. The number of the adjustable parameters (9–15) was smaller than the number of independent data points . The dependences of the scattering amplitude and phase, the phase shift of the central atom, and the photoelectron free path on the photoelectron wave vector for all single- and multiple-scattering paths required to build theoretical curves were calculated using the FEFF6 program. FEF An important feature of the ARTEMIS program is the possibility of fitting of the EXAFS spectra to a sum of several independent contributions.
An important feature of this work is that the pure geometric approach characteristic of standard EXAFS data analysis is complemented with the calculations of the geometry and the electronic structure of impurity complexes, which enables us to estimate the physical feasibility of different structural models, and so to increase the reliability of the results.
The geometry and the electronic structure of nickel-doped BaTiO3 were modeled from first principles within the density functional theory using the ABINIT software package. The calculations were performed on 40-atom (simple cubic) and 80-atom (fcc) supercells in which one of the Ti atoms was replaced by a Ni atom (the Ni concentrations were 12.5 and 6.25%, respectively). Since the nickel atom has a partially filled shell, we performed the calculations using PAW pseudopotentials Garrity et al. (2014) and the LDA+ approximation. Anisimov et al. (1997) Parameters eV and eV that describe the Coulomb and the exchange interactions inside the shell were taken from the literature as typical values of these parameters for Ni. It was shown that a variation of these parameters within 20% did not substantially influence the results. The cutoff energy was 30 Ha (816 eV); the integration over the Brillouin zone was performed on a 444 Monkhorst–Pack mesh for the simple cubic supercell or the mesh with equivalent -point density for the fcc supercell. The relaxation of the lattice parameters and the atomic positions in the supercells was stopped when the Hellmann–Feynman forces became less than 10-5 Ha/Bohr (0.5 meV/Å).
The modeling on 40-atom and 80-atom supercells without oxygen vacancies gives the results for the Ni4+ charge state of the impurity. In order to change the charge state to Ni2+, either a vacancy was introduced into the system or we used a trick Postnikov et al. (1998) in which two extra electrons were added to the system. Although, in the latter case, the system was not electrically neutral, the tests showed that the addition of two electrons to the 80-atom supercell of barium titanate results in a small increase in the energy gap width (0.12 eV) and in the lattice parameter (0.61%). However, the obtained density of states and the Ni–O interatomic distances in doped samples were close to those calculated for a model in which the Ni2+ charge state was obtained by adding a distant oxygen vacancy located at distance of 5.8 Å from the Ni atom.
III EXPERIMENTAL RESULTS
III.1 X-Ray diffraction measurements

Fig. 1 shows a typical X-ray diffraction pattern of the samples under study. The Ba0.8Sr0.2TiO3 samples doped with 3% Ni have the perovskite-type cubic structure with the lattice parameter Å at 300 K and were almost single-phase. Small traces of a second phase in the angular range 20–30∘ belong to the Ba2TiO4 compound that often appears in ceramic barium titanate. Comparing the obtained lattice parameter with the lattice parameter of undoped Ba0.8Sr0.2TiO3 solid solution ( Å) shows a slight compression of the lattice which indicates that the impurity incorporated into the sample. The above lattice parameter for the undoped solid solution was obtained by an extrapolation of the data of Ref. McQuarrie, 1955 from the cubic phase to the region, in which the solid solution became tetragonal as a result of the ferroelectric phase transition. The incorporation of nickel to the solid solution decreased the Curie temperature in our samples below 300 K.
III.2 Analysis of the XANES spectra
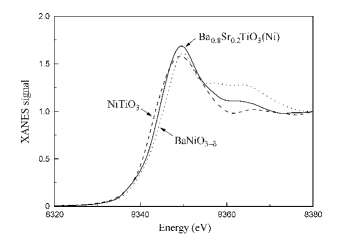
To determine the charge state of the Ni impurity in Ba0.8Sr0.2TiO3, we compared the position of the absorption edge in the XANES spectra of the samples under study with the positions of the edges in the BaNiO3-δ and NiTiO3 reference compounds (Fig. 2). It is seen that the absorption edge in the Ba0.8Sr0.2TiO3(3% Ni) sample is shifted by 0.7 eV from the absorption edge in NiTiO3, where the nickel charge state is 2+, to the absorption edge in the BaNiO3-δ reference compound in which the nickel charge state is 3.4+ (the nickel charge state in this sample was determined in Refs. Sluchinskaya et al., 2013, 2014). From the obtained absorption edge shift (see the discussion in Refs. Lebedev and Sluchinskaya, 2016a, b) it was concluded that the mean charge state of Ni in Ba0.8Sr0.2TiO3(3% Ni) sample is 2.5+. This implies that the most part of the Ni ions in the samples is in charge state 2+ and only small part of them is in charge states 3+ or 4+. Our conclusion agrees with the results of the X-ray photoelectron spectroscopy study Das et al. (2014) in which the main charge state of Ni in BaTiO3 was 2+.
III.3 Analysis of the EXAFS spectra
To determine the structural position and the local environment of the Ni impurity in Ba0.8Sr0.2TiO3, the EXAFS spectra were analyzed. The models of impurity centers were constructed taking into account the charge state of the impurity obtained from the XANES spectra. First, we analyzed the models in which the impurity atom entered either or sites of the perovskite structure with a different local environment. A criterion of agreement between the experimental and calculated spectra was a small value of the factor that quantitatively describes the discrepancy of the compared curves, the closeness of the value of the parameter to the value obtained from the analysis of the EXAFS spectra of the reference compounds, and a visual agreement of the Fourier-transforms of the spectra in the representation.
The EXAFS data analysis of the NiO, NiTiO3, and metallic Ni reference compounds enabled us to determine the value, which was equal to 0.92 for NiTiO3, 0.97 for NiO, and 0.77 for Ni.
An analysis of a model in which the Ni2+ ion enters the site both in the on-center and off-center positions showed that the calculated spectrum on no account can describe well the experimental spectrum (the least value of the factor was 0.408).
For an impurity atom at the site (Ni2+ substitutes for Ti4+), the sample must contain vacancies to provide the electrical neutrality. Thus, we considered two models: the model with an oxygen vacancy located in the first shell of the Ni atom (in this case, the shift of the Ni atom from the site was allowed to be up to 0.5 Å in the direction of the vacancy) and the model with a distant oxygen vacancy and the on-center position of the impurity.
| Adjustable | Site | Ni– | Ni– |
|---|---|---|---|
| parameter | (distant vacancy) | (nearest vacancy) | |
| factor | 0.408 | 0.0741 | 0.0537 |
| 0.896 | 0.774 | 0.889 | |
| (Å) | 2.086 | 2.080 | 2.070 |
| (Å) | 3.120, 3.678 | — | 1.873 |
| (Å) | 2.752 | 3.436 | 3.383–3.499 |
| (Å) | 2.974 | 3.918 | 3.786–3.986 |
A reasonable agreement between the experimental and calculated spectra was obtained in two cases, in which (1) Ni2+ atom substitutes for the Ti4+ atom and there is a distant oxygen vacancy and (2) Ni2+ atom substitutes for the Ti4+ atom and is displaced from the site toward the vacancy located in the first shell. Table 1 gives the interatomic distances to the nearest shells and the values of the factor obtained for these models. It is seen that in the model with a distant vacancy, the Ni–O distances are close to the sum of the ionic radii of the O2- and Ni2+ ions ( Å, Å), so that the XANES and EXAFS data agree well. However, the parameter in this model is underestimated. As for the second model, unfortunately, we did not get a single-valued solution. In addition to the solution reported in Refs. Lebedev and Sluchinskaya, 2016a, b, we found two more possible solutions: one, in which the Ni atom is displaced by 0.1 Å toward the vacancy, and the other, in which the Ni atom is displaced in the opposite direction. Table 1 gives the data for the latter solution which had the lowest factor. The appearance of several solutions with close distances to four atoms and substantially different distances to the fifth atom (2.438, 2.178, and 1.873 Å) is related to the fact that the contribution of a single O(II) atom to the EXAFS function is small, and the nonlinear regression problem can find one of numerous solutions corresponding to a local, not global, minimum.
IV Results of first-principle calculations
The analysis of the experimental data in Sec. III.3 enabled us to propose several structural models that reasonably describe the experimental EXAFS spectrum. To choose the most adequate model, we used the first-principle calculations to model the geometry of a number of impurity complexes containing nickel. In the modeling, particular attention was paid to configurations in which nickel had the charge state 2+, which is closest to that obtained in the experiment.
Although we have not obtained evidences that the nickel atoms enter the sites of the perovskite structure, we considered this case, too. The calculations showed that the on-center position of the Ni2+ ion at the site is unstable. The modeling for an off-center Ni2+ ion at the site showed that this impurity center is diamagnetic and is characterized by nearly square planar configuration (the shift of Ni from the plane of four oxygen atoms is 0.195 Å) and short Ni–O distances (1.867 Å) that do not agree with the experiment.
In the case when a Ni atom enter the site, the simplest case is that in which the nickel charge state coincides with the titanium one (4+). In this case, the electrical neutrality is not violated upon doping, and the defect can be considered as a point defect. The calculations of the geometry of the 80-atom supercell showed that, as a result of relaxation, the distances to the oxygen atoms in the first shell are 1.922 Å. The ion is in the diamagnetic state (). The comparison of the calculated distances with those obtained from the EXAFS data analysis shows their marked difference. So, the geometry of this defect does not agree with that observed in the experiment.
Actually, the local environment of nickel in barium titanate is more complicated, since the impurity charge (2+) found in our experiment suggests that the structure should contain an oxygen vacancy that compensates the difference of the charges of the Ni2+ and Ti4+ ions.
In our calculations, we first assumed that a vacancy in the formed Ni2+– complex is located in the first shell (this structure completely corresponds to the model considered in Ref. Gou et al., 2011). The calculations of the equilibrium configuration of this complex performed on a 80-atom supercell showed that the Ni ion is shifted by only 0.021 Å from the plane formed by four oxygen atoms. The distance to four nearest O atoms in the plane is 1.925 Å and the distance to the fifth oxygen atom is 2.192 Å. The impurity complex is diamagnetic (). A comparison of the calculated interatomic distances with those obtained from the EXAFS data analysis shows that this model also does not agree with the experiment.
| Compound | Charge | Magnetic | (Å) |
|---|---|---|---|
| state | state | ||
| NiO () | 2+ | 2.044 | |
| NiTiO3 () | 2+ | 1.993–2.034 | |
| NiNb2O6 () | 2+ | 1.983–2.014 | |
| BaNiO2 () | 2+ | 1.850 | |
| LiNiO2 () | 3+ | 1.926 | |
| BaNiO3 () | 4+ | 1.849 | |
| SrNiO3 () | 4+ | 1.842 | |
| PbNiO3 () | 4+ | 1.974–2.026 |
Prior to further discussion, we should make an important remark. In all aforementioned models, the distances to the nearest oxygen atoms were close to each other and were slightly dependent on the ion charge. This put us on the idea to perform additional calculations for a number of compounds of two-, tri-, and tetravalent nickel (NiO, NiTiO3, NiNb2O6, BaNiO2, BaNiO3, LiNiO2, SrNiO3, and PbNiO3). The calculation showed that a “long” distance (1.97–2.04 Å) is obtained only when the nickel atom is paramagnetic () (Table 2). As follows from Table 2, the interatomic Ni–O distance is determined primarily by the spin state of the Ni atom rather than by its charge, and so we first should focus our attention on the paramagnetic centers to explain the geometry of an impurity Ni center in BaTiO3.
It turned out that the complexes of the Ni2+ ion with the oxygen vacancy located in the fourth or more distant shell of the Ni atom (“a distant vacancy”) are such centers. We considered three different configurations of the complexes. In the first of them, the vacancy was located at a distance of 1.5 lattice constants along the [001] axis; in the second of them, the vacancy was additionally displaced sideways. In the third configuration, two extra electrons were added to the system (these electrons can be supplied by either oxygen vacancies or donor impurity atoms). The relaxation of the positions of all atoms in these models showed that the mean Ni–O distances in them are 2.038–2.082 Å, in better agreement with the experiment.
V Discussion
As follows from Sec. IV, the interatomic Ni–O distance is determined by the magnetic state of the Ni ion to a greater extent than by its charge state (Table 2). In addition, it was shown that the Ni2+– complex with the nearest vacancy considered in Ref. Gou et al., 2011 is diamagnetic and is characterized by a set of distances that strongly differ from those obtained from the EXAFS data analysis. The Ni–O distance that was observed in the experiment, in our opinion, can be explained by Ni2+ paramagnetic complexes with distant vacancies. However, the analysis performed in Sec. III.3 showed that in this case we are dealing with an underestimated value of (Table 1).
To solve this problem, we considered a number of new structural models. First, we assumed that a part of the Ni atoms in Ba0.8Sr0.2TiO3 is in a higher charge state, which follows from the analysis of the XANES spectra (Sec. III.2). We considered a model, in which the nickel atom is at the site in two charge states simultaneously. We took into account a possible difference in the distances to the nearest oxygen atoms and the difference in the absorption edge energies of the atoms in different charge states. A similar situation can be also observed in a model in which the Ni atoms have the same charge state but different magnetic states ( and 1); such a situation is possible, for example, when the Ni2+ ions form the complexes with the neighboring and distant vacancies simultaneously. The difference of this model from the previous one is only in that the absorption edge energies are considered to be the same in the latter case.
| Adjustable | Model | |||
|---|---|---|---|---|
| parameter | Two spin states, | Two charge states, | Ni2+ at the site and the | Ni2+ at the site and the |
| Ni2+ | Ni4+ and Ni2+ | hexagonal phase precipitates | second BaNiO3-δ phase | |
| factor | 0.0627 | 0.0618 | 0.0288 | 0.00147 |
| The first set of parameters | ||||
| Ni4+ | Cubic phase | Ni2+ | ||
| 0.472 | 0.546 | 0.893 | 0.465 | |
| (Å) | 1.917 | 1.906 | 2.123 | 2.113 |
| (Å) | 3.434 | 3.435 | 3.440 | 3.456 |
| (Å) | 3.915 | 3.911 | 3.972 | 3.972 |
| The second set of parameters | ||||
| Ni2+ | Hexagonal phase | Phase BaNiO3-δ | ||
| 0.593 | 0.781 | 0.165 | 0.377 | |
| (Å) | 2.097 | 2.088 | 2.064 | 1.899 |
| (Å) | 3.434 | 3.435 | 3.465–3.574 | 2.416 (Ni–Ni)∗ |
| (Å) | 3.915 | 3.911 | 3.919 | 3.512 (Ni–Ba)∗ |
∗ The interatomic distances and corresponding atoms in the BaNiO3 structure.
The results obtained from the analysis of these models are given in Table 3. Although these models describe the experimental curve quite reasonably, we again encounter an underestimated value of .
Lastly, the last group of the models were the models that admit the existence of the second phase precipitates in the samples. The first of them was a model in which the cubic Ba0.8Sr0.2TiO3(3% Ni) phase and microprecipitates of the hexagonal BaTiO3(Ni) phase coexist. Both variants of incorporation of nickel into the hexagonal phase (Ni at the Ti(1) and Ti(2) sites) were analyzed. Although these models gave a reasonable agreement for a sum of parameters of both the phases, the values of the factor characterizing the agreement between the curves were not quite low. The parameters for the model with nickel at site Ti(1) are given in Table 3.
Then we analyzed the models in which the samples were supposed to contain microinclusions which could appear at the grain boundaries in our ceramic powders and which are hardly detected using X-ray diffraction (X-ray amorphous phase). We considered the variants of inclusions of NiTiO3, NiO, metallic Ni, and the BaNiO3-δ compound. An analysis of the EXAFS spectra showed that the variants with inclusions of NiTiO3, NiO, and metallic Ni very insignificantly improved the agreement between the calculated and experimental EXAFS spectra since the fraction of the second phase was from 0.001 to 0.017, i.e., it was close to zero (the parameters describing the local structure of the second phase were taken from the EXAFS data analysis of pure individual phases). In these models the factor was about 0.066.
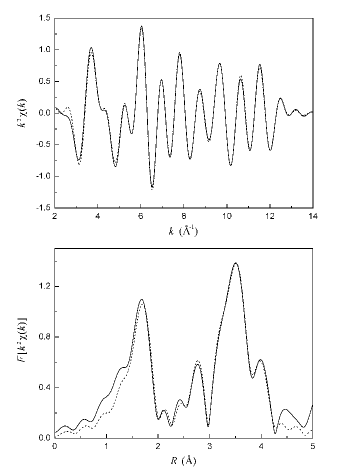
The best agreement between the calculated and experimental spectra was obtained for a model in which the second phase is BaNiO3-δ. For this model, the factor decreased by more than one order of magnitude as compared to that for the models considered above (Table 3). Fig. 3 shows a typical EXAFS spectrum for Ba0.8Sr0.2TiO3(3% Ni) and its Fourier transform , which are compared to the results of calculations within this model. Unfortunately, a strongly defective structure of BaNiO3-δ, whose composition () depends on the temperature and partial oxygen pressure during its synthesis, made it impossible to use the experimental EXAFS spectra in the analysis. Because of this, the structure of BaNiO3-δ was modeled from first principles using the structural model of BaNiO3. The results of the fitting are given in Table 3. The most important in this model is that the value of finally became close to the values obtained for the reference compounds. Taking into account that the second phase is formed by an individual nickel compound and the main phase is the solid solution with a nickel concentration lower than 3%, the ratio of the volumes of these phases can be estimated as 1:50, based on the ratio of contributions of the two phases (values of ). Note that the distance of 2.438 Å, which was earlier attributed to the Ni–O one, Sluchinskaya et al. (2013, 2014) actually corresponds to the Ni–Ni distance in BaNiO3-δ.
Note that two pure compounds in the BaNiO3-δ system, namely BaNiO2 and BaNiO3, have similar local structures. They consist of one-dimensional Ni–Ni chains extending along one of the axes with quite short Ni–Ni distance (about 2.4 Å) and two or three oxygen atoms located adjacent to this short bond. When there are two atoms, they are arranged as planar NiO4 squares forming puckered chains; when there are three atoms, they form triangles whose centers are in the middle of the Ni–Ni bond. When the number of oxygen atoms is intermediate, as is the case of BaNiO3-δ, the atoms are located in random positions adjacent to the Ni–Ni chains. There is no a long-range order in the arrangement of these atoms, and they are highly disordered. This explains very high values of the Debye–Waller factors for the oxygen atoms in the second phase and a practical impossibility of observing precipitates of this phase in X-ray diffraction. To simulate the defective BaNiO3-δ phase, we chosen the BaNiO3 phase, although either of two phases under discussion can be used when analyzing the EXAFS spectra.
In conclusion, we discuss the decrease in the lattice parameter observed in our samples upon their doping. According to our measurements, the lattice parameter of the nickel-doped samples was 0.14% less than that of the undoped material. Our calculations of the changes in the cubic lattice parameter upon doping gave the following results for the nickel concentration of 6.25%: +0.522% for the complex of Ni2+ with a distant vacancy, 0.095% for the complex of Ni2+ with the nearest vacancy, and 0.74% for Ni4+ at the site. It is seen that the model of the complex with a distant vacancy proposed in this work do not agree well with the X-ray diffraction data. However, it should be noted that the lattice parameter also decreased in a nickel-doped SrTiO3, in which nickel entered the site as a Ni4+ ion. Taking into account that the mean charge state in our samples is 2.5+, we can suppose that a part of nickel in the samples has the charge state 4+. The systematic appearance of the solutions with shorter Ni–O distances shows that such short distances can be in the samples (Table 3). Unfortunately, the fitting of the EXAFS spectra with simultaneous account of three models of the local environment is impossible because of a very large number of adjustable parameters.
VI Conclusions
The local environment and the charge state of the nickel impurity in cubic Ba0.8Sr0.2TiO3 have been studied by XAFS spectroscopy. The analysis of the XANES spectra showed that the mean charge state of the Ni atoms is 2.5+. The analysis of the EXAFS spectra, which took into account the results of first-principle calculations of the geometry of defects, suggests that Ni atoms enter the sites of the perovskite structure, and the difference between the Ni2+ and Ti4+ charges is mainly compensated by distant oxygen vacancies. In addition, the EXAFS data analysis revealed that a considerable amount of nickel in the sample is in the form of the X-ray amorphous second phase BaNiO3-δ. The measurement of the lattice parameter and its comparison with the results of the computer modeling showed that the decrease in the unit cell volume upon doping could indicate the existence of a small amount of Ni4+ ions at the sites in the samples. The obtained results can be interesting for designing a new type of solar energy converters that use the bulk photovoltaic effect in the material studied in this work.
Acknowledgements.
The authors are grateful to the BESSY staff for the possibility of performing the experiments and technical assistance. This work was supported by the Russian Foundation for Basic Research, project no. 17-02-01068.References
- Sturman and Fridkin (1992) B. I. Sturman and V. M. Fridkin, Photogalvanic effect in media without the inversion center and related phenomena (Nauka, Moscow, 1992).
- Glass et al. (1974) A. M. Glass, D. von der Linde, and T. J. Negran, Appl. Phys. Lett. 25, 233 (1974).
- Qin et al. (2008) M. Qin, K. Yao, and Y. C. Liang, Appl. Phys. Lett. 93, 122904 (2008).
- Alexe and Hesse (2011) M. Alexe and D. Hesse, Nat. Commun. 2, 256 (2011).
- Blasse et al. (1981) G. Blasse, P. H. M. de Korte, and A. Mackor, J. Inorg. Nucl. Chem. 43, 1499 (1981).
- Bennett et al. (2008) J. W. Bennett, I. Grinberg, and A. M. Rappe, J. Am. Chem. Soc. 130, 17409 (2008).
- Gou et al. (2011) G. Y. Gou, J. W. Bennett, H. Takenaka, and A. M. Rappe, Phys. Rev. B 83, 205115 (2011).
- Lebedev et al. (2009) A. I. Lebedev, I. A. Sluchinskaya, A. Erko, and V. F. Kozlovskii, JETP Lett. 89, 457 (2009).
- Sluchinskaya et al. (2010) I. A. Sluchinskaya, A. I. Lebedev, and A. Erko, Bull. Russ. Acad. Sci.: Phys. 74, 1235 (2010).
- Sluchinskaya et al. (a) I. A. Sluchinskaya, A. I. Lebedev, and A. Erko, in Proceedings of the 19th All-Russia Conference on Ferroelectric Physics, Moscow, June 2011, p. 116.
- Sluchinskaya et al. (b) I. A. Sluchinskaya, A. I. Lebedev, V. F. Kozlovskii, and A. Erko, in Proceedings of the 8th National conference on X-Ray, Synchrotron Radiations, Neutrons and Electrons for Study of Nanosystems and Materials. Nano-, Bio-, Info-, Cognitive Technologies, Moscow, 2011, p. 347.
- Sluchinskaya et al. (2013) I. A. Sluchinskaya, A. I. Lebedev, and A. Erko, J. Adv. Dielectrics 3, 1350031 (2013).
- Sluchinskaya et al. (2014) I. A. Sluchinskaya, A. I. Lebedev, and A. Erko, Phys. Solid State 56, 449 (2014).
- Glaister and Kay (1960) R. M. Glaister and H. F. Kay, Proc. Phys. Soc. 76, 763 (1960).
- Huang and Tuan (2007a) Y. C. Huang and W. H. Tuan, Mater. Chem. Phys. 105, 320 (2007a).
- Boujelben et al. (2009) F. Boujelben, F. Bahri, C. Boudaya, A. Maalej, H. Khemakhem, A. Simon, and M. Maglione, J. Alloys Comp. 481, 559 (2009).
- Das et al. (2014) S. K. Das, R. N. Mishra, and B. K. Roul, Solid State Commun. 191, 19 (2014).
- Böttcher et al. (2011) R. Böttcher, H. T. Langhammer, and T. Müller, J. Phys.: Condens. Matter 23, 115903 (2011).
- Duverger et al. (1994) E. Duverger, B. Jannot, M. Maglione, and M. Jannin, Solid State Ionics 73, 139 (1994).
- Huang and Tuan (2007b) Y.-C. Huang and W.-H. Tuan, J. Electroceram. 18, 183 (2007b).
- Huang et al. (2008) J. Q. Huang, P. Y. Du, W. J. Weng, and G. R. Han, J. Electroceram. 21, 394 (2008).
- Kumar et al. (2009) Y. Kumar, M. A. Mohiddon, A. Srivastava, and K. L. Yadav, Ind. J. Eng. Mater. Sci. 16, 390 (2009).
- Kool et al. (2007) T. W. Kool, S. Lenjer, and O. F. Schirmer, J. Phys.: Condens. Matter 19, 496214 (2007).
- Lenjer et al. (2000) S. Lenjer, R. Scharfschwerdt, T. W. Kool, and O. F. Schirmer, Solid State Commun. 116, 133 (2000).
- Lebedev and Sluchinskaya (2016a) A. I. Lebedev and I. A. Sluchinskaya, Bull. Russ. Acad. Sci.: Phys. 80, 1068 (2016a).
- Lebedev and Sluchinskaya (2016b) A. I. Lebedev and I. A. Sluchinskaya, Ferroelectrics 501, 1 (2016b).
- Langhammer et al. (2016) H. T. Langhammer, T. Müller, T. Walther, R. Böttcher, D. Hesse, E. Pippel, and S. G. Ebbinghaus, J. Mater. Sci. 51, 10429 (2016).
- Geprägs et al. (2010) S. Geprägs, A. Brandlmaier, M. Opel, R. Gross, and S. T. B. Goennenwein, Appl. Phys. Lett. 96, 142509 (2010).
- Pecharromán et al. (2001) C. Pecharromán, F. Esteban-Betegón, J. F. Bartolomé, S. López-Esteban, and J. S. Moya, Adv. Mater. 13, 1541 (2001).
- Tuan and Chen (2009) W. H. Tuan and S. S. Chen, Ferroelectrics 381, 167 (2009).
- (31) “IFEFFIT project home page,” http://cars9.uchicago.edu/ifeffit/.
- (32) “FEFF project home page,” http://leonardo.phys.washington.edu/feff/.
- Garrity et al. (2014) K. F. Garrity, J. W. Bennett, K. M. Rabe, and D. Vanderbilt, Comput. Mater. Sci. 81, 446 (2014).
- Anisimov et al. (1997) V. I. Anisimov, F. Aryasetiawan, and A. I. Lichtenstain, J. Phys.: Condens. Matter 9, 767 (1997).
- Postnikov et al. (1998) A. V. Postnikov, A. I. Poteryaev, and G. Borstel, Ferroelectrics 206, 69 (1998).
- McQuarrie (1955) M. McQuarrie, J. Am. Ceram. Soc. 38, 444 (1955).