Review of bottomonium measurements from CMS
Abstract
We review the results on the bottomonium system from the CMS experiment at the Large Hadron Collider. Measurements have been carried out at different center-of-mass energies in proton collisions and in collisions involving heavy ions. These include precision measurements of cross sections and polarizations, shedding light on hadroproduction mechanisms, and the observation of quarkonium sequential suppression, a notable indication of quark-gluon plasma formation. The observation of the production of bottomonium pairs is also reported along with searches for new states. We close with a brief outlook of the future physics program.
keywords:
Quarkonia; bottomonia; cross section; polarization; suppression; QGP; LHC.PACS numbers: 14.40.Pq, 25.75.Nq, 13.85.Ni
[Published as Int. J. Mod. Phys. A 32 (2017) 1730015]
1 Introduction
Bottomonia, bound states of a bottom quark and its antiparticle, constitute the heaviest meson system. The only heavier quark, the top quark, decays before it can hadronize. Light quark (, , ) constituents in mesons typically move at relativistic speeds as their masses are considerably smaller than the meson masses. Heavy quarkonia, charmonia and especially bottomonia, are in contrast approximately non-relativistic systems. This allows in turn the application of effective theoretical approaches to describe nonperturbative effects in Quantum Chromodynamics (QCD). As a result, heavy quarkonia provide a valuable framework for probing the strong interaction as described by QCD within the Standard Model (SM) and for searching for new phenomena.
The description of heavy quarkonium production is achieved through effective models of QCD. A most complete approach is provided by nonrelativistic QCD (NRQCD) [1, 2], which implements a factorization of the perturbative and nonperturbative terms. The latter are expressed in terms of long-distance matrix elements, assumed to be universal. Several effective QCD models [1, 2, 3, 4, 5, 6, 7, 8, 9, 10, 11, 12, 13] of quarkonium production predict different cross sections and polarizations. The thorough measurement of these observables plays a crucial role in advancing the theoretical understanding of the quarkonium production mechanisms.
Under extreme temperature and density conditions, QCD calculations predict a transition to a color-deconfined phase of matter, referred to as the quark-gluon plasma (QGP). Heavy quarkonia are most promising probes of the QGP medium, having become the focus of detailed scrutiny since the phenomenon of color screening was proposed [14]. While charmonia has been extensively explored as a QGP probe [15, 16], until recently this had not been the case for bottomonia, even though the bottomonium family of states provides experimentally more robust and theoretically cleaner probes.
Heavy flavor states in general, and quarkonia in particular, are “standard candles”, which are explored for detector calibration and used in precision measurements of the SM as well as searches for phenomena beyond the SM. Precision studies of observable decay rates may indicate discrepancies that would be accommodated by new mediating heavy bosons. They can also be used directly to search for new physics. Decays to pairs of new light particles, or possible dark matter candidates, are foreseen in certain new physics scenarios. Quarkonia may be further explored to search for exotic states and rare physics processes that are sensitive to new physics.
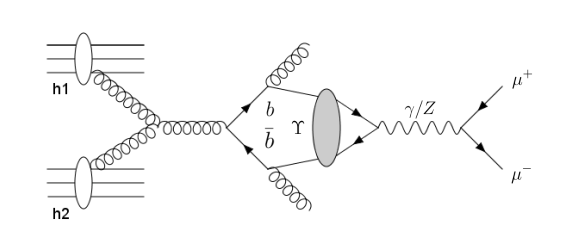
Bottomonia originate from pairs that are produced in the partonic interactions occurring in the hadronic collision, which evolve into color-neutral states, and are experimentally detected through their leptonic decay channels, as illustrated in Fig. 1. The first bottomonium state to be discovered, the , was observed in 1977 in the spectrum produced in 400 GeV proton-nucleus collisions by the E288 experiment at Fermilab [17]. Later many other bottomonium states have been seen and the system has been experimentally established, as summarized in Fig. 2 [18].
Since 2010, a new era of detailed bottomonium studies has been underway at the Large Hadron Collider (LHC) [30] with higher energy and intensity. The center-of-mass energy of the proton-proton () collisions reached 13 TeV in 2015, which is about 7 times higher than that attained at the Tevatron (). The center-of-mass energy reached at the LHC with the Lead-Lead (PbPb) collisions is more than 20 times that attained at the Relativistic Heavy Ion Collider (RHIC).
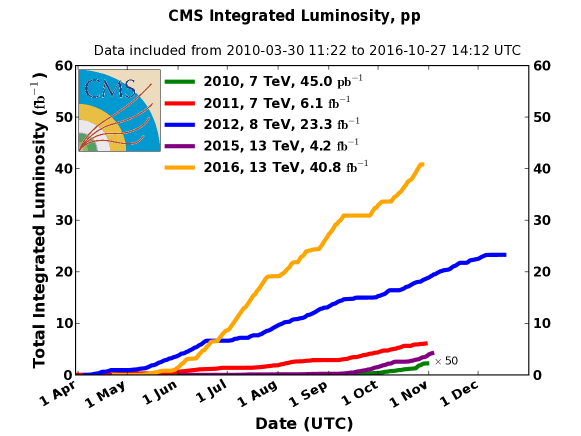
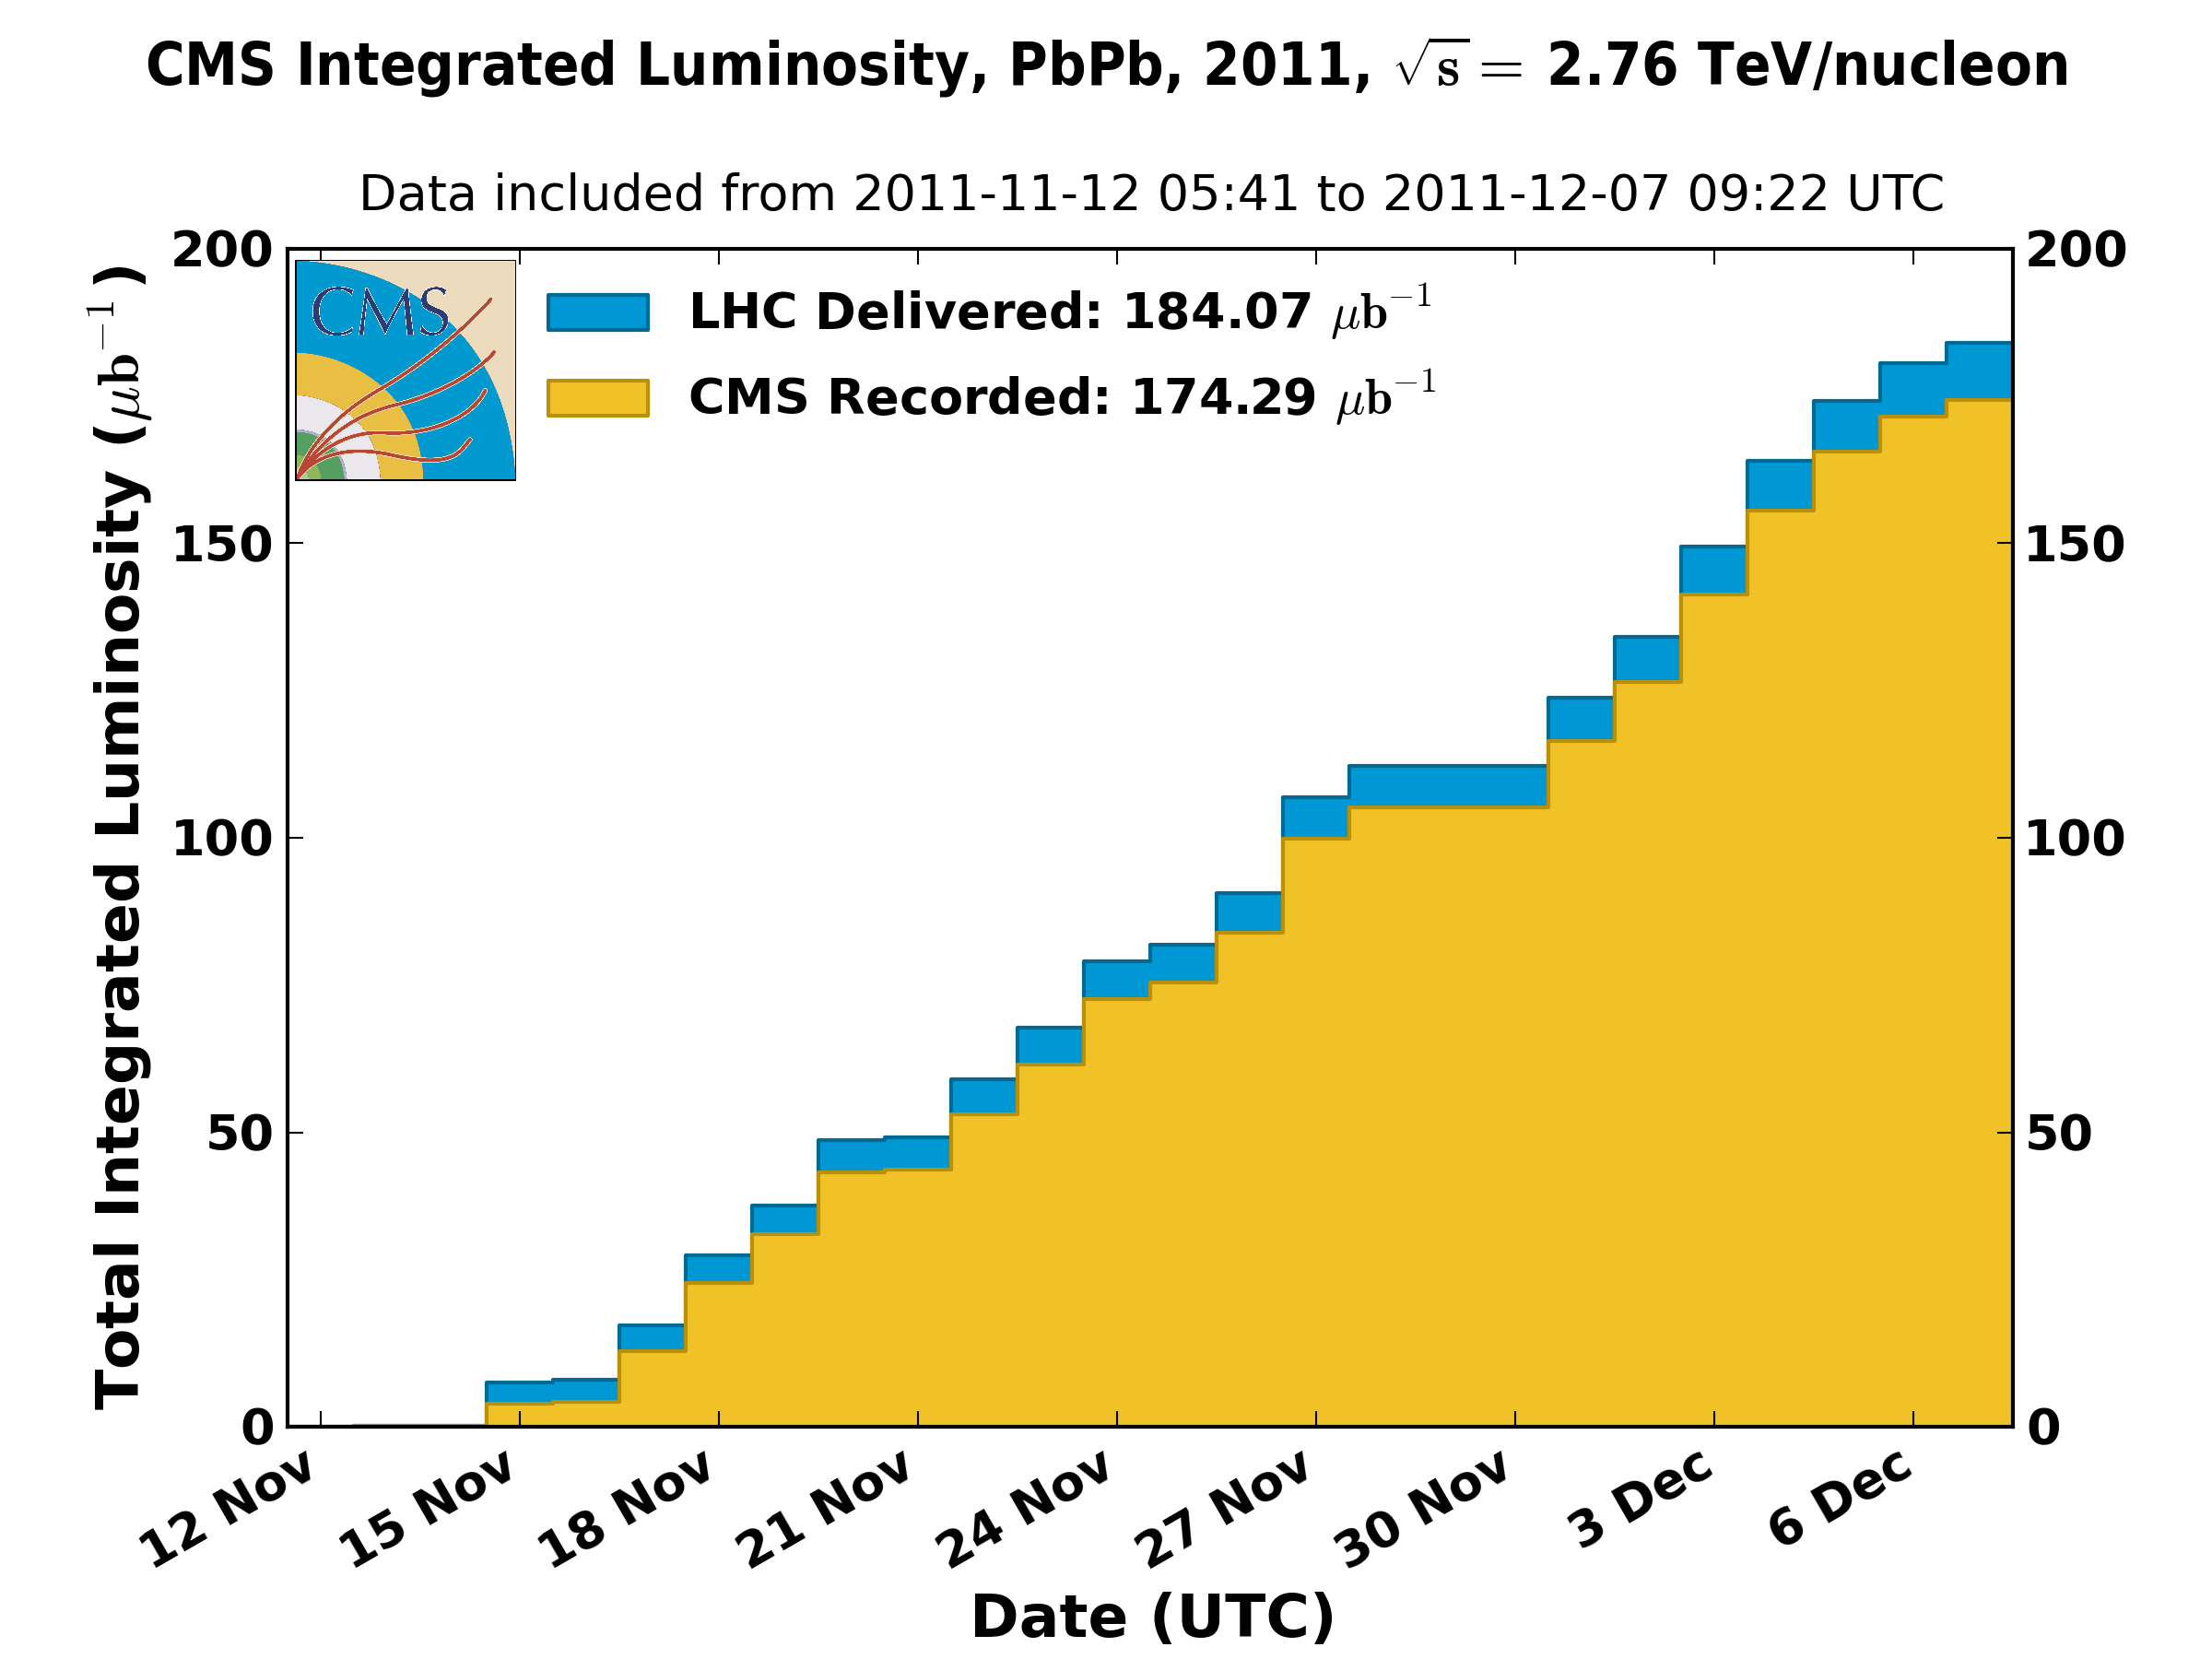
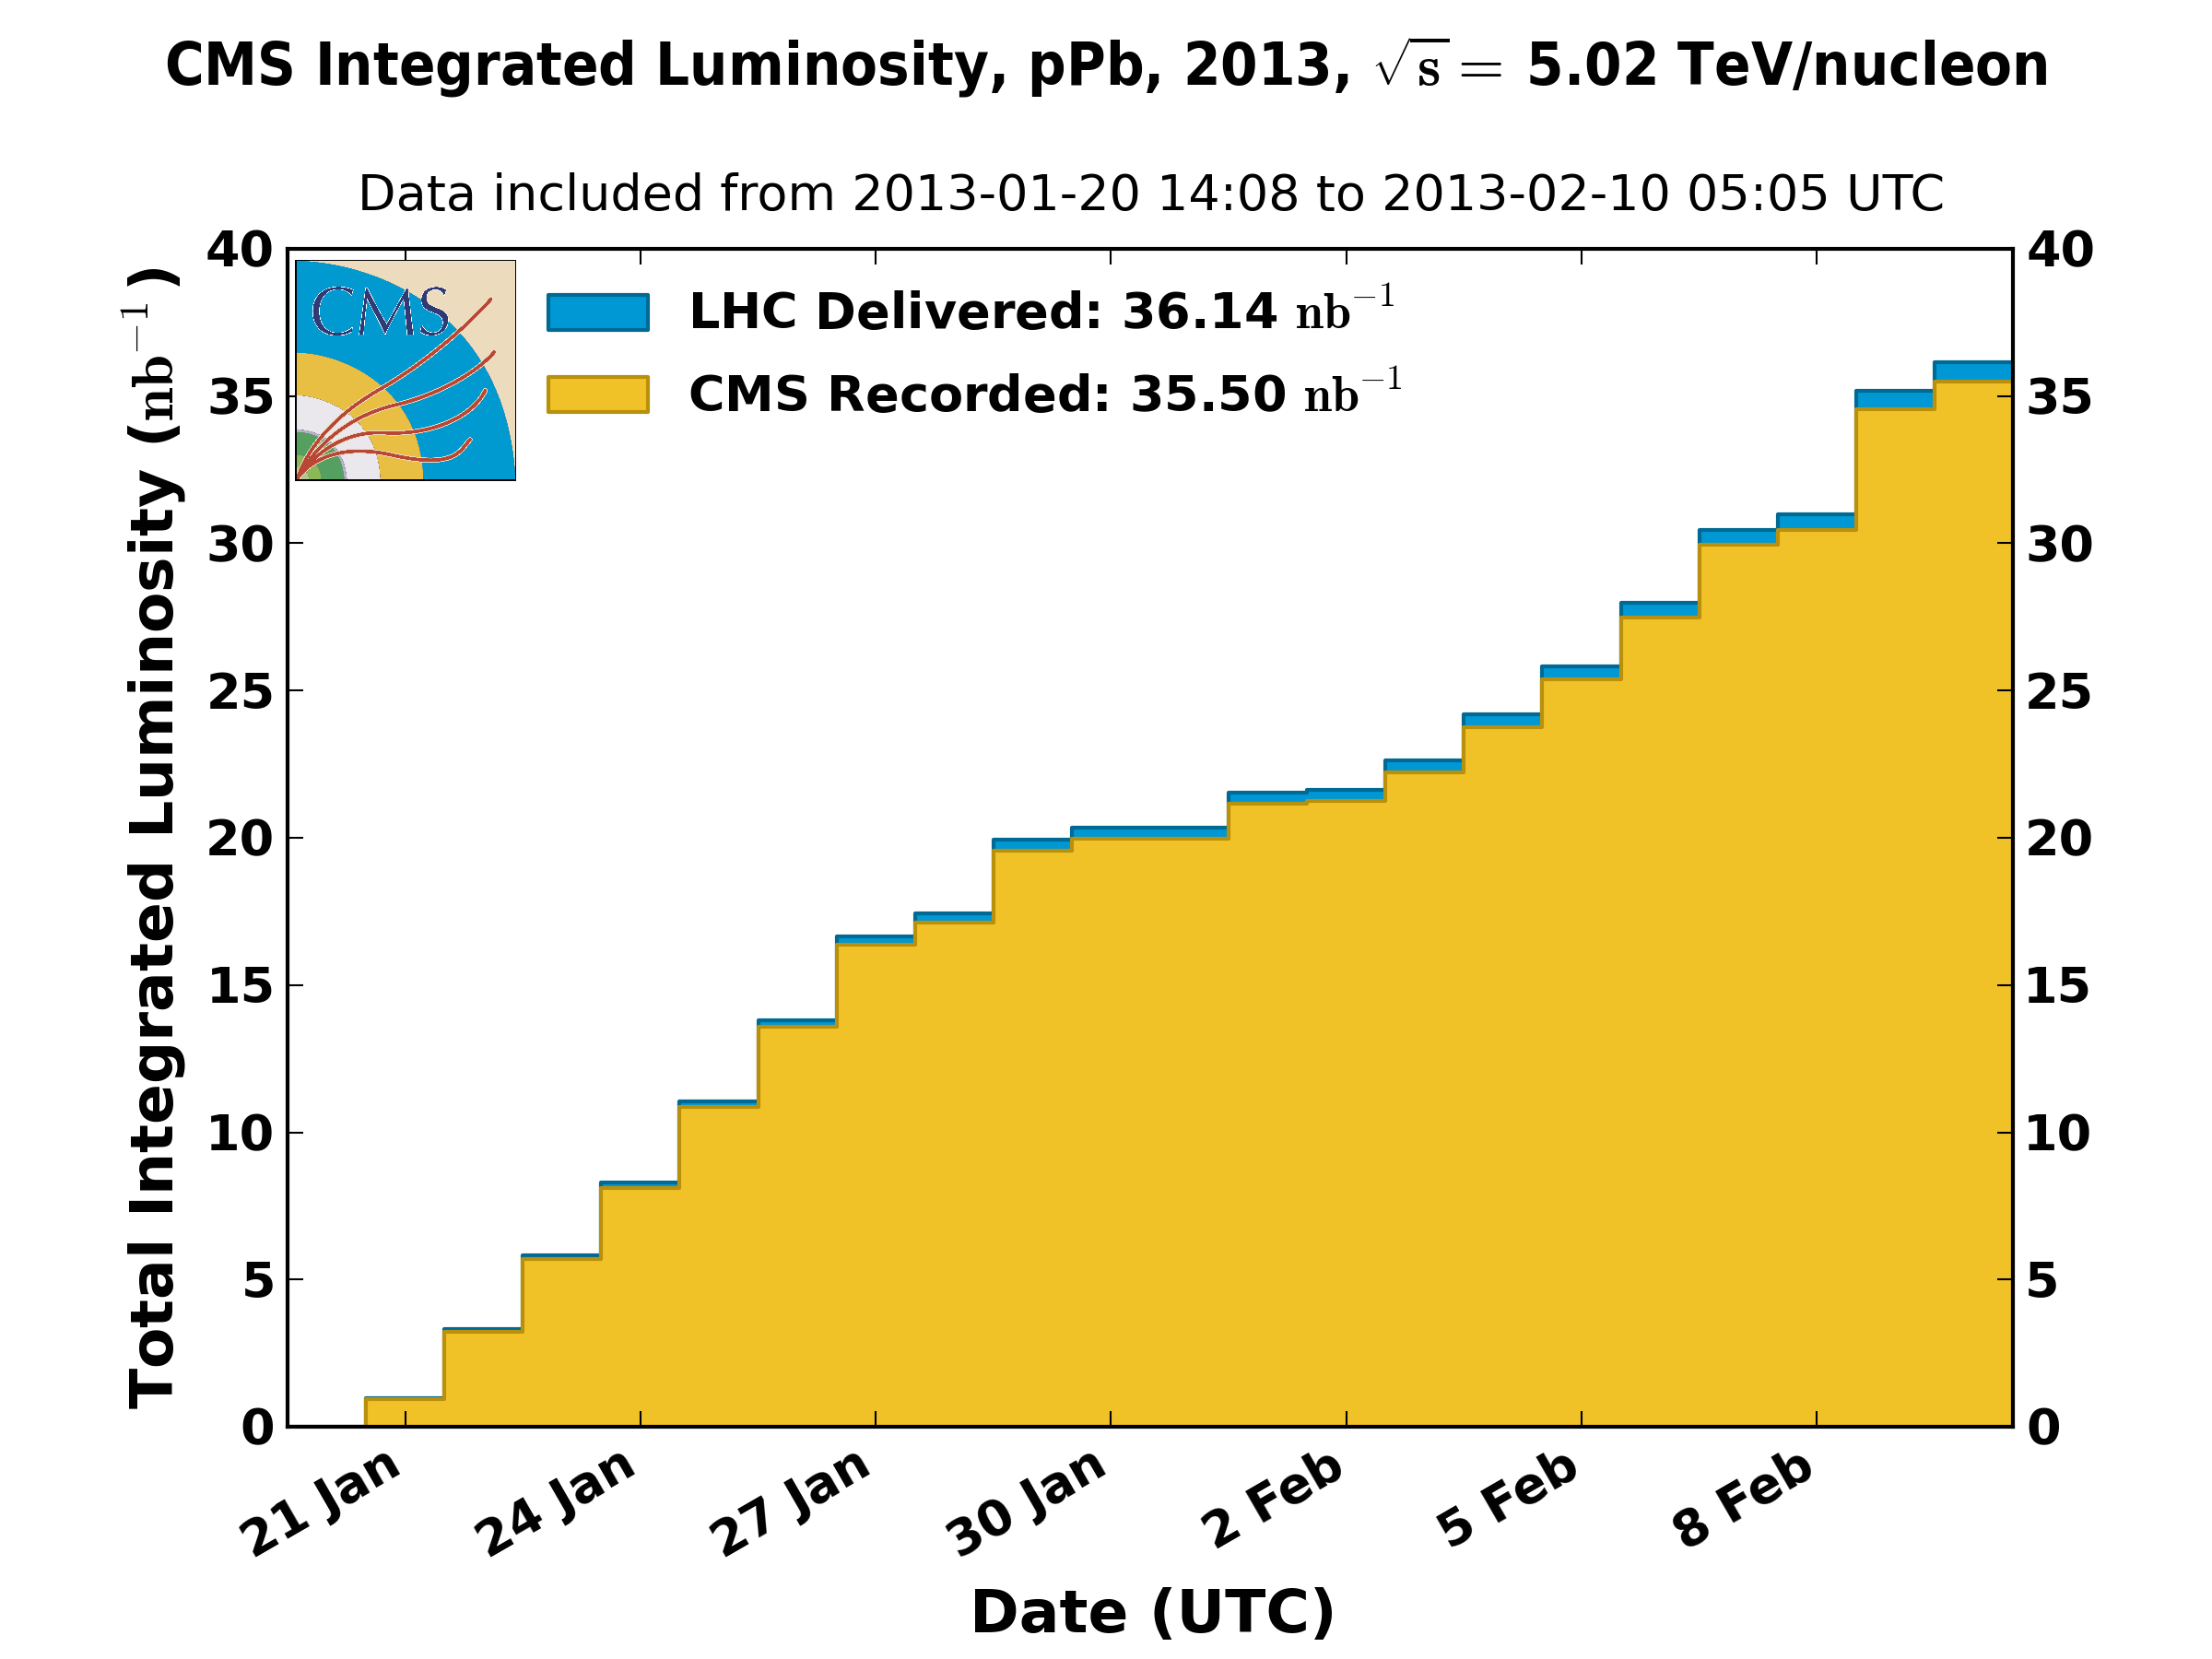
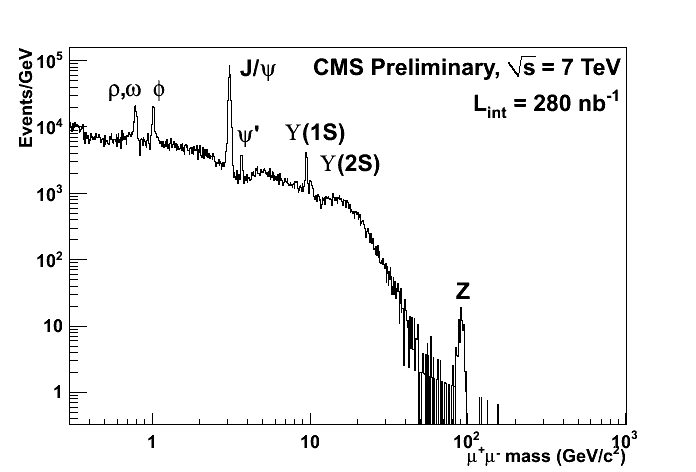
The Compact Muon Solenoid (CMS) is a general purpose detector at the LHC. It explores both collisions and collisions involving heavy ions. The charged particles produced in the collisions leave trajectories in the CMS all-silicon Tracker. The particle momentum is precisely measured in the 3.8 T axial magnetic field. Since the start of its operation, several large data sets have been delivered by the LHC. The integrated luminosity recorded by CMS is shown in Fig. 3 [31]. Early into the start of the LHC data taking in 2010, a full spectrum of the dimuon invariant mass was reconstructed by CMS. As evidenced in Fig. 4, even with an initial data set corresponding to a few hundred nb-1, CMS was able to observe many SM particles, in a wide mass range from the to the boson. The figure essentially combines many particle physics discoveries of the past 50 years into a single picture.
Taking advantage of its good momentum resolution, CMS is able to distinguish the three lowest lying resonances in the dimuon decay channel. None of the heavy ion experiments at RHIC were able to achieve this, and ALICE and ATLAS at the LHC are only able to resolve the resonances with difficulty. Compared to LHCb and the Tevatron experiments, CMS has both complementary and wider kinematic acceptance coverage. These advantages make CMS uniquely suited for bottomonium measurements.
In this review, measurements of -wave bottomonium production in , PbPb, and Pb collisions are summarized. The relative production of -wave bottomonia is presented. Several effective models of QCD have been compared to and challenged by these measurements. The QCD predicted deconfined medium has been probed by comparing the measurements from different types of collisions. The first observation of bottomonium pair production and searches for new states are also discussed.
2 Production in proton-proton collisions
Historically, quarkonium production has been poorly understood. A number of effective QCD approaches attempt to describe the nonperturbative evolution of the pair into a color neutral bound state, including the color-singlet model (CSM) [9, 10], the color-octet mechanism (COM) [11, 12] dominant in NRQCD, and the color-evaporation model (CEM) [13]. The models have been proposed to explain hadroproduction measurements. The similarities and differences among them are discussed in detail elsewhere [34]. These models provide different predictions for the quarkonium production cross sections and polarizations. Bottomonium states are heavier and more non-relativistic than charmonium states, so the comparison between experiment and theory is expected to be more reliable for bottomonium [35]. A precise measurement of bottomonium production is thus crucial for distinguishing among the models.
In recent years, cross section and polarization results of production in hadron collisions have been reported by CDF [36, 37], D0 [38], CMS, ATLAS [39, 40], and LHCb [41, 42]. However, none of the current theoretical models predict both the rate and the polarization as observed in any of these experiments. This situation is referred to as the “quarkonium puzzle.” In this section, we summarize the production measurements for the different center-of-mass regimes probed by CMS.
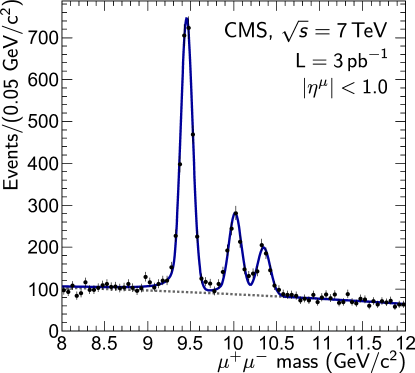
The states are typically reconstructed through the dimuon decay channel, . While the branching fractions for these decays are only about 2%, Fig. 4 shows that CMS is able to collect a large number of events even in a limited integrated luminosity data set and to cleanly resolve the lightest three states.
2.1 cross section
The first preliminary results on quarkonium production cross sections at the LHC were reported [32] only a few months after the start of data taking, in summer 2010, based on less than 0.3 pb-1 collected by CMS. The first publication [43] of the cross sections of the individual states in collisions at TeV followed based on a 10 times larger data set, corresponding to an integrated luminosity of 3.1 pb-1.
The differential cross section is measured as [43]:
| (1) |
where is the dimuon branching fraction, is the signal yield corrected for the event weights given by the inverse product of the detector acceptance and the combined trigger and reconstruction efficiencies , is the integrated luminosity, and and are the widths of the bins in transverse momentum () and rapidity (). The symbol in Eq. (1) is used to indicate that the measurements include feed-down contributions originating from decays of higher-mass bottomonia as indicated in Fig. 2.
The signal yield before correction is determined using an extended unbinned maximum-likelihood fit to the dimuon invariant mass spectrum, as shown in Fig. 5. The dimuon candidates are required to satisfy , while the individual muon candidates must satisfy kinematic thresholds that depend on pseudorapidity , to ensure that the trigger and reconstruction efficiencies are high and stable [43]:
| (4) |
Such a detector acceptance region defined by the , , and requirements is referred to as the fiducial region.
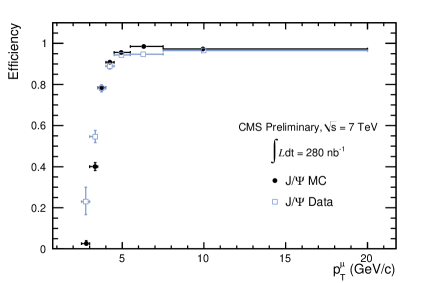
The signal acceptance is defined as the fraction of mesons with and with both muons in the fiducial volume of the detector, and is determined from Monte Carlo simulation. The acceptance as a function of is shown in Fig. 6 (left) [43]. The seemingly peculiar form of this graph shows that, when the is produced at rest, both muons are likely to reach the muon detector and pass the threshold. When the acquires a small boost, one of the muons may be below the muon detection threshold defined in Eq. (4), and the acceptance drops. This is due to the large mass of the compared to the threshold. For an momentum above about half the mass (in natural units), the strongly boosted passes large momentum to the two daughter muons and the acceptance starts to increase with . The trigger and reconstruction efficiency of the accepted muon is determined with a data-based tag-and-probe (T&P) technique [43, 44]. An example efficiency turn-on curve as a function of the muon is displayed in Fig. 6 (right) [43]. Other selection criteria, such as the separation between the two muons, and the vertex quality of the dimuon candidate, are also applied, and accounted for in the total efficiency.
Assuming unpolarized production, the product of the cross section and dimuon branching fraction, in collisions at 7 TeV, in the rapidity region is [43]:
| (11) |
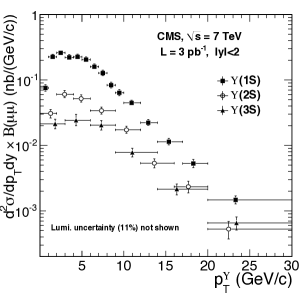
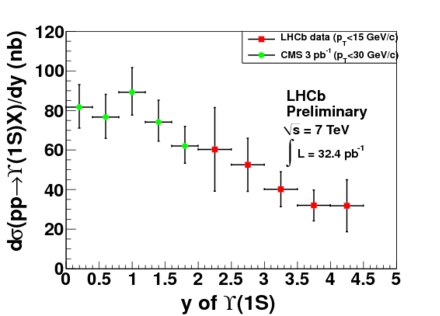
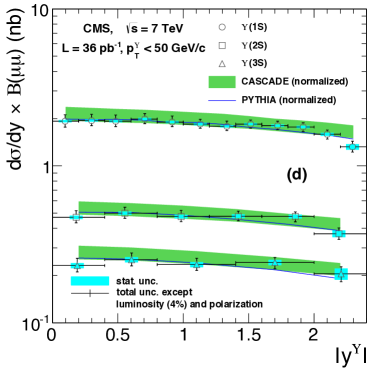
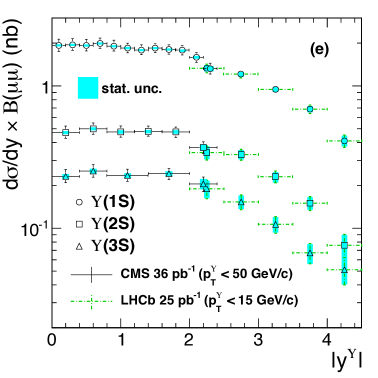
The differential cross sections as functions of and rapidity are shown in Fig. 7 [43]. The measurements are performed down to zero . The complementarity of the CMS and LHCb [41] detectors in terms of phase-space coverage is also illustrated. Heralding the start of the LHC era, the first bottomonium measurement performed at the LHC covers about the same range as the Tevatron experiments had reached at the end of their lifetime [36, 38]. The measured cross section is about three times larger than that measured at the Tevatron. This increase in the cross section values is expected, given the increased center-of-mass energy at the LHC compared to the Tevatron.
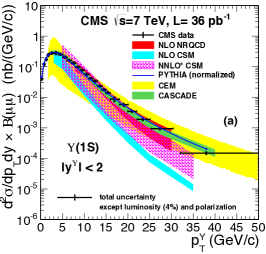
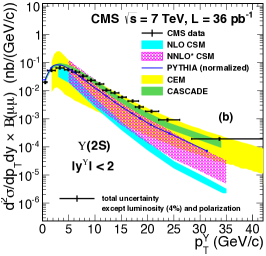
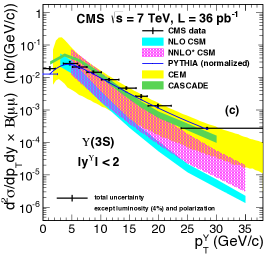
To measure the differential cross section more precisely, especially in the high region, the analysis was subsequently extended to a larger data set, also collected in 2010 [45], corresponding to an integrated luminosity of about 36 pb-1. In a wider rapidity and transverse momentum range, and GeV, the product of production cross section and dimuon branching fraction at 7 TeV is found to be [45]:
| (18) |
To facilitate the comparison with the results given in Eq. (11), a matching rapidity requirement was applied. The results agree within uncertainties in the region; for example, is statistically compatible with the result in Eq. (11). The differential cross sections, corrected for acceptance and efficiency, as a function of and are shown in Fig. 8 [45]. The comparisons of the measured results with the CASCADE [46] MC generator, the CEM model without feed-down [13], NRQCD COM at next-to-leading order (NLO) including feed-down [12], CSM to NLO, and NNLO* [10], are also shown in the figure.
The cross sections reported above assume unpolarized production. Polarization affects the spatial distribution of the two muons from the decay, and therefore the fraction of the signal that is in the detector acceptance region. For extreme assumptions for the polarization, i.e. either fully transverse or fully longitudinal, the cross section results vary by about %. A fiducial cross section may be defined as the yields corrected only by the efficiency but not by the geometric acceptance, which can be used to compare with theoretical models without making any assumption for the polarization. The product of the fiducial cross section and dimuon branching fraction is [45]:
| (25) |
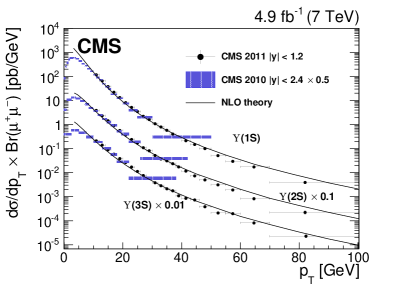
As increases, higher-order corrections become more significant in several of the theoretical models. Therefore, cross section measurements in high regions are important for distinguishing among the models. The CMS analysis was further expanded using the full 4.9 fb-1 collision data taken at TeV in 2011 with the coverage increased to 100 GeV [47].
Figure 9 (left) [47] shows the differential cross section as a function of from the two groups of data, one integrated over the rapidity range of (CMS 2011, black dots) and the other scaled to the same range (CMS 2010, cross-hatched areas). The solid lines are the NLO NRQCD color-octet calculations from Ref. 48, with the range of further extended to GeV by the corresponding authors, which describe the trends of the data points for all the three states. This significant increase of the range is also useful in studying the dependence in other models.
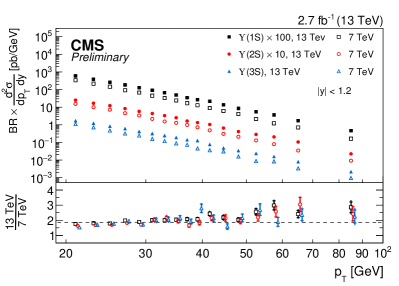
A similar measurement was repeated using a data set corresponding to 2.7 fb-1, collected in 2015, at the beginning of the second LHC data-taking period (Run 2). This was the first result of the cross section at TeV reported by CMS [49]. An analysis strategy similar to the one previously described was used: dimuons were selected in the central rapidity region, , and tighter muon acceptance thresholds were adopted, namely GeV for . The reach attained with this measurement based on the initial data is already 100 GeV, and will increase with enlarged Run 2 datasets. While the focus is in the high region, a lower threshold is effectively imposed from tightening trigger rate requirements. This measurement is reported from an of 20 GeV. The results are shown in Fig. 9 (right) [49], where a comparison of the differential cross sections for the 7 and 13 TeV data sets is also given. The cross sections for all bottomonium states at 13 TeV are larger than the corresponding cross sections at 7 TeV by a factor of two to three. This increase is expected from the -induced variation in the parton distribution functions, and is confirmed by simulations using the PYTHIA 8 description. The extensions of NRQCD and other theoretical models at 13 TeV are currently in progress.
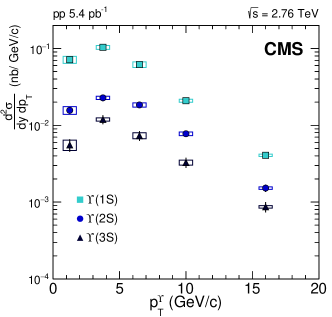
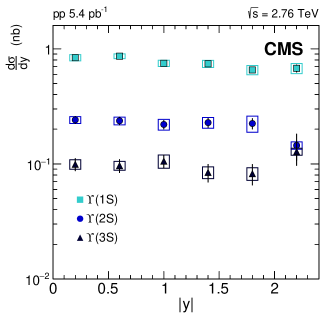
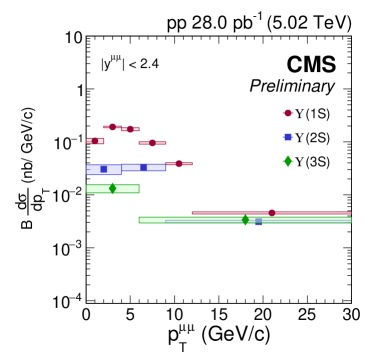
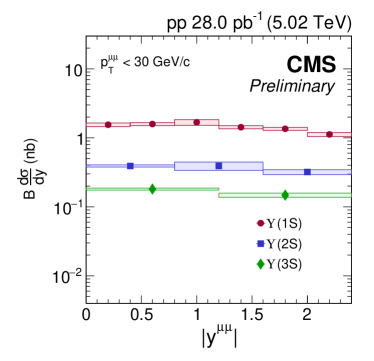
Reduced event number data sets accumulated in special runs at different center-of-mass collision energies, of TeV (Ref. 50) and TeV (Ref. 51), corresponding to 5.4 and 28 pb-1, respectively, have been also explored. The differential cross section measurements of the individual states as a function of and rapidity are shown in Fig. 10. Despite the modest statistical power and reduced reach, because of the small size of the data sets accumulated, these measurements add useful information for characterizing the production dependence.
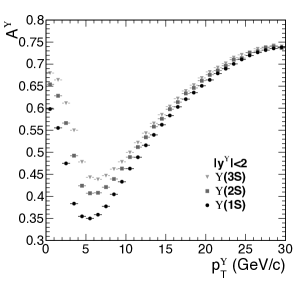
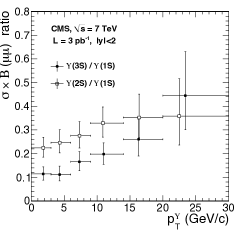
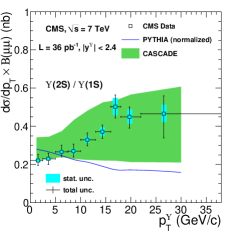
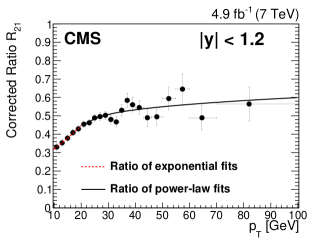
The relative production cross sections provide further information, from both experimental and theoretical perspectives. For this reason CMS has provided cross section ratios since the earliest measurements [43, 45, 47], and these are summarized in Fig. 11. They illustrate a clear increase in the production ratios, , particularly at low values. As larger data sets probe the higher region, a saturation threshold appears at about three times the mass, as displayed in the right-side panel of Fig. 11.
2.2 polarization
Measurements of quarkonium polarization provide important information about the production mechanisms, and complement the cross section measurements. As was discussed, the latter also have a sizable dependence on the former. The strategy adopted by CMS involves the measurements of the assumed unpolarized cross sections and separately of the polarizations. The two form the proper inputs to carry out global fits for disentangling and characterizing the competing production mechanisms.
Although the and cross sections measured at Tevatron [36, 52, 38] and LHC [43, 41, 45, 53] can be reproduced by NRQCD COM calculations, the corresponding predictions [54] for “strong” transverse polarizations are in stark contrast with the negligible polarizations observed by the experiments [55]. And, although heavy quarkonia from color singlets are expected to be produced with longitudinal polarization [9, 35], this is also not observed.
The polarization can be measured through the analysis of the angular distribution of the two leptons produced in the decay [7, 8]:
| (26) |
where and are the azimuthal and polar angles of the outgoing leptons with respect to the quantization axis (-axis) of the chosen polarization frame. are the set of polarization parameters; the parameter is 0 (1) for fully longitudinal (transverse) polarization. The polarization parameters depend on the reference frame in which they are measured. The three most commonly used reference frames are the helicity frame (HX), where the -axis coincides with the momentum direction in the collision center-of-mass frame; the Collins–Soper (CS) frame [56], where the -axis is chosen as the bisector of the two beam directions in the rest frame; and the perpendicular helicity (PX) frame [57], which is orthogonal to the CS frame. The -axis is always taken along the direction of the vector product of the two beam directions in the rest frame. In addition, one can define some observables that do not depend on the frame in which they are measured.
The bottomonium states are heavier and satisfy the non-relativistic approximation better than charmonium states. Measurements of the states, especially in the high region, are thus expected to provide more robust tests of NRQCD. Earlier measurements from CDF [37] and D0 [58] collaborations were found to be in disagreement with the theoretical predictions, and also disagreed to some degree between the two experiments. In these earlier measurements only the parameter was extracted, in a single polarization frame. CMS measured all the polarization parameters , , and , in the complementary polarization frames mentioned above, as well as the frame-invariant quantity , using the data sample at TeV corresponding to an integrated luminosity of 4.9 fb-1 [59].
Figure 12 shows the , , and measurements as function of [59], for the states in the HX frame, in the rapidity range . Measurements in complementary kinematic regions and reference frames were also performed. The frame-invariant parameters for the three states were also studied as a function of the , and are in good agreement in the HX, CS, and PX frames [59]. All polarization parameters are compatible with zero or small values in the three polarization frames.
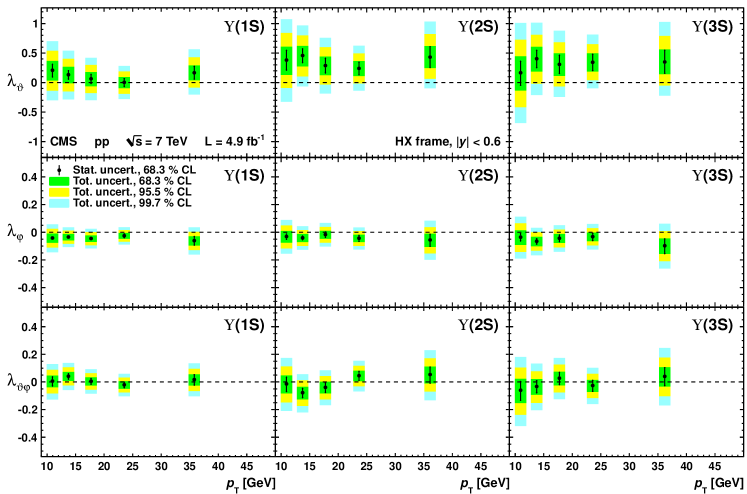
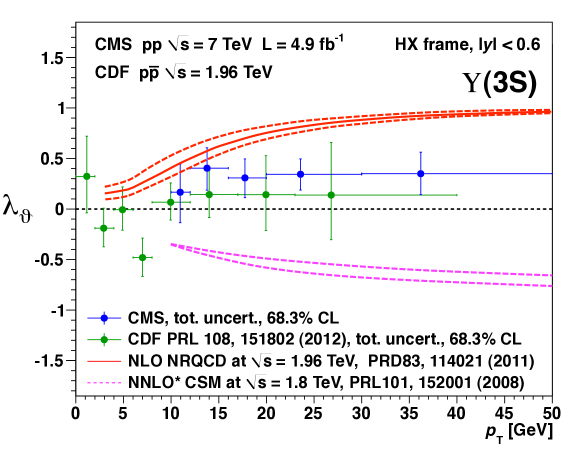
In summary, the measurements exclude large longitudinal and transverse polarizations for , in extended and ranges compared with previous experiments. This result is in disagreement with the theoretical predictions for high-energy hadron collisions, as shown in Fig. 13 [59, 60].
The measurements of cross section and polarization have led to new theoretical interpretations of the quarkonium puzzle. For instance, in a recent study [6], global fits using both cross section and polarization measurements are performed to determine the nonperturbative parameters of bound-state formation. This study reveals unexpected hierarchies in the phenomenological long-distance parameters, which brings a new understanding of the bound-state formation mechanism in QCD.
3 Suppression in heavy ion collisions
3.1 suppression in PbPb
Quarks and gluons are normally bound together to form composite particles. However, QCD allows for strongly interacting matter to undergo a phase transition to an unbound (deconfined) state at sufficiently high temperature and density. The unique medium of quarks and gluons in this deconfined state where the partons are no longer confined to hadrons is referred to as the quark-gluon plasma. This medium can be produced in heavy ion collisions, where once the heavy quarkonium states are formed they are expected to unbind due to the strong interactions with partons in the medium through a QCD Debye screening mechanism [14]. Above a certain temperature, the weaker bound states, such as , are expected to unbind more completely compared to the more strongly bound states, e.g. . At even higher temperatures, more of the weakly bound states are expected to dissolve. In the experiment, this sequential unbinding (also referred to as melting) of quarkonium states is expected to be observed as a sequential suppression of their yields. The suppression of heavy quarkonium states was accordingly proposed as the smoking-gun signature of the phase transition, and its sequential pattern as a probe of the medium temperature [14, 61, 62].
The NA50 [63, 64, 65] and NA60 [66] experiments at the CERN Super Proton Synchrotron, and the PHENIX [15] and STAR [67] experiments at BNL RHIC had measured suppression of and yields in heavy ion collisions. However, these experiments were not able to carry out quantitative studies of the states. Bottomonium states are regarded as better probes because recombination effects are believed to be much less significant than in the charmonia case [68]. Although the recombination effect is expected to increase for bottomonia from RHIC to LHC energies, it is predicted to remain small [69].
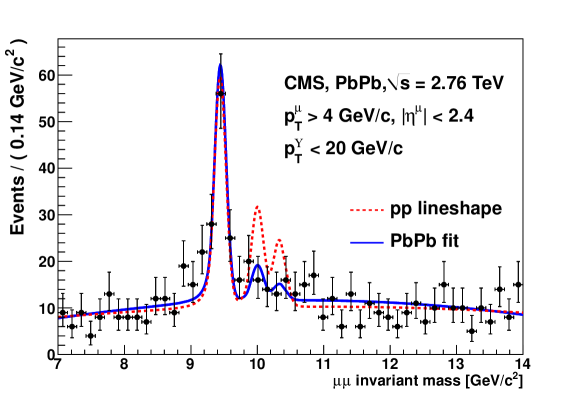
The first indication of suppression in heavy ion collisions was reported by CMS in 2011 [61, 70, 71]. This result is based on data collected during the first LHC PbPb run in 2010 and a special run in 2011, at the same 2.76 TeV center-of-mass collision energy per nucleon pair (). The PbPb and data sets correspond to integrated luminosities of 7.3 b-1 and 230 nb-1, respectively. Thanks to the good momentum resolution of the CMS detector and the large event samples, the three resonances observed in the dimuon mass spectrum were well separated for both PbPb and . Similar techniques were applied to the two data sets to extract yields and calculate cross sections. The results are shown in Fig. 14 [72], where the solid (blue) line represents the fit to the mass spectrum in PbPb, and the dashed (red) line represents the line-shape from the fit to the data. In this figure, all three peaks are normalized such that the yield in the line-shape matches the yield in the PbPb fit. The and resonances in PbPb collisions are clearly more strongly suppressed than the , compared with the result. The statistical significance of the effect has been evaluated to be 2.4 . The double ratio, , measured in the kinematic region defined by GeV and , is found to be [61], significantly smaller than unity.
Besides the hot-nuclear-matter (HNM), corresponding to the QGP, the suppression of production can also be caused by cold-nuclear-matter (CNM) effects [73]. But the CNM effects cancel to first order in the double ratio measurements. For example, one of the initial-state effects, “shadowing,” [73] is expected to suppress all three resonances by almost the same factor, so it has a small impact on their ratio. One of the final-state effects, “nuclear absorption,” [73] is expected to be less important at LHC collision energies. (To further probe CNM effects, measurements in proton-lead collisions are conducted as described in Sec. 3.2.) Other effects that could affect the suppression measurements, such as differences in the detector acceptance and efficiency, are similar for the different states and largely cancel in the double ratio analysis.
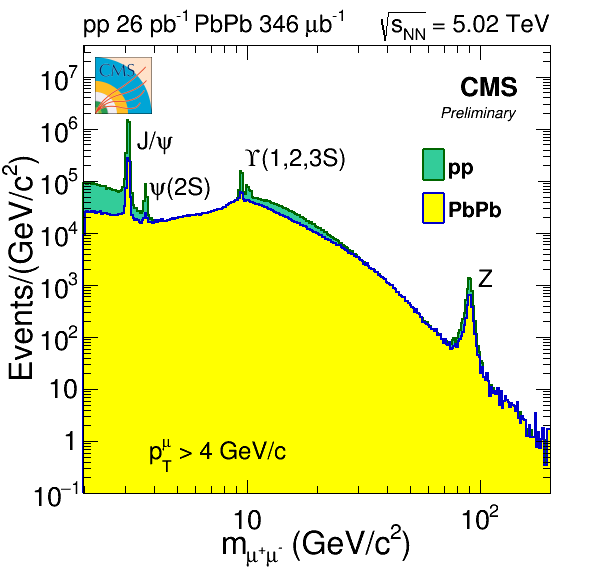
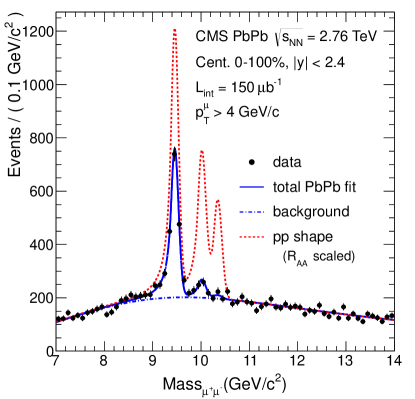
The integrated luminosity of the second LHC PbPb run exceeded 150 b-1 at the end of 2011, which is approximately 20 times larger than the 2010 integrated luminosity. With this large data set, the relative suppression of excited states with respect to the ground state in PbPb was observed with a significance exceeding 5 [74]. A comparison of dimuon mass spectra in PbPb and is shown in Fig. 15 [75]. The state is clearly suppressed in PbPb relative to , while the and states are suppressed to an even greater degree. The double ratios for and are measured as: [74]
| (29) |
In addition to the relative suppression of the two excited states with respect to the ground state, the absolute suppression of all three individual states was also measured. This is quantified by the nuclear modification factor, , that is defined as the ratio of the yield per nucleon-nucleon collision in PbPb relative to that in , corrected for efficiencies and normalized by luminosities. It is measured as
| (30) |
where is the nuclear overlap function [71], and is the number of minimum-bias events sampled by the event selection. When , suppression in PbPb is observed; otherwise, there is no indication of medium effects. A more detailed explanation of the observable can be found in Ref. 74. The absolute suppression of the three individual resonances is measured to be: [74]
| (34) |
Subsequently, the event sample was increased by about 20 times in 2013 (5.4 pb-1) [50], which allowed for a better differential study as function of the rapidity, transverse momentum, and centrality. Figure 16 shows the and versus rapidity (left plot) and transverse momentum (middle plot).
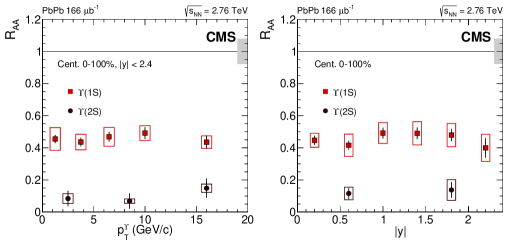
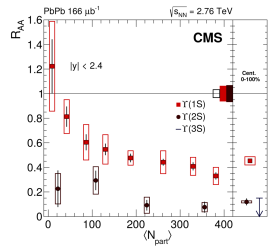
Centrality is an important parameter in QGP matter studies because it is directly related to the overlap region of the colliding nuclei. It is determined from the energy deposits in the forward calorimeter [76], starting from 0% for the most central collisions. With Glauber model calculations [77, 78], the centrality variable can be expressed in terms of the number of nucleons participating in the collisions, . In PbPb collisions, is the number of nucleons (at most 208 for a Pb nucleus) that collide at least once with nucleons in the other Pb nucleus. In Fig. 16 (right), the values for and are shown as functions of [50]. For , the suppression was observed to increase with the centrality of the collisions. Comparisons with theoretical models are given in Ref. 79.
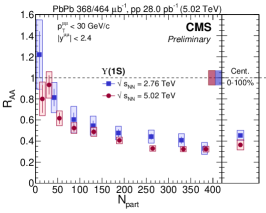
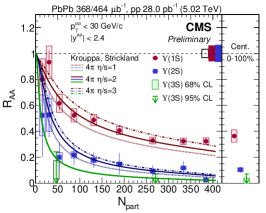
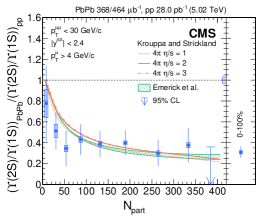
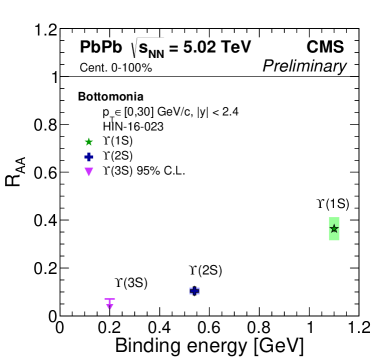
The suppression of states in PbPb collisions at TeV is expected to be stronger than that measured at 2.76 TeV, because the temperature of the medium is higher owing to the higher collision energy. CMS results reported at Quark Matter 2017 [80, 51, 81] support this expectation, as shown in Fig. 17 (left). In Fig. 17 (middle), the versus centrality is compared with model expectations [80, 82], which contain bottomonia placed in an anisotropic hydrodynamic model. Other comparisons of as functions of rapidity and transverse momentum can be found in Refs. 80 and 51. The centrality-integrated double ratio for is measured as . [81] The double ratio as a function of centrality is shown in Fig. 17 (right). The centrality-integrated double ratio for is less than 0.29 at 95% CL. [81]
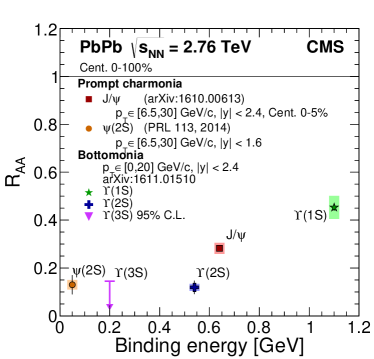
The sequential suppression behavior may be best illustrated by displaying as a function of the binding energy of the studied quarkonium states. This is represented in Fig. 18 [83, 80], for all -wave quarkonium states. In this way CMS has experimentally established the sequential pattern of quarkonium suppression.
3.2 suppression effects in Pb and in
As discussed above, cold-nuclear-matter effects will influence the formation of bottomonium bound states. Some CNM effects could even cause a sequential suppression dependent on the binding energy of the pairs. The suppression observed in PbPb collisions is a combined effect caused by both CNM and HNM, while a possible suppression in proton-lead (Pb) collisions would be attributed to CNM only. Consequently, it is essential to study production in the Pb reference system, as it is representative of the possible non-HNM suppression effects. This knowledge can be extrapolated into the PbPb system so that the fraction of suppression due to HNM in PbPb collisions can be understood.
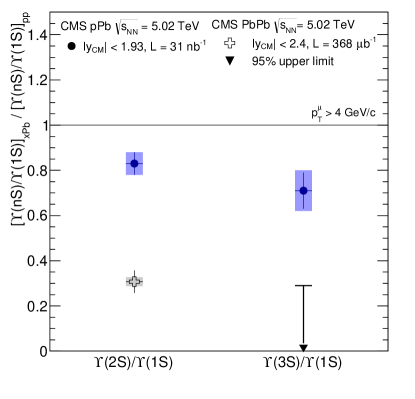
The Pb data set collected by CMS in 2013 corresponds to an integrated luminosity of 31 nb-1. The Pb double ratios were measured to be [84]:
| (37) |
The results lie slightly below unit, pointing to the presence of possible non-HNM effects. Such contributions reflect only as small corrections to the magnitude of the sequential suppression in PbPb, which is highly significant and associated to HNM. A comparison between Pb/ and PbPb/ double ratios is provided in Fig. 19 [84].
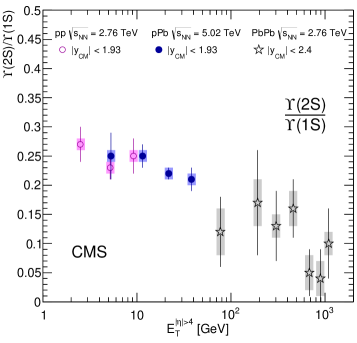
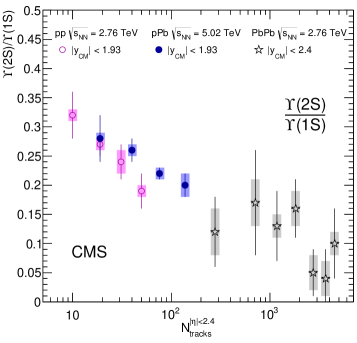
The / single ratios were also studied in the three collision systems, along with their dependency on event activity variables. In the left panel of Fig. 20 [84], the ratios are plotted with respect to the raw transverse energy deposited in the most forward part of the hadron calorimeters at , while in the right panel, the ratios are plotted with respect to the number of charged particle tracks, excluding the two muons, with MeV and at . The tracks are required to originate from the same vertex as the muon pairs.
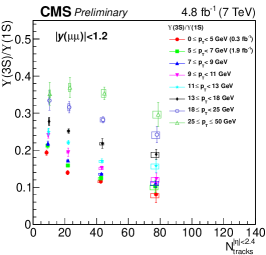
The decrease of the / ratio in Fig. 20 may indicate the presence of some new phenomena in quarkonium production in collisions. Other results recently published by the LHC experiments [85, 86, 87, 88, 89, 90] can also be interpreted as hints of collective effects in the high multiplicity environment at the attained energies [91, 92]. However, it is still not clear whether the medium produced in collisions could undergo a phase transition, as observed in PbPb collisions.
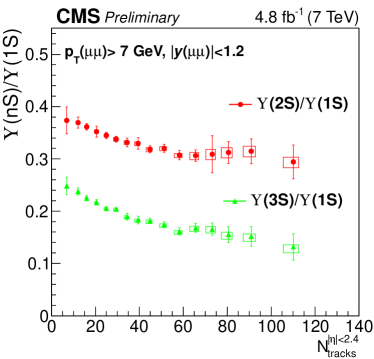
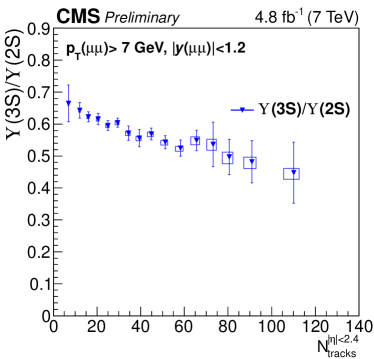
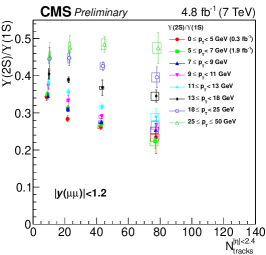
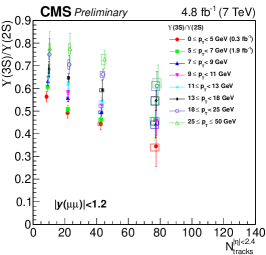
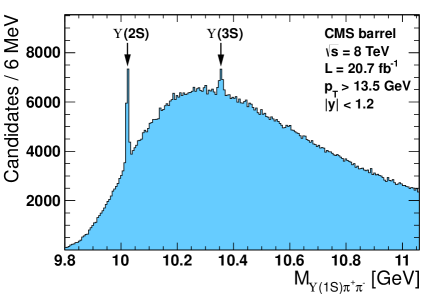
A search was performed for possible new features in the bottomonium yields as the particle multiplicities increase in collisions [93, 94]. Using the collision data collected at TeV by the CMS experiment, the ratios of the cross sections of the mesons were investigated, as shown in Fig. 21 [95]. The production ratios for , , and are displayed as a function of the number of charged particles with GeV and . All these ratios clearly decrease with increasing multiplicity. Figure 22 shows the production ratios in different regions [95]. The decrease with increasing multiplicity is again present and is stronger in the lower region. The behavior at higher is flatter, especially so for the ratio as indicated in Fig. 22 (left). Overall, the observed decrease in the production ratios at TeV shows a similar trend as that at TeV (Fig. 20).
4 -wave states
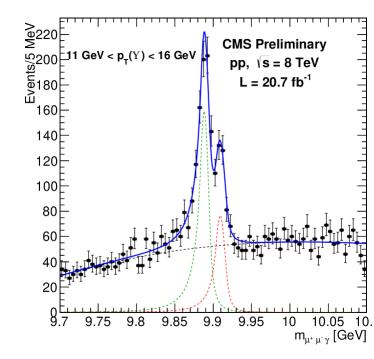
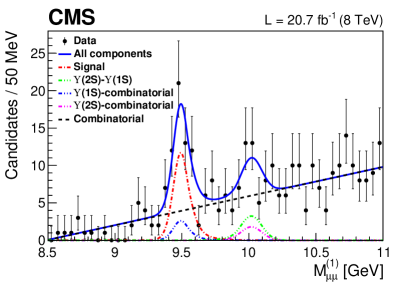
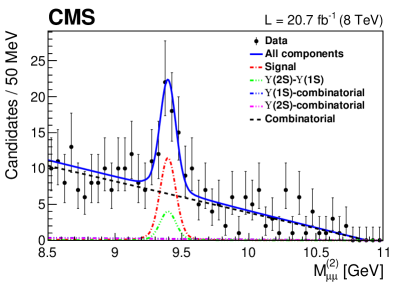
Measurements of -wave quarkonium production can be used to help further understand the hadron formation mechanism and test NRQCD predictions. The production ratios have been measured by CMS [96], LHCb [97], and ATLAS [98], providing valuable insight into the quarkonium production mechanism. The production cross section measurement is also important since it is particularly sensitive to color-octet contributions [99, 100]. The measurement is challenging because of the small separation (only 19.4 MeV) between the and the peaks, as well as their small cross sections. The -wave bottomonium production cross section ratio, , was measured with the 20.7 fb-1 collision data taken at TeV [100]. The and states are detected through their radiative decays , where the decays to two muons, and the photon is reconstructed through its conversion to a pair in the inner layers of the tracker. Although the yield of reconstructed conversion photons is small, the four-momentum of the photon can be precisely determined through a fit to the electron and positron tracks in the tracker. With this strategy, the resulting mass resolution (of the order of 5 MeV) of the candidates is sufficient to separate the and peaks.
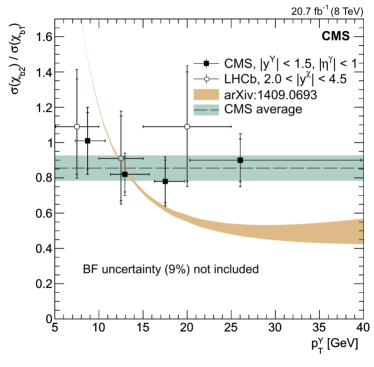
The ratio was measured as a function of . The invariant mass distribution of the candidates is shown in Fig. 23 (left) [100], where the and states are visible. Figure 23 (right) gives the production cross section ratio as a function of measured by CMS, and a comparison with the LHCb result [101] and an NRQCD theoretical calculation [102]. Because of the lack of measurements, the calculation is based on the previous charmonium measurements of [96, 97, 98], but scaled for the case of bottomonium. Neither CMS nor LHCb results agree with the band predicted by the theory. More studies are needed in order to thoroughly test NRQCD predictions in the -wave bottomonium sector.
5 Pair production
The measurement of quarkonium pairs originating from a common vertex in collisions provides additional insight into the underlying mechanisms of particle production at the LHC. The study of quarkonium pair production is essential to understand contributions of SPS (single-parton scattering) and DPS (double-parton scattering) processes. It also forms the baseline for the search of quarkonium pair resonances, which are predicted by several studies [103, 104]. In this section, the first observation and cross section measurement of pair production, reported by CMS based on 20.7 fb-1 of collisions at TeV, is discussed [105].
Proton collisions at hadron colliders are described by parton models. Each colliding hadron is characterized as a collection of free elementary constituents. In a single hadron-hadron collision, two partons often undergo a single interaction (SPS), although the composite nature of hadrons permits multiple distinct interactions (multiple-parton interactions or MPIs) to occur, the simplest case being DPS. The SPS mechanism for heavy quarkonium pair production can be described to a good extent by the NRQCD COM approach [11]. However, contributions from the DPS mechanism are not easily addressed within this framework [106], and DPS or MPIs are sometimes invoked to account for observations that cannot be explained otherwise [107]. Heavy quarkonium states are expected to probe the distribution of gluons in the proton since their production is dominated by gluon-gluon interactions [108, 109]. The large event samples at the LHC enable a search for exotic states decaying into heavy quarkonium, such as tetra-bottom or tetra-charm quark states, and a measurement of the double cross section provides a benchmark measurement for these searches [104, 110].
In the CMS pair production study [105], each collision is scanned for a signature of four-muon candidates with the sum of muon charges equal to zero. To ensure a uniform muon acceptance and a well-defined kinematic region, selected muons are required to be within and have GeV. An candidate is reconstructed by combining two oppositely charged muons that originate from a common vertex. In constructing the candidates, the two pairs of muons are assigned as (i) the invariant mass of the higher-mass candidate, , (ii) the invariant mass of the lower-mass candidate, .
The signal yield of pair events is extracted by constructing a two-dimensional (2D) unbinned maximum likelihood fit to the invariant mass of the reconstructed combinations, and . Figure 24 shows [105] the projection of the invariant mass distributions of the higher and lower mass muon pairs in the data with the superimposed 2D fit. The efficiency and acceptance of the detector are computed with a data-embedding method that repeatedly substitutes the measured muon four-momenta into different simulated events, which are then subjected to the complete CMS detector simulation and reconstruction chain.
The cross section of pair production, measured for events in which both mesons have , is determined to be
| (40) |
where is the measured pair yield, is the average correction factor that accounts for all the inefficiencies in the measurement, fb-1 is the integrated luminosity. The world-average branching fraction of the decay, , is used, and its uncertainty is quoted separately in the result. The mesons are assumed to decay isotropically. Compared to an isotropic meson decay, the cross section is expected to vary up to 40%, for fully longitudinal or transverse polarizations of the meson.
An effective area parameter, , may be defined [108, 112] that accounts for the geometric size and the transverse spatial distribution of the partonic matter inside the proton. While is assumed to be independent of the scattering process, it may depend on the parton flavor. The cross section for pair production is related to as
| (41) |
where is the fraction of DPS contribution to the observed cross section. An experimental measurement of the fraction , which may be extracted from an analysis of the rapidity or azimuthal angle difference between the two produced quarkonia, has not been yet produced, given the reduced number of pairs in the current data set. Using the single cross section [45] in Eq. (18), restricted to the fiducial region () adopted in the measurement, and assuming to be in the range 10–30% [109], a result of in the rage 2–7 mb would be obtained. Such an estimate of is consistent with the range of values obtained from heavy quarkonium studies [111, 112], but smaller than that from multi-jet studies [113, 114, 115, 116]. This variation may be interpreted as resulting from a dependence of on the dominant partonic interactions in each type of process; namely, gluon-gluon interactions for quarkonium production, and quark-antiquark and quark-gluon parton interactions for the jet-related channels. More data at the LHC will improve the determination of SPS and DPS contributions in associated particle production.
6 Search for new and exotic states
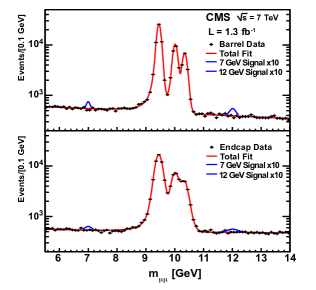
Quarkonium states are “standard candles” that are used extensively for detector and trigger calibration, and for extending measurements and searches down to the limit of the detector kinematic acceptance. The low-mass region is directly probed for new particle states. For example, searches are performed for light pseudoscalar states around the mass [117], as predicted in scenarios such as next-to-minimal supersymmetric models (Fig. 25, left). In addition, quarkonium states can be explored as final states in the search for new particles and rare processes.
Studies of di-quarkonium production, such as reported in Sec. 5, open new opportunities to search for possible exotic resonance states decaying to quarkonium pairs. In the bottomonium case reported above, one may probe for four -quark bound states. [104, 110]
Various unexpected quarkonium-like states have been identified since the discovery of the X(3872) state by BELLE more than a decade ago [118]. This exotic charmonium was discovered in the final state , tagged through meson decays, and its prompt production has been confirmed by various experiments, including CMS [119]. A search is conducted for an exotic bottomonium counterpart [120]. This is done probing the corresponding final state , as shown in Fig. 25 (right). Besides the excited states that are expected (Fig. 2) and appear prominently in the spectrum, no excess is detected over background, despite the analysis having the sensitivity for detecting such a state if its relative strength were comparable to the corresponding value for the X(3872). The search yielded the first exclusion limits on the production of the exotic bottomonium state at a hadron collider.
7 Conclusions and outlook
The CMS experiment has already contributed a set of very significant results towards an improved understanding of the heavy quarkonium sector at the LHC. The CMS detector acceptance, trigger, and reconstruction capabilities have allowed the prompt collection of large data sets containing dimuon signals, down to low transverse momenta, resulting in the ability to probe a wide mass spectrum as shown in Fig. 4. While the muon detectors contribute particle identification and the seeds for online selection, the silicon tracker allows for precise kinematic and topological reconstruction of particle decays. In particular, the precision achieved allows for separately identifying lightest three states – a capability that is fully exploited in the measurements reported here.
CMS has contributed the first bottomonium measurements at the LHC. Cross sections are among the first results extracted with initial data, both in LHC’s Run 1 and Run 2 data-taking periods. Measurements in collisions at the unprecedented center-of-mass energies of 2.76, 5.02, 7, 8, and 13 TeV have been undertaken, within the rapidity window of , and dimuon momenta up to 100 GeV. Cross sections and cross section ratios have been measured for -wave and -wave states. In addition, the angular distribution of the final-state muons has been analyzed in complementary reference frames, resulting in detailed measurements of the polarization parameters. This measurement has been reported for all three -wave states. The cross sections and the polarizations, combined in global fits, have shed considerable light on the QCD production mechanisms, contributing towards the resolution of the “quarkonium puzzle”. Analysis of new LHC data will extend the kinematic reach of the measurements and, in addition, extend the cross section and polarization measurements to the -wave states. These will be important pieces in the puzzle, and will allow the disentanglement of the - to -wave feed-down contributions, thus granting access to directly produced bottomonia.
Ground breaking results have also been achieved in collisions involving heavy ions. The considerable jump in collision energy and detector capability, as compared to previous heavy ion experiments, has placed CMS in a privileged position to explore the bottomonium sector in nuclear collisions. In particular, the experiment has delivered the first complete measurements of the individual states of the family in collisions involving heavy ions. Foremost, the ability to separately identify the individual states has been explored to probe their relative suppression. Such a novel and robust analysis has experimentally established the pattern of sequential suppression, wherein the excited states are more suppressed than the smaller, more strongly bound states. The absolute suppression, in PbPb with respect to , of the individual states has also been assessed. Detailed measurements of bottomonia, in PbPb but also Pb and , have probed (hot and cold) nuclear and environment effects. The analysis of larger LHC data sets will explore -wave states, quantifying the suppression of higher-mass states and their feed-down contribution to the inclusive measurements of the lighter ones. It will allow also to explore new observables, such as azimuthal anisotropies and polarizations through angular analyses, and to perform further studies of kinematic, angular, and environment dependencies. The continued exploration of the bottomonium sector, through more precise and new measurements, across different collisions systems and energies, will provide a more complete understanding of the underlying processes contributing to quarkonium production and suppression, and a more complete characterization of the properties of the hot medium attained with LHC collisions. Bottomonia can be explored in addition via photoproduction in collisions of protons or ions at the LHC. In such exclusive collisions, the incoming hadrons remain intact after the interaction and no other particles are produced, e.g. [121]. Such studies will offer a clean probe of the structure of the target hadron (A).
Production of bottomonium pairs has been observed for the first time and the cross section of pair production was reported. Extended and more precise studies of quarkonium pair production will more precisely quantify the effect of multi-parton interactions at the LHC. Additional studies of bottomonia associated production, involving other quarkonium states and, more generally, other hadrons, jets, and vector bosons, will contribute new perspectives towards a more complete understanding of the mechanisms of hadron production. At the same time, such studies of associated production open an interesting window into the spectroscopy realm, forming the basis for the search for new and exotic states. Rare decays of heavier particle states, e.g. and Higgs, to heavy quarkonium provide interesting channels that should be explored with increased precision in future higher luminosity LHC runs.
Precision heavy flavor measurements with a general purpose detector at the LHC are challenging, required an understanding of fine-grain effects and calibration of the detector in a low- regime, with a thorough appreciation of the corresponding increasing online rate limitations. Building upon the solid achievements already attained, and benefitting from detector and data acquisition systems upgrades, a dedicated and promising program of heavy-quarkonium physics will continue to be pursued in future LHC runs, aiming at contributing to a more complete understanding of the nature of strong interactions and the search for new phenomena.
Acknowledgments
We congratulate our colleagues in the CERN accelerator departments for the excellent performance of the LHC and thank the CMS institutes for their contributions to the success of the CMS effort. Z. Hu acknowledges partial support by the United States Department of Energy. N. T. Leonardo acknowledges partial support by Portugal’s Foundation for Science and Technology grant IF/01454/2013/CP1172/CT0003. In addition, we are grateful to Leonard Spiegel, Don Lincoln, Ao Liu, Kai Yi, Sergo Jindariani, Tingjun Yang, Zijun Xu, Wanwei Wu, as well as the CMS B-Physics group and the CMS Heavy-Ion group, for the useful discussions and valuable comments.
References
- [1] P. L. Cho, A. K. Leibovich, Phys. Rev. D 53, 150 (1996).
- [2] P. L. Cho, A. K. Leibovich, Phys. Rev. D 53, 6203 (1996).
- [3] G. T. Bodwin et al., Phys. Rev. Lett. 113, 022001 (2014).
- [4] B. Gong et al., Phys. Rev. Lett. 112, 032001 (2014).
- [5] S. P. Baranov, Phys. Rev. D 86, 054015 (2012).
- [6] P. Faccioli et al., Phys. Lett. B 736, 98 (2014).
- [7] P. Faccioli et al., Eur. Phys. J. C 69, 657 (2010).
- [8] P. Faccioli et al., Phys. Rev. Lett. 102, 151802 (2009).
- [9] P. Artoisenet et al., Phys. Rev. Lett. 101, 152001 (2008).
- [10] J. P. Lansberg, J. Phys. G 38 124110 (2011).
- [11] G. T. Bodwin, E. Braaten, and G. P. Lepage, Phys. Rev. D 51, 1125 (1995).
- [12] K. Wang, Y.-Q. Ma, K.-T. Chao, Phys. Rev. D 85 114003 (2012).
-
[13]
A. D. Frawley, T. Ullrich and R. Vogt, Phys. Rep. 462 125 (2008), arXiv:0806.1013,
http://dx.doi.org/10.1016/j.physrep.2008.04.002, and private communication. - [14] T. Matsui, H. Satz, Phys. Lett. B, 178 416 (1986), doi:10.1016/0370-2693(86)91404-8
- [15] PHENIX Collab. (A. Adare et al.), Phys. Rev. Lett. 98, 232301 (2007).
- [16] L. Yan, P. Zhuang and N. Xu, Phys. Rev. Lett. 97, 232301 (2006).
- [17] D. C. Hom et al., Phys. Rev. Lett. 39, 252 (1977).
- [18] C. Patrignani et al. (Particle Data Group), Chin. Phys. C 40, 100001 (2016).
- [19] E. Eichten et al., Phys. Rev. Lett. 34, 369 (1975).
- [20] W. Buchmuller and S.-H.H. Tye, Phys. Rev. D 24, 132 (1981).
- [21] S. N. Gupta, S. F. Radford, and W. W. Repko, Phys. Rev. D 34, 201 (1986).
- [22] T. Liu, Z. Chen and T. Huang, Z. Phys. C 46 133 (1990).
- [23] N. Brambilla et al., Phys. Lett. B 566, 275 (2000).
- [24] T. Barnes, S. Godfrey, and E. S. Swanson, Phys. Rev. D 72, 054026 (2005).
- [25] S. F. Radford and W. W. Repko, Phys. Rev. D 75, 074031 (2007).
- [26] N. Brambilla et al., Rev. Mod. Phys. 77, 1423 (2005).
- [27] G. T. Bodwin, E. Braaten, and G. P. Lepage, Phys. Rev. D 51, 1125 (1995).
- [28] M. Okamoto et al. (CP-PACS Collab.), Phys. Rev. D 65, 094508 (2002).
- [29] W. Serenone, arXiv:1408.3003 (2014).
- [30] A. Andronic et al., Eur. Phys. J. C 76, 107 (2016).
-
[31]
CMS Collab.,
https://twiki.cern.ch/twiki/bin/view/CMSPublic/LumiPublicResults. - [32] N. Leonardo, PoS (ICHEP 2010) 207.
-
[33]
CMS Collab., CERN-CMS-DP-2016-059,
https://cds.cern.ch/record/2212114. - [34] N. Brambilla et al. (Quarkonium Work. Group) Eur. Phys. J. C 71, 1534 (2011).
- [35] C. Patrignani, T. K. Pedlar, and J. L. Rosner, Annu. Rev. Nucl. Part. Sci. 63, 21 (2013).
- [36] CDF Collab. (D. E. Acosta et al.), Phys. Rev. Lett. 88, 161802 (2002).
- [37] CDF Collab. (T. Aaltonen et al.), Phys. Rev. Lett. 108, 151802 (2012).
- [38] D0 Collab. (V. M. Abazov et al.), Phys. Rev. Lett. 94, 232001 (2005); 100, 049902(E) (2008).
- [39] ATLAS Collab. (G. Aad et al.), Phys. Lett. B 705, 9 (2011).
- [40] ATLAS Collab. (G. Aad et al.), Phys. Rev. D 87, 052004 (2013).
- [41] LHCb Collab. (R. Aaij et al.), Eur. Phys. J. C 72, 2025 (2012).
- [42] LHCb Collab. (R. Aaij et al.), J. High Energy Phys. 09, 084 (2015).
- [43] CMS Collab. (V. Khachatryan et al.), Phys. Rev. D 83, 112004 (2011).
-
[44]
CMS Collab. (V. Khachatryan et al.), CMS-PAS-TRK-10-002,
http://cdsweb.cern.ch/record/1279139. - [45] CMS Collab. (S. Chatrchyan et al.), Phys. Lett. B 727, 101 (2013).
- [46] H. Jung et al., Eur. Phys. J. C 70, 1237 (2010).
- [47] CMS Collab. (V. Khachatryan et al.), Phys. Lett. B 749, 14 (2015).
- [48] B. Gong et al., Phys. Rev. Lett. 112, 032001 (2014).
-
[49]
CMS Collab. (V. Khachatryan et al.), CMS-PAS-BPH-15-005,
https://cds.cern.ch/record/2145411. -
[50]
CMS Collab. (V. Khachatryan et al.), Phys. Lett. B 04, 031 (2017),
doi:10.1016/j.physletb.2017.04.031. -
[51]
CMS Collab. (V. Khachatryan et al.), CMS-PAS-HIN-16-023,
https://cms-results.web.cern.ch/cms-results/public-results/preliminary-results/HIN-16-023/index.html. - [52] CDF Collab. (D. E. Acosta et al.), Phys. Rev. D 71, 032001 (2005).
- [53] CMS Collab. (S. Chatrchyan et al.), J. High Energy Phys. 02 011 (2012).
- [54] B. Gong, J.-X. Wang, and H.-F. Zhang, Phys. Rev. D 83, 114021 (2011).
- [55] CDF Collab. (A. Abulencia et al.), Phys. Rev. Lett. 99, 132001 (2007).
- [56] J. C. Collins and D. E. Soper, Phys. Rev. D 16, 2219 (1977).
- [57] E. Braaten et al., Phys. Rev. D 79, 014025 (2009).
- [58] D0 Collab. (V. M. Abazov et al.), Phys. Rev. Lett. 101, 182004 (2008).
- [59] CMS Collab. (S. Chatrchyan et al.), Phys. Rev. Lett. 110, 081802 (2013).
-
[60]
CMS Collab.,
https://twiki.cern.ch/twiki/bin/view/CMSPublic/PhysicsResultsBPH11023. - [61] CMS Collab. (S. Chatrchyan et al.), Phys. Rev. Lett. 107, 052302 (2011).
- [62] R. Vogt, Physics 5, 132 (2012). DOI: 10.1103/Physics.5.132.
- [63] NA50 Collab. (M. C. Abreu et al.), Phys. Lett. B 410, 337 (1997).
- [64] NA50 Collab. (M. C. Abreu et al.), Phys. Lett. B 499, 85 (2001).
- [65] NA50 Collab. (M. C. Abreu et al.), Eur. Phys. J. C 39, 335 (2005).
- [66] NA60 Collab. (R. Arnaldi et al.), Phys. Rev. Lett. 99, 132302 (2007).
- [67] STAR Collab. (B. I. Abelev et al.), Phys. Rev. C 80, 041902 (2009).
- [68] Y. Liu et al., Phys. Lett. B 697, 32 (2011).
- [69] K. Zhou, N. Xu and P. Zhuang, Nucl. Phys. A 931, 654 (2014).
-
[70]
Z. Hu, J. phys. G: Nucl. Part. Phys. 38, 124071 (2011),
doi:10.1088/0954-3899/38/12/124071. - [71] CMS Collab. (S. Chatrchyan et al.), J. High Energy Phys. 05, 063 (2012).
-
[72]
CMS Collab.,
https://twiki.cern.ch/twiki/bin/view/CMSPublic/PhysicsResultsHINQuarkonia11007. - [73] R. Vogt, Phys. Rev. C 81, 044903 (2010).
- [74] CMS Collab. (S. Chatrchyan et al.), Phys. Rev. Lett. 109, 222301 (2012).
-
[75]
CMS Collab.,
https://twiki.cern.ch/twiki/bin/view/CMSPublic/PhysicsResultsHIN11011. - [76] CMS Collab. (S. Chatrchyan et al.), J. High Energy Phys. 08, 141 (2014).
- [77] CMS Collab. (S. Chatrchyan et al.), Phys. Rev. C 84 024906 (2011).
- [78] M. L. Miller, K. Reygers, S. J. Sanders and P. Steinberg, Ann. Rev. Nucl. Part. Sci. 57, 205 (2007).
-
[79]
Z. Hu, J. Phys. Conf. Ser. 446, 012043 (2013),
doi:10.1088/1742-6596/446/1/012043. - [80] C. Flores, https://indico.cern.ch/event/433345/contributions/2358628/.
-
[81]
CMS Collab. (S. Chatrchyan et al.), arXiv:1706.05984,
http://cms-results.web.cern.ch/cms-results/public-results/publications/HIN-16-008/index.html. -
[82]
B. Krouppa and M. Strickland, Universe 2016, 2(3), 16,
doi:10.3390/universe2030016. -
[83]
CMS Collab.,
https://twiki.cern.ch/twiki/bin/viewauth/CMSPublic/PhysicsResultsHIN12007. - [84] CMS Collab. (S. Chatrchyan et al.), J. High Energy Phys. 04, 103 (2014).
- [85] CMS Collab. (S. Chatrchyan et al.), J. High Energy Phys. 09 091 (2010).
- [86] ATLAS Collab. (G. Aad et al.), Phys. Rev. Lett. 116, 172301 (2016).
- [87] CMS Collab. (V. Khachatryan et al.), Phys. Rev. Lett. 116, 172302 (2016).
- [88] ALICE Collab., Nature Physics (2017), doi:10.1038/nphys4111.
- [89] CMS Collab. (V. Khachatryan et al.), Phys. Lett. B 765, 193 (2017).
- [90] CMS Collab. (V. Khachatryan et al.), Phys. Lett. B 765, 103 (2017).
- [91] R. Campanini and G. Ferri, Phys. Lett. B 703, 237 (2011).
- [92] K. Dusling, W. Li, and B. Schenke, Int. J. Mod. Phys. E 25, 1630002 (2016).
- [93] T. Lang and M. Bleicher, Phys. Rev. 87, 024907 (2013).
- [94] E. G. Ferreiro and C. Pajares, Phys. Rev. 86, 024907 (2012).
- [95] CMS Collab., CMS-PAS-BPH-14-009, https://cds.cern.ch/record/2223879.
- [96] CMS Collab. (S. Chatrchyan et al.), Eur. Phys. J. C 72, 2251 (2012).
- [97] LHCb Collab. (R. Aaij et al.), Phys. Lett. B 714, 215 (2012).
- [98] ATLAS Collab. (G. Aad et al.), J. High Energy Phys. 07, 154 (2014).
- [99] A. K. Likhoded, A. V. Luchinsky, and S. V. Poslavsky, Phys. Rev. D 86 074027 (2012).
- [100] CMS Collab. (V. Khachatryan et al.), Phys. Lett. B 743, 383 (2015).
- [101] LHCb Collab. (R. Aaij et al.), J. High Energy Phys. 10, 88 (2014).
- [102] A. K. Likhoded, A. V. Luchinsky, S. V. Poslavsky, Phys. Rev. D 90, 074021 (2014).
-
[103]
A. Berezhnoy et al., Phys. Rev. D 84,094023 (2011),
doi:10.1103/PhysRevD.84.094023. -
[104]
A. V. Berezhnoy et al., Phys. Rev. D 86, 034004 (2012),
doi:10.1103/PhysRevD.86.034004. - [105] CMS Collab. (V. Khachatryan et al.), J. High Energy Phys. 05, 013 (2017).
-
[106]
P. Ko et al., J. High Energy Phys. 1101, 070 (2011),
doi:10.1007/JHEP01(2011)070. -
[107]
E. L. Berger, C. B. Jackson, and G. Shaughnessy, Phys. Rev. D 81, 014014 (2010),
doi:10.1103/PhysRevD.81.014014. -
[108]
S. P. Baranov et al., Phys. Rev. D 87, 034035 (2013),
doi:10.1103/PhysRevD.87.034035. -
[109]
A. V. Berezhnoy et al., Phys. Rev. D 87, 054023 (2013),
doi:10.1103/PhysRevD.87.054023. -
[110]
K. Yi, Int. J. Mod. Phys. A 28, 1330020 (2013),
doi:10.1142/S0217751X13300202. -
[111]
D0 Collab. (V. M. Abazov et al.), Phys. Rev. D 90, 111101 (2014),
doi:10.1103/PhysRevD.90.111101. -
[112]
D0 Collab. (V. M. Abazov et al.), Phys. Rev. Lett. 116, 082002 (2016),
doi:10.1103/PhysRevLett.116.082002. -
[113]
CMS Collab. (S. Chatrchyan et al.), J. High Energy Phys. 03, 032 (2014),
doi:10.1007/JHEP03(2014)032. -
[114]
ATLAS Collab. (G. Aad et al.), New J. Phys. 15, 033038 (2013),
doi:10.1088/1367-2630/15/3/033038. - [115] D0 Collab. (V. M. Abazov et al.), Phys. Rev. D 93, 052008 (2016).
- [116] D0 Collab. (V. M. Abazov et al.), Phys. Rev. D 89, 072006 (2014).
-
[117]
CMS Collab. (S. Chatrchyan et al.), Phys. Rev. Lett. 109, 121801 (2012),
doi:10.1103/PhysRevLett.109.121801. -
[118]
BELLE Collab.(S.-K. Choi et al., Phys. Rev. Lett. 91, 262001 (2003),
doi:10.1103/PhysRevLett.91.262001. -
[119]
CMS Collabroation (S. Chatrchyan et al.), J. High Energy Phys. 1304 154 (2013),
doi:10.1007/JHEP04(2013)154. -
[120]
CMS Collab. (S. Chatrchyan et al.), Phys. Lett. B 727 57 (2013),
doi:10.1016/j.physletb.2013.10.016. - [121] CMS Collab., CMS-PAS-FSQ-13-009, https://cds.cern.ch/record/2147428.