Giant Metrewave Radio Telescope monitoring of the black hole X-ray binary, V404 Cygni, during its June 2015 outburst
Abstract
We report results from a Giant Metrewave Radio Telescope (GMRT) monitoring campaign on the black hole X-ray binary V404 Cygni during its 2015 June outburst. The GMRT observations were carried out at observing frequencies of 1280, 610, 325 and 235 MHz, and extended from June 26.89 UT (a day after the strongest radio/X-ray outburst) to July 12.93 UT. We find the low-frequency radio emission of V404 Cygni to be extremely bright and fast-decaying in the outburst phase, with an inverted spectrum below 1.5 GHz and an intermediate X-ray state. The radio emission settles to a weak, quiescent state days after the outburst, with a flat radio spectrum and a soft X-ray state. Combining the GMRT measurements with flux density estimates from the literature, we identify a spectral turnover in the radio spectrum at GHz on June 26.9 UT, indicating the presence of a synchrotron self-absorbed emitting region. We use the measured flux density at the turnover frequency with the assumption of equipartition of energy between the particles and the magnetic field to infer the jet radius ( cm), magnetic field ( G), minimum total energy ( ergs) and transient jet power ( erg s-1). The relatively low value of the jet power, despite V404 Cygni’s high black hole spin parameter, suggests that the radio jet power does not correlate with the spin parameter.
Subject headings:
radiation mechanisms: non-thermal — relativistic processes — black hole physics — stars: individual (V404 Cygni)1. Introduction
Black hole X-ray binaries (BHXBs) are systems in which a black hole accretes matter from a low mass () Roche lobe-filling companion (e.g. Remillard & McClintock, 2006). BHXBs have very different X-ray properties, in terms of luminosity and spectral shape, depending on their state. Typical BHXBs spend most of their time in a quiescent state, with a low X-ray luminosity erg s-1, i.e. , and a non-thermal, “hard” X-ray spectrum. They are believed to go into an outburst state when the accretion rate increases by a few orders of magnitude, e.g., when an instability is triggered in the accretion disk (e.g. Remillard & McClintock, 2006; Fender & Gallo, 2014). The outburst states contain both a thermal and a non-thermal X-ray component, and are usually classified as “hard” (low luminosity, dominated by the non-thermal component), “soft” (high luminosity, dominated by the thermal component), and “very high” or “steep power law” (high luminosity, containing both thermal and non-thermal components, and with a steep photon index, ) (e.g. Remillard & McClintock, 2006; Belloni & Motta, 2016).
Radio emission from BHXBs is believed to arise from jets, and to be closely connected to the black hole accretion properties (e.g. Fender & Gallo, 2014). Weak, flat-spectrum radio emission is sometimes seen in the low-accretion, quiescent state of a BHXB, probably arising from a steady compact jet. As the accretion rate increases, and a BHXB moves from quiescence to the low-hard state, the radio emission steadily increases while retaining its flat spectrum (Fender, 2006). In the low-hard state, a remarkable correlation between radio and X-ray luminosities has been seen over more than three orders of magnitude in X-ray luminosity (e.g. Corbel et al., 2008, 2013), although recent observations suggest the possibility of two separate tracks in this correlation (Fender & Gallo, 2014) This can be naturally explained in a “jet-accretion coupling” scenario where the X-ray emission arises from a hot accretion flow, while the radio emission stems from relativistic electrons in a jet (Fender, 2006). The spectrum remains flat at GHz frequencies in the low-hard state, probably due to self-absorption by moderately relativistic electrons at different radii (e.g. Foster et al., 1996).
When the X-ray luminosity crosses erg s-1, BHXBs typically transition from a low-hard state to a high-soft state, dominated by thermal X-ray emission. This transition phase is marked by the brightest radio flares (e.g. Fender & Gallo, 2014). This has been explained as arising due to a transition from a state with a steady radio jet to one with no jet, possibly with a transient increase in the jet Lorentz factor that gives rise to shocks within the flow, and hence, to increased radio emission (Fender et al., 2004). In such outbursts, discrete expanding radio-emitting regions have been observed on either side of the central BHXB (e.g. Mirabel & Rodríguez, 1994; Tingay et al., 1995). The radio spectrum at frequencies above a few GHz evolves from optically-thick to optically-thin, perhaps due to an expanding emission region (van der Laan, 1966). Finally, when the BHXB enters the high-soft state, the radio emission significantly reduces, suggesting that the radio jet is no longer active.
| Mean date of | MJD | Days since | Central | No. of | On-source | Resolution | RMS noise | Flux densityaaThe quoted errors include measurement errors, and uncertainties in the flux density scale and in the ratio of the system temperatures on V404 Cygni (catalog ) and the flux calibrators. The upper limits are at significance. |
|---|---|---|---|---|---|---|---|---|
| obsn. (UT) | outburstbbDays since the outburst on 2015 June 15.77 UT (MJD 57188.77). | frequency (MHz) | antennasccThe number of working GMRT antennas at the observing frequency. | time (m) | () | mJy | mJy | |
| 2015 June 26.89 | 57199.89 | 11.12 | 1280 | 14 | 90 | |||
| 2015 June 26.89 | 57199.89 | 11.12 | 610 | 12 | 90 | |||
| 2015 June 26.89 | 57199.89 | 11.12 | 235 | 12 | 90 | |||
| 2015 June 27.96 | 57200.96 | 12.19 | 325 | 28 | 120 | |||
| 2015 July 01.93 | 57204.93 | 16.16 | 1280 | 10 | 186 | |||
| 2015 July 01.93 | 57204.93 | 16.16 | 610 | 15 | 180 | |||
| 2015 July 01.93 | 57204.93 | 16.16 | 235 | 13 | 180 | |||
| 2015 July 07.04 | 57210.04 | 21.27 | 1280 | 13 | 55 | |||
| 2015 July 07.04 | 57210.04 | 21.27 | 610 | 14 | 54 | |||
| 2015 July 07.04 | 57210.04 | 21.27 | 235 | 11 | 54 | |||
| 2015 July 11.02 | 57214.02 | 25.25 | 1280 | 13 | 96 | |||
| 2015 July 11.02 | 57214.02 | 25.25 | 610 | 12 | 97 | |||
| 2015 July 12.65 | 57215.65 | 26.88 | 610 | 26 | 68 | |||
| 2015 July 12.65 | 57215.65 | 26.88 | 235 | 24 | 38 | |||
| 2015 July 12.93 | 57215.93 | 27.16 | 1280 | 13 | 180 | |||
| 2015 July 12.93 | 57215.93 | 27.16 | 610 | 14 | 180 |
A critical ingredient in estimating the total jet power in an outburst is the “break frequency” at which the jet transitions from being optically-thick to optically-thin. Unfortunately, few BHXB outbursts have simultaneous monitoring over a sufficiently wide range of radio frequencies close to an outburst peak to accurately measure the break frequency. This is especially difficult at high frequencies, where the transition to optically-thin behaviour arises at very early times, soon after the outburst. Most estimates of jet power are hence based on single-frequency radio observations, with an assumed low frequency spectral shape; this could imply systematic errors in the jet power estimates.
V404 Cygni (catalog ) is a low-mass BHXB consisting of a black hole of mass , accreting material from a low-mass (), late-type companion star (Khargharia et al., 2010). It has the longest orbital period of all known BHXBs. Due to its proximity (distance kpc; Miller-Jones et al., 2009) and high luminosity, V404 Cygni (catalog ) is an excellent test-bed to study BHXB accretion and is hence regularly monitored for variability. The X-ray monitoring of V404 Cygni (catalog ) revealed a major outburst on 2015 June 15.77 UT (e.g. Barthelmy et al., 2015; Negoro et al., 2015; Kuulkers et al., 2015). This led to extensive follow-up monitoring at all available wavebands, and the discovery of a radio outburst ten days after the initial X-ray transient. Further, a search of archival data with the 2-m Faulkes Telescope North revealed an optical precursor one week prior to the X-ray outburst (Bernardini et al., 2016). An optical spectrum obtained 13 hours prior to the Swift-BAT outburst found spectral lines typical of an accretion disk.
In this article, we present simultaneous Giant Metrewave Radio Telescope (GMRT) multi-frequency monitoring observations of V404 Cygni (catalog ) during the June 2015 event, which allow us to estimate the break frequency within a day of the strongest radio outburst, and hence to estimate the transient jet power. In §2, we detail the observations and data analysis. Our results and interpretations are discussed in §3.
2. Observations and data analysis
Our GMRT monitoring of V404 Cygni (catalog ) began on 2015 June 26.89 UT, with the GMRT antennas split into two sub-arrays, consisting of sixteen antennas tuned to an observing frequency of 1280 MHz (with two polarizations) and the remaining fourteen antennas tuned to the dual 610/235 mode, with observing frequencies of 610 MHz and 235 MHz in the right and left circular polarizations, respectively. This setup was repeated for the observations of 2015 July 01.93 UT and July 07.04 UT. We also observed V404 Cygni (catalog ) on June 27.96 UT at 325 MHz, using the full polar mode, and on July 12.65 UT with the above dual 610/235 mode. Finally, our observations on July 11.02 UT and July 12.93 UT used two sub-arrays, with 16 antennas tuned to 1280 MHz and 14 antennas tuned to 610 MHz, both with two polarizations.
All observations used the GMRT Software Backend as the correlator, with a bandwidth of 33.3 MHz divided into 256 channels, and with 2 second integrations. Observations of the standard calibrators 3C48 or 3C295 at the start and/or the end of the run were used to calibrate the flux density scale and the antenna passband shapes. The compact sources J1924+3329 and J2015+3710 were used as phase calibrators, and observed for 6 minutes before and after each 30-minute scan on the target source.
The initial data editing and calibration used the flagcal software pipeline developed for automatic flagging and calibration of GMRT data (Prasad & Chengalur, 2012). Following this, the analysis used standard procedures for widefield imaging and self-calibration in “classic” AIPS. The flux densities of V404 Cygni (catalog ) at the different observing frequencies were estimated via a single-Gaussian fit to a small region centred on the source in each image, using the AIPS task jmfit.
The original GMRT observations used automatic level controllers (ALCs) to keep the input power levels of the correlator constant. One has to then correct for the fact that antenna gains are inversely proportional to the system temperature, which may be different for different sources. The correction factors were estimated in April and May 2017 by measuring the ratio of system temperatures on V404 Cygni (catalog ) and the flux calibrators with the ALCs switched off. This yielded correction factors of (1280 MHz), (610 MHz), (325 MHz) and (235 MHz). The measured flux densities from jmfit were scaled by the above correction factors to obtain the final flux densities at each frequency.
| Mean date of | MJD | Days since | Spectral index | Spectral indexaaHere is the spectral index between 235 MHz and 610 MHz and is the spectral index between 610 MHz and 1280 MHz. |
|---|---|---|---|---|
| obsn. (UT) | outburstaaHere is the spectral index between 235 MHz and 610 MHz and is the spectral index between 610 MHz and 1280 MHz. | bbDays since the outburst on 2015 June 15.77 UT (MJD 57188.77). | bbDays since the outburst on 2015 June 15.77 UT (MJD 57188.77). | |
| 2015 June 26.89 | 57199.89 | 11.12 | ||
| 2015 July 01.93 | 57204.93 | 16.16 | ||
| 2015 July 11.02 | 57214.02 | 25.25 | ||
| 2015 July 12.65 | 57215.65 | 26.88 | ||
| 2015 July 12.93 | 57215.93 | 27.16 |
The uncertainty in the flux densities was estimated by measuring the flux densities of three random bright point sources in the field of view at different epochs, at the same frequency. We find that the flux densities of these sources at different epochs match within % and infer that systematic errors contribute an uncertainty of % to our flux density estimates. Our final errors on the flux density of V404 Cygni (catalog ) were obtained by summing (in quadrature) the measurement error from the single-Gaussian fits and the two sources of systematic error in the flux density scale, % from the flux density variations between epochs and % from the corrections for the different system temperatures between V404 Cygni (catalog ) and the calibrators. Table 1 lists the details and the results of the various GMRT observations.
We searched for intra-epoch variability on time scales of minutes in the two epochs immediately after the outburst of June 25. For the run on June 26, this was done by splitting each visibility dataset (at each frequency) into 15-minute chunks, and then carrying out the imaging and self-calibration procedure for each 15-minute piece independently. For the 325 MHz observing run on June 27, the search for variability was carried out on time scales of 30 minutes. The flux densities of V404 Cygni (catalog ) from the different m intervals were found to be consistent (within significance) with each other. No evidence for intra-observation variability in V404 Cygni (catalog ) was seen in the GMRT data at any epoch.
3. Results and Discussion
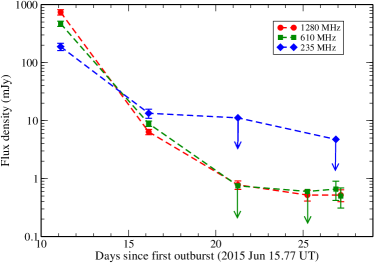
Our GMRT monitoring of V404 Cygni (catalog ) began on June 26.89 UT, 11.08 days after the first major X-ray outburst of June 2015, and within a day of the brightest X-ray flare (on June 25.93 UT; Segreto et al., 2015; Trushkin et al., 2015b; Radhika et al., 2016). Fig. 1 shows the GMRT light curves of V404 Cygni (catalog ) at 235, 610 and 1280 MHz. The radio emission was found to be very bright at the first epoch, followed by a rapid decline at all three frequencies, with the decline steepest at 1280 MHz and slowest at 235 MHz. The 1280 MHz flux density decreases by a factor of within days of our first observing epoch, while the 610 and 235 MHz flux densities decrease by factors of and , respectively, over the same period.
Fig. 3[A] plots the spectrum of V404 Cygni (catalog ) at three representative epochs, June 26.89 UT, July 01.93 UT, and July 12.93 UT, , , and days after the original outburst. A change in the spectral shape is clearly present, in addition to the decline in the flux density with time. Fig. 3[B] and Table 2 show the temporal evolution of the spectral index (defined by , where is the flux density at the frequency ), evaluated between 235 MHz and 610 MHz (), and 610 MHz and 1280 MHz (). The spectrum is clearly inverted on June 26.89 UT, with positive spectral indices, and , indicating that the radio outburst is in the optically-thick regime at the GMRT frequencies. Further, the fact that suggests that the spectrum is likely to turn over at frequencies slightly above 1.28 GHz. The spectrum is much flatter by July 01.93 UT, with and . The spectrum remains flat at later epochs, with a decline in the flux density.
The X-ray monitoring of V404 Cygni (catalog ) during June and July 2015 is discussed in detail by Radhika et al. (2016) and Plotkin et al. (2017). Radhika et al. (2016) find that V404 Cygni (catalog ) was in the hard X-ray state for days after the initial outburst of June 15.77 UT, then in an intermediate state for 9 days, before moving into the soft state on around June 27 UT. The bright radio flares of June 19, June 22 and June 25 all arise during the intermediate state. Plotkin et al. (2017) find that the X-ray spectrum continued to soften during July, with an X-ray luminosity that decreased (albeit non-monotically) with time. The first epoch of GMRT monitoring of June 26.89 UT was thus in the intermediate X-ray state, while all later GMRT epochs were in the soft state. This is consistent with the observed change in the GMRT spectral index, from highly inverted at the first epoch (due to the transient radio jet or ejected plasmon being in the optically-thick regime at the low GMRT frequencies) to flat at later epochs, when V404 Cygni (catalog ) was in the soft state.
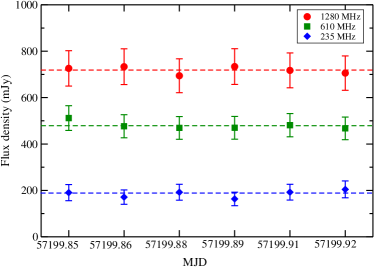
Fig. 2 shows the flux densities measured at our three observing frequencies over different 15-minute intervals during our -hour observing run of June 26. We note that the error bars on each measurement include the systematic errors on the flux scale discussed in the previous section. No evidence for intra-epoch variability is apparent in the data, over the hour duration of the GMRT observations.
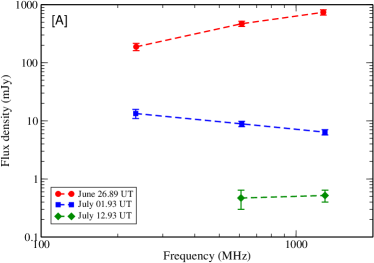
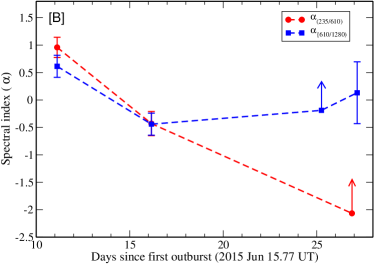
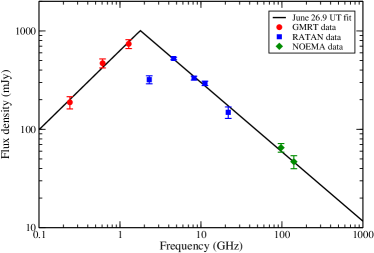
Fig. 4 shows the spectrum of V404 Cygni (catalog ) obtained from near-simultaneous (within days) measurements between 235 MHz and 140.5 GHz on June 26.9 UT. Besides the low-frequency GMRT data (on June 26.89 UT), the figure includes high-frequency flux density estimates from the RATAN-600 telescope (at 2.3, 4.6, 8.2, 11.2 and 21.7 GHz, on June 26.93 UT; Trushkin et al., 2015a, b) and from the NOrthern Extended Millimeter Array (NOEMA; at 97.5 GHz and 140.5 GHz, on June 27.00 UT; Tetarenko et al., 2015). It should be emphasized that the different observations are at slightly different observing times, within a hour period; the GMRT and the RATAN-600 observations overlap with each other, while the NOEMA observing session took place slightly later. While no evidence was obtained for variability in the GMRT data over a similar observing period (see Fig. 2), we cannot rule out the possibility of variability in the high-frequency data on similar timescales. For example, Tetarenko et al. (2017) find evidence of far more short-term variability at high frequencies ( GHz) than at low frequencies ( GHz), during a simultaneous multi-frequency monitoring campaign. The possibility of high-frequency variability should be treated as a caveat in the results below. However, the RATAN-600 high-frequency observations overlap with the GMRT run, and very similar results are obtained on excluding the higher-frequency NOEMA data, which are more offset in time, from our analysis.
The spectrum of Fig. 4 shows clear evidence for a spectral turnover below GHz. Interestingly, the RATAN-600 measurements at GHz and GHz suggest that there may be an additional spectral turnover at GHz, followed by a rise in the spectrum at GHz. We emphasize that the evidence for this second turnover is quite tentative, since it is effectively based on a single RATAN-600 2.3 GHz data point. If correct, the second turnover would suggest that the radio emission arises from two synchrotron self-absorbed regions, perhaps due to two separate radio outbursts.
Most attempts to separate between the two standard mechanisms for radio jet launching and collimation, the Blandford-Znajek “spin-powered” model (Blandford & Znajek, 1977) and the Blandford-Payne “accretion-powered” model (Blandford & Payne, 1982) are based on the expected correlation between the total jet power and the black hole spin parameter in the former class of models. Tentative claims, using a handful of BHXBs, have been made for a relation between the transient jet ejection energy or luminosity and the black hole spin (e.g. Fender et al., 2010; Narayan & McClintock, 2012; Steiner et al., 2013), but it has also been argued that no single relation exists between the transient jet power and the spin parameter (Russell et al., 2013).
An estimate of the flux density at the turnover frequency between the optically-thick and optically-thin regimes can be used, along with assumed equipartition between the particle energy and the magnetic field energy, to determine the radius of the radio jet, the magnetic field strength , and the total jet power in a radio flare (e.g. Pacholczyk, 1970; Chevalier, 1998; Barniol Duran et al., 2013). Of course, the data of June 26.9 UT indicate two synchrotron self-absorbed regions, with two turnover frequencies. However, there is only a single flux density measurement in the trough between the two peaks, and the shape of the spectrum is not well constrained. We hence chose to fit the spectrum with a function of the form
| (1) |
Our best-fit model, with reduced , yields power-law indices , , a turnover frequency of GHz, and a flux density mJy at the turnover frequency. This fit is indicated by the solid line in Fig. 4. We note, in passing, that all the flux density measurements between 235 MHz and 140 GHz, except for the 2.3 GHz data point, appear well-fit by our simple model; this suggests that high-frequency variability is unlikely to be a serious issue.
A critical question in the “equipartition method” is whether the outflowing plasma is moving at relativistic speeds (e.g. Barniol Duran et al., 2013). In the case of BHXBs, typical estimates of the bulk Lorentz factor lie in the range (e.g. Hjellming & Johnston, 1981; Hjellming & Rupen, 1995). Indeed, for V404 Cygni (catalog ), the bulk speeds of multiple early outflows in the June 2015 outburst have been found to be low, (Tetarenko et al., 2017). We will hence assume that the outflowing plasma is moving non-relativistically, using the Newtonian expressions (Barniol Duran et al., 2013) to estimate , , and the minimum total energy . We note the caveat that it is possible that the jet speeds were variable in the ejections (e.g. Tetarenko et al., 2017), which would affect the estimates below.
Assuming a self-absorbed synchroton-emitting plasma in a non-relativistic outflow with a power-law distribution of electron energies with a spectral index , we use equations (16) and (19) of Barniol Duran et al. (2013) and the known distance to V404 Cygni (catalog ) (2.39 kpc; Miller-Jones et al., 2009) to estimate , , and from the values of and . This yields cm, G and erg. The estimated jet radius during the outburst phase is similar to the size of the quiescent radio jet in V404 Cygni (catalog ), cm (Miller-Jones et al., 2008; Plotkin et al., 2017). Note that assuming or including a second synchrotron self-absorbed component would not significantly increase the energy estimate.
The above estimate of the minimum total energy assumes that all the particle energy is in the electrons, which is unlikely to be the case (e.g. Barniol Duran et al., 2013). In the case of shock-heated gas, observations suggest that the energy in hot protons is likely to be about an order of magnitude larger than that in the electrons (e.g. Panaitescu & Kumar, 2002; Barniol Duran et al., 2013). Assuming that the energy in the protons is ten times larger than that in the electrons yields a total minimum energy of erg and an equipartition magnetic field of G.
To estimate the minimum jet power in the flare from the minimum total energy , we need to know the time since the onset of the flare. The brightest X-ray flare from V404 Cygni (catalog ) in the June 2015 outburst occurred on June 25.93 UT, approximately a day before our first GMRT observations, and this was accompanied by a radio outburst detected with the RATAN-600 telescope (Trushkin et al., 2015a, b). We hence assume that , to obtain a total minimum jet power of erg s-1, again assuming that the energy in hot protons is an order of magnitude larger than that in electrons.
The mass of the black hole in V404 Cygni (catalog ) is (Khargharia et al., 2010), implying an Eddington luminosity of erg s-1. The ratio of transient jet power to Eddington luminosity is thus quite low for the brightest flare of the June 2015 outburst, Log. Similarly low jet powers were obtained for V404 Cygni (catalog ) in the June 2015 outburst by Tetarenko et al. (2017), based on their simultaneous multi-frequency observations of June 22.
The black hole spin of V404 Cygni (catalog ) has recently been estimated to be via reflection modelling of NuStar X-ray data (Walton et al., 2017) on the June 2015 outburst. While V404 Cygni (catalog )’s spin parameter estimate lies at the upper end of the distribution of known BHXB spin parameters, it can be seen from Fig. 1 of Russell et al. (2013) that our estimate of the transient jet power for the flare of June 25 is the lowest of the transient jet power estimates. Our results for V404 Cygni (catalog ) support earlier studies that suggest that the jet power does not correlate with the black hole spin parameter (e.g. Fender et al., 2010; Russell et al., 2013). However, we note that V404 Cygni (catalog ) may well be a unique BHXB, with results for this system non-canonical in nature.
The radio emission of V404 Cygni (catalog ) has been found to show rapid intra-day variability in the quiescent state (e.g. Rana et al., 2016; Plotkin et al., 2017). For example, Plotkin et al. (2017) found evidence of strong intra-day variability in the last of their VLA monitoring sessions, on August 5, 2015, weak evidence of variability (at significance) on August 1, 2015, and no evidence of variability on July 28, 2015. We find no evidence of such intra-day variability in our observations of June 26 and 27, within two days of the outburst of June 25.93 UT. Interestingly, Tetarenko et al. (2017) found much more temporal structure in their high-frequency ( GHz) data than in their low-frequency ( GHz) data, in a simultaneous monitoring campaign covering GHz on June 22 UT. The low-frequency light curves appeared to be smoothed, delayed versions of the high-frequency light curves, consistent with a model of multiple expanding jet ejection events (Tetarenko et al., 2017). Our non-detections of variability in the low-frequency GMRT data on June 26 UT and later epochs are also consistent with such a model.
In summary, we report low-frequency GMRT monitoring of the BHXB V404 Cygni (catalog ) over June 26.89 UT to July 12.93 UT, 2015, beginning a day after the strongest X-ray and radio flare in the June 2015 outburst. The spectrum shows clear evidence of synchrotron self-absorption on June 26.9 UT, with two peaks between GHz, suggesting two self-absorbed regions, perhaps arising from two outbursts. The low-frequency radio spectrum flattens at later times, as V404 Cygni (catalog ) moves to the quiescent state. Assuming energy equipartition between the particles and the magnetic field, and a non-relativistic outflow, we infer a jet radius of cm, a magnetic field of G, and a total (minimum) jet power of erg s-1, assuming that the bulk of the particle energy is in hot protons. Our estimate of the transient jet power is relatively low, Log, despite the high black hole spin parameter, supporting earlier results that the radio jet power does not correlate with the spin parameter.
References
- Barniol Duran et al. (2013) Barniol Duran, R., Nakar, E., & Piran, T. 2013, ApJ, 772, 78
- Barthelmy et al. (2015) Barthelmy, S. D., Beardmore, A. P., Kennea, J. A., Marshall, F. E., Page, K. L., & Siegel, M. H. 2015, GRB Coordinates Network, 17929
- Belloni & Motta (2016) Belloni, T. M. & Motta, S. E. 2016, Astrophysics of Black Holes: From Fundamental Aspects to Latest Developments (ASSL), 440, 61
- Bernardini et al. (2016) Bernardini, F., Russell, D. M., Shaw, A. W., et al. 2016, ApJ, 818, L5
- Blandford & Payne (1982) Blandford, R. D. & Payne, D. G. 1982, MNRAS, 199, 883
- Blandford & Znajek (1977) Blandford, R. D. & Znajek, R. L. 1977, MNRAS, 179, 433
- Chevalier (1998) Chevalier, R. A. 1998, ApJ, 499, 810
- Corbel et al. (2013) Corbel, S., Coriat, M., Brocksopp, C., Tzioumis, A. K., Fender, R. P., Tomsick, J. A., Buxton, M. M., & Bailyn, C. D. 2013, MNRAS, 428, 2500
- Corbel et al. (2008) Corbel, S., Koerding, E., & Kaaret, P. 2008, MNRAS, 389, 1697
- Fender (2006) Fender, R. 2006, Jets from X-ray binaries, 381
- Fender & Gallo (2014) Fender, R. & Gallo, E. 2014, SSRv, 183, 323
- Fender et al. (2004) Fender, R. P., Belloni, T. M., & Gallo, E. 2004, MNRAS, 355, 1105
- Fender et al. (2010) Fender, R. P., Gallo, E., & Russell, D. 2010, MNRAS, 406, 1425
- Foster et al. (1996) Foster, R. S., Waltman, E. B., Tavani, M., Harmon, B. A., Zhang, S. N., Paciesas, W. S., & Ghigo, F. D. 1996, ApJL, 467, L81
- Hjellming & Johnston (1981) Hjellming, R. M. & Johnston, K. J. 1981, ApJL, 246, L141
- Hjellming & Rupen (1995) Hjellming, R. M. & Rupen, M. P. 1995, Nature, 375, 464
- Khargharia et al. (2010) Khargharia, J., Froning, C. S., & Robinson, E. L. 2010, ApJ, 716, 1105
- Kuulkers et al. (2015) Kuulkers, E., Motta, S., Kajava, J., Homan, J., Fender, R., & Jonker, P. 2015, The Astronomer’s Telegram, 7647
- Miller-Jones et al. (2008) Miller-Jones, J. C. A., Gallo, E., Rupen, M. P., Mioduszewski, A. J., Brisken, W., Fender, R. P., Jonker, P. G., & Maccarone, T. J. 2008, MNRAS, 388, 1751
- Miller-Jones et al. (2009) Miller-Jones, J. C. A., Jonker, P. G., Dhawan, V., Brisken, W., Rupen, M. P., Nelemans, G., & Gallo, E. 2009, ApJL, 706, L230
- Mirabel & Rodríguez (1994) Mirabel, I. F. & Rodríguez, L. F. 1994, Nature, 371, 46
- Narayan & McClintock (2012) Narayan, R. & McClintock, J. E. 2012, MNRAS, 419, L69
- Negoro et al. (2015) Negoro, H., et al. 2015, The Astronomer’s Telegram, 7646
- Pacholczyk (1970) Pacholczyk, A. G. 1970, Radio astrophysics. Nonthermal processes in galactic and extragalactic sources
- Panaitescu & Kumar (2002) Panaitescu, A. & Kumar, P. 2002, ApJ, 571, 779
- Plotkin et al. (2017) Plotkin, R. M., et al. 2017, ApJ, 834, 104
- Prasad & Chengalur (2012) Prasad, J. & Chengalur, J. 2012, Experimental Astronomy, 33, 157
- Radhika et al. (2016) Radhika, D., Nandi, A., Agrawal, V. K., & Mandal, S. 2016, MNRAS, 462, 1834
- Rana et al. (2016) Rana, V., et al. 2016, ApJ, 821, 103
- Remillard & McClintock (2006) Remillard, R. A. & McClintock, J. E. 2006, ARA&A, 44, 49
- Russell et al. (2013) Russell, D. M., Gallo, E., & Fender, R. P. 2013, MNRAS, 431, 405
- Segreto et al. (2015) Segreto, A., Del Santo, M., D’Aí, A., La Parola, V., Cusumano, G., Mineo, T., & Malzac, J. 2015, The Astronomer’s Telegram, 7755
- Steiner et al. (2013) Steiner, J. F., McClintock, J. E., & Narayan, R. 2013, ApJ, 762, 104
- Tetarenko et al. (2015) Tetarenko, A., Sivakoff, G. R., Bremer, M., Miller-Jones, J. C., Mooley, K., Fender, R., Staley, T., & Anderson, G. 2015, The Astronomer’s Telegram, 7740
- Tetarenko et al. (2017) Tetarenko, A. J., et al. 2017, MNRAS (in press), (arXiv:1704.08726)
- Tingay et al. (1995) Tingay, S. J., et al. 1995, Nature, 374, 141
- Trushkin et al. (2015a) Trushkin, S. A., Nizhelskij, N. A., & Tsybulev, P. G. 2015a, The Astronomer’s Telegram, 7716
- Trushkin et al. (2015b) Trushkin, S. A., Nizhelskij, N. A., & Tybulev, P. G. 2015b, The Astronomer’s Telegram, 7667
- van der Laan (1966) van der Laan, H. 1966, Nature, 211, 1131
- Walton et al. (2017) Walton, D. J., et al. 2017, ApJ, 839, 110