Overdense microwave plasma heating in the CNT stellarator
Abstract
Overdense plasmas have been attained with 2.45 GHz microwave heating in the low-field, low-aspect-ratio CNT stellarator. Densities higher than four times the ordinary (O) mode cutoff density were measured with 8 kW of power injected in the O-mode and, alternatively, with 6.5 kW in the extraordinary (X) mode. The temperature profiles peak at the plasma edge. This was ascribed to collisional damping of the X-mode at the upper hybrid resonant layer. The X-mode reaches that location by tunneling, mode-conversions or after polarization-scrambling reflections off the wall and in-vessel coils, regardless of the initial launch being in O- or X-mode. This interpretation was confirmed by full-wave numerical simulations. Also, as the CNT plasma is not completely ionized at these low microwave power levels, electron density was shown to increase with power. A dependence on magnetic field strength was also observed (for O-mode launch) and discussed.
1 Introduction
The need for high triple product and desire for high plasma in fusion experiments translate into a simultaneous requirement for high densities and temperatures. In devices with relatively low magnetic fields, this implies that the ratio of the electron plasma frequency to the electron cyclotron frequency might exceed unity. In this case, the plasma may not admit the propagation of electromagnetic waves in the electron cyclotron frequency range. Thus, if electron cyclotron heating (ECH)[1] is desired, overdense heating techniques become necessary.
One common overdense heating mechanism involves mode-conversion of electromagnetic to electron Bernstein waves (EBWs) inside the plasma, because EBW propagation does not suffer from upper density limits.[2] Three techniques are commonly employed in tokamaks, spherical tokamaks, stellarators and reversed field pinches.
In the SX-B scheme, implemented for example on WT-3[3], COMPASS-D [4] and LHD,[5] a wave launched from the high-field side in the slow extraordinary (SX) mode converts to an EBW upon reaching the upper hybrid resonance (UHR).
In the FX-B scheme, a fast X-mode launched from the low-field side impinges on its cutoff and mode-converts to an EBW at the UHR after “tunneling” through a narrow region of evanescence. This scheme has been implemented for example on CHS [6] and MST.[7]
In the O-X-B scheme,[8] a wave is launched from the low-field side in the ordinary (O) mode in a special direction, such that it reaches the cutoff layer with an optimal value of refractive index parallel to the magnetic field, , and with =0, where denotes the direction orthogonal to the local magnetic field and density gradient. This special incidence facilitates conversion to the SX mode, which in turn converts to an EBW at the UHR. This has been realized for example in W7-AS[9] and TCV[10], and is planned for Heliotron J[11].
Overdense heating has also been achieved in small low-field devices such as TJ-K[12] and WEGA.[13] In these experiments, the vacuum wavelength associated with is on the order of the plasma minor radius . While propagation and damping are more difficult to analyze in this regime, full-wave modeling verified successful O-X mode conversion in WEGA,[13] and confirmed collisional heating at the UHR as the dominant mechanism in TJ-K.[12]
The low field, low aspect ratio CNT stellarator[14] can be viewed as a further extension of this long-wavelength regime. CNT was originally dedicated to non-neutral and quasi-neutral plasma research,[15, 16] but has recently been re-purposed to investigate fusion-relevant problems such as error field analysis,[17] high- stability,[18] and inversion of stellarator images.[19] As part of this, it was equipped with microwave heating at 2.45 GHz. The corresponding vacuum wavelength, cm, is comparable with the plasma minor radius cm and about one-third of the major radius cm. On this scale, the broad launched microwave beam strikes a broad region of the plasma at a range of incident angles and polarizations. This variation has been limited to some extent in CNT by placing a waveguide very close to the plasma edge. However, no focusing element was used in this initial study. Also, the launch system was not yet optimized for any particular overdense heating mechanism.
In spite of this, plasmas were attained in CNT that were overdense to O-mode propagation by factors of more than 4, as shown in the present paper. Sec. 2 describes the heating and diagnostic systems employed for this work. Profiles of density and temperature confirmed overdense heating for both O- and X-mode launch. These profiles are presented in Sec. 3 alongside a study of their dependence on power and magnetic field. Sec. 4 describes the full-wave numerical method used to interpret the experimental results. Interpretations are discussed in Sec. 5.
2 Experimental setup
2.1 Heating system
The microwave heating system is shown schematically in Fig. 1. The microwave source is a 10 kW, 2.45 GHz magnetron manufactured by Muegge. At full power, its output is CW. Reduced power (in a time-averaged sense) is obtained by pulsed operation at roughly 5 kHz: the lower the duty-cycle, the lower the averaged output power. The magnetron launcher excites the mode (Fig. 1b) in a rectangular waveguide.

A three-stub tuner controls the percentage of power coupled to the plasma, and the reflected power is absorbed in a water-cooled isolator upstream of the tuner (not shown). The power injected in the vessel is determined by the difference of the forward and reflected power as measured by a pair of Schottky diodes fixed to a dual directional coupler. This net injected power is an upper bound for the power actually deposited in the plasma. The rest is dissipated on the resistive walls or leaks out of the vessel through few unshielded ports, after multiple reflections off the walls.
Downstream of the tuner is a twistable, flexible rectangular waveguide followed by a rectangular-to-circular taper that can rotate freely on the flange on its circular side. The polarization is linear in the mode in the rectangular waveguide (Fig. 1b). This is tapered into the mode in the circular waveguide (Fig. 1c), which is also linearly polarized, to some approximation. By choosing the correct orientation of the twistable, flexible waveguide and of the rotatable taper, one can rotate the wave electric field relative to the magnetic field. This allows selecting the O- or X-mode as the dominant polarization injected in the plasma. The nominal O and X polarizations referred to below are not pure because, due to oblique injection, the actual O and X eigenmodes are elliptically polarized. This can be quantified by the complex ratio of the wave electric field components orthogonal to the direction of propagation. From the Appleton-Hartree dispersion, we calculate on the beam axis, for O-mode propagation and magnetic field mT, discussed below. Different values apply elsewhere on the wavefront, due to beam divergence and magnetic field curvature. Nonetheless, the value provided gives an order of magnitude of the lack of modal purity.
Following the taper is the launch antenna: a section of circular waveguide that leads into the vacuum vessel up to near the plasma edge. The launch antenna is effectively a re-entrant port, held at atmospheric pressure to avoid unwanted breakdown and plasma formation within the waveguide, at locations where the wave-frequency equals high-order EC harmonics. Such plasma would partly absorb or fully reflect the high-power microwaves in the waveguide, before they reach the stellarator plasma. Both effects are undesired. A quartz window at the end of the launch antenna functions as the vacuum break.
A schematic of the orientation of the launch antenna relative to the plasma is shown in Fig. 2. The 2.45 GHz Gaussian beam is also depicted, and contours mark the first and second harmonics of the EC frequency ( mT and 43.8 mT, respectively). This cross-section of the non-axisymmetric CNT plasma was selected due to its “tokamak-like” appearance, in the sense that, at that location, decreases monotonically with the major radius , so that the beam can be launched from the low-field side. Due to lack of port access in the midplane of the toroidal plasma (which is actually vertically oriented in the laboratory frame), the antenna enters from a port slightly above the midplane, and is angled such that its axis intersects the vacuum magnetic axis.

To help select the desired polarization (parallel or perpendicular to the magnetic field), the magnetic axis is visualized by means of a hot-cathode [20] before the microwave discharge. Note that the field’s pitch angle, when viewed through the waveguide, changes by less than between the axis and the edge.
2.2 Diagnostics
The primary plasma diagnostic used in this work was an array of Langmuir probes similar to what was used to diagnose non-neutral plasmas in CNT.[15] The probe tips are made of halogen light bulbs with the glass removed to expose the tungsten filaments. The tips are mounted on a ceramic rod which can be moved longitudinally into and out of the plasma with an edge-welded bellows drive actuated by a recently installed stepping motor, at a speed of 1 cm/s. The probe enters the plasma in a wide cross-section and therefore must move about 30 cm to scan from the edge to the axis (the average minor radius is 13 cm). For comparison, plasma discharges may last up to 45 s, limited by the heating of the coils, although more typical discharges of only 8-10 s are examined here. The probe array intersects the plasma between and , far from the launch antenna which aims at .
Electron temperature and density were determined from probe current-voltage characteristics , obtained by sweeping the probe bias with a repetition rate of 200 Hz (that is, every 5 ms). The steady-state measurements reported in this paper were derived from averaging 0.25 - 0.5 s of data.
The effective minor radius (flux coordinate) of the probe at each longitudinal position was determined using an electron beam/phosphor rod technique commonly used to visualize flux surfaces.[17, 21, 22] In this case, the probe itself emitted the electron beam, and the flux surface images were aligned with previous measurements, thereby associating each probe position with a three-dimensional flux surface. The geometry of these surfaces is well understood following a diagnosis of CNT’s error fields.[17]
Electron temperature and density are assumed uniform on the flux surfaces. Outside the last closed flux surface (LCFS), however, few measurements are available and the extrapolation of to locations close to the launch window is subject to uncertainties. Models of magnetized plasma sheaths near solid surfaces predict that a magnetic pre-sheath will extend into the plasma by a distance given by the sound speed divided by the ion cyclotron frequency, .[23] Near the window, this distance is of order 1 cm for singly ionized Ar, which is the working gas used in these experiments. The layer in which the density drops has little effect on wave-propagation, due to its thinness compared to the wavelength and other scales of interest. Additionally, that layer is highly underdense to O-mode.
3 Profile measurements: evidence of overdense heating
Microwave plasmas were generated with the heating system described in Sec. 2.1 and diagnosed with the probes of Sec. 2.2, finding evidence of overdense plasma heating.
Electron temperature and density profiles were obtained for various heating powers and magnetic field strengths. Each profile was obtained from a number of discharges realized with the same heating and backfill pressures parameters, while the probe was scanned through the plasma and scrape-off layer. In a typical 8-10 s long discharge, the power gradually increased as the magnetron warmed up, reaching its flat top at = 4 s. However, some plasma parameters were observed to evolve from = 5 s onwards, especially in high-power discharges. Therefore, profile mesurements were restricted to the interval = 4 - 5 s in each discharge. To generate profiles, the probe was radially scanned by 1 cm during that interval, as well as from one discharge to the other. Tests confirmed the discharge-reproducibility to be well within the and error bars.
3.1 Dependence on heating power
3.1.1 O-mode launch

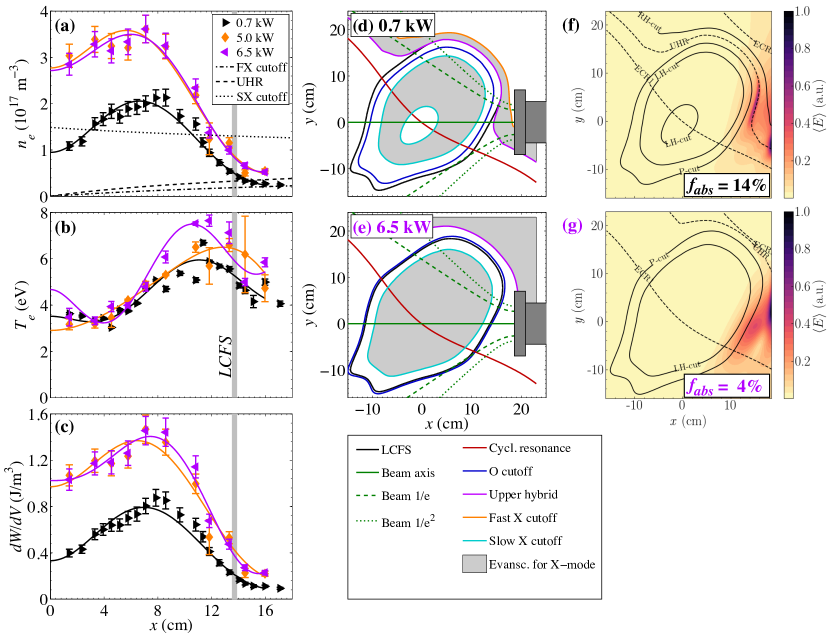
Figs. 3a-b show and profiles for Argon (Ar) plasmas heated with O-mode-launched waves at different heating powers . The profiles were fitted with 7th-order polynomials with the constraint of at =0, for reasons of symmetry.
The backfill pressure was torr in each case. Consequently, the mean-free-path of neutrals before being ionized was cm. As the plasma minor radius was 13 cm, the neutral density was assumed to uniformly evaluate throughout the plasma, corresponding to the backfill pressure.
For the most part, in the cold plasmas considered the Ar atoms were either singly ionized or not ionized at all, and there were very few ions of higher charge. Hence, by quasi-neutrality the ion density was . In turn, plotted in Fig. 3b was comparable with the neutral density just estimated. Consequently, , i.e. the gas was only partly ionized. As a consequence, increasing the heating power did not result solely in heating (higher ), but also in more ionization (higher ), as seen in Figs. 3a-b. Therefore, as a metric of effectiveness of power-coupling to the plasma, it is convenient to also plot, in Figs. 3c,
| (1) |
Here is the Boltzmann constant and is the first ionization potential. For Ar it is = 15.8 eV, clearly not negligible in the enery balance of the partly ionized plasmas of = 2-7 eV presented here. The quantity is the volumetric density of energy deposited in the plasma, expressed in terms of thermal energy of the ions, of the electrons, and energy expended in the ionization process, per unit volume. The assumption was made for the ion temperature in the electron-heated CNT plasma, and discussed in a previous paper [18].
The profiles of and (Fig. 3b-c) peaked at the edge, and peaks were found to depend on the heating power , suggesting power-deposition at the edge.
Density profiles (Fig. 3a) show that nearly the entire plasma was overdense to O-mode propagation, at all power levels. The region of peaking and likely power deposition was also overdense.
Also shown in Fig. 3a is the profile from an earlier nitrogen plasma produced with a rudimentary heating system, consisting of a 1 kW magnetron placed in front of a viewport. Compared to that, in the new experiments increased by over an order-of-magnitude, even when using as little as 0.5 kW (in blue in Fig. 3a). This indicates that the new launcher, closer to the plasma and better aimed, makes a much better use of the injected power, and deposits a much higher fraction of it into the plasma. A further improvement could be brought by a focusing, steerable mirror. Focusing is beneficial in general, and steering of a collimated beam is beneficial for the O-X-B scheme. As for the temperature, also increased with the new launcher, but less significantly (Fig. 3b). This is due to the plasma not being fully ionized, as just discussed. Therefore, it is not surprising that increasing the power coupled to the plasma primarily results in more ionization, i.e. higher .
Figs. 3d-e show contours of cutoffs and resonances in the cross-section defined in Fig. 2. The contours were calculated from the profiles for O-mode launch at the lowest and highest power levels. Also shown are the launch window and the propagation axis and width of the “vacuum microwave beam” (i.e., the microwave beam as it would look in the absence of plasma). As indicated by the O-mode cutoff curves, both cross-sections are almost entirely overdense -thus, evanescent- to the O-mode. However, some O-X conversion may occur and make the lighter-shaded regions partly accessible to the SX mode, up to a “turning point” (not shown) where it bends toward the UHR.
Finally, shown in Figs. 3f-g are full-wave simulations realized with the IPF-FDMC code [24]. These simulations will actually be discussed in Secs. 4-5, but it is convenient to plot them here, next to the experimental profiles (Figs. 3a-c) and accessibility plots (Figs. 3d-e) which they refer to.
3.1.2 X-mode launch
Fig. 4 presents the results of another power scan, for the same Ar gas pressure, but launching an X-mode. The shapes and trends in the , and profiles are similar to the O-mode case. Again, heating seems to occur predominantly at the plasma edge. The low, medium and high power levels were obtained using the same stub tunings as in the O-mode power scan; however, the values of were different. This indicates that X-mode coupling to the plasma differed from O-mode coupling. This was expected, due to the different reflectivity of the plasma to the two modes, which, in turn, is related to the different locations of the O- and X-mode cutoffs. Cutoffs and evanescent regions for the two modes are plotted respectively in Figs. 3d-e and 4d-e.
In generating those figures, and were extrapolated outside the LCFS as discussed in Sec. 2.2. As a result, contours outside the LCFS (based on radial extrapolations) are less accurate than inside the LCFS, which are based on Langmuir probe measurements, although at a different toroidal location, far from the launcher (Fig. 2b). For O-mode launch, this inaccuracy should not impact the analysis because is usually well below cutoff outside the LCFS, hence refraction of the O-mode is negligible and insensitive to relatively small variations. The effect on X-mode propagation might be more significant because outside the LCFS is on the order of the FX cutoff density. Hence, an error in density could switch the medium from overdense to underdense for the X-mode. Yet, even if the region in front of the launcher becomes evanescent for the X-mode, as in the case of Fig. 4d (as opposed to Fig. 4e), finite tunnelling is still possible, provided the region is not too thick.

It should also be noted that, for simplicity, the cutoff and resonant layers in Figs. 4d-g were determined assuming propagation at relative to the magnetic field. This is not the case everywhere, due to the incident beam being angularly broad (due to the low frequency) and the curvature of being appreciable over the transverse size of the beam (due to CNT’s low aspect ratio and to the beam being broad). As a consequence, in different locations the propagation vector forms a different angle with , and different from . The evanescent region between the UHR and FX cutoff varies accordingly (Fig. 5) and becomes thicker for shallower incidence. This, combined with the larger distance traveled across the layer for more oblique angles, reduces the X-mode tunneling efficiency for grazing incidence.

3.1.3 Dependence of global parameters on heating power
The density and temperature profiles in Figs. 3-4 increased with the injected heating power, but maintained their shapes nearly unaltered. Therefore, their dependence on power can be summarized by only plotting the volume-averaged density and edge temperature , as in Fig. 6a-b. Here , where is the fitted experimental profile, which is a function of the flux surface coordinate . The temperature is the fitted evaluated at 90% of the effective minor radius. That was the approximate location where tended to reach its maximum. Hence, is effectively the peak temperature, or close to the peak temperature.
The data points in Fig. 6a-b were all obtained using = 88 mT. They are a combination of all data from Figs. 3-4 as well as the 88 mT data from a scan to be presented in Figs. 7-8 and discussed in Sec. 3.2.
The temperature increases with the heating power , as expected (Fig. 6b). The density also increases with , approximately like (Fig. 6a). This increase is due to the plasma not being fully ionized, as discussed in Sec. 3.1.1.
The energy stored in the plasma and the volume-averaged plasma beta were calculated as
| (2) | |||||
| (3) |
As expected, both quantities increase with heating power (Fig. 6c-d).
Note that the cold plasmas under consideration ( 10 eV) suffer from large losses from line radiation [25]. It is well-known, however, that higher heating power can overcome this “radiative barrier” and, by reduced line-radiation losses, establish a more favorable power balance, resulting in significantly higher temperatures and, therefore, values of [18].
Finally, the energy confinement time (Fig. 6e) was estimated as . Note that is an upper bound for the coupled power (Sec. 2.1). Therefore, the plotted is really a lower bound for the confinement time.
Energy confinement is found to decrease with like (Fig. 6e). At first sight this seems in good agreement with the International Stellarator Scaling ISS04 [26]
| (4) |
where is a device-specific parameter, and denotes the rotational transform evaluated at two thirds the minor radius of the LCFS. However, the scan in Fig. 6 is not a pure scan of , “all the rest remaining equal”. Rather, and thus the line-averaged density are also varying with . Secondly, and most importantly, Eq. 4 fitted data from fully ionized stellarator plasmas, where the confinement degradation was probably governed by transport physics in plasmas made non-Maxwellian by microwave, radio-frequency and neutral-beam heating.
By contrast, power-balance (hence, energy-confinement) in the partly ionized plasmas considered here suffers from severe radiative losses, as mentioned above. One driver of radiative losses, electron-ion recombination, increases roughly in proportion with and and thus in proportion with in a quasineutral plasma. Hence, it is not surprising that decreases (Fig. 6e) as increases (Fig. 6a). Indirectly, this could also explain why decreases with (due to the correlation between and ).
Future power upgrades are expected to yield temperatures in excess of the radiation barrier, 50 eV, at which radiative losses will diminish. As a result is expected to increase dramatically and not to follow the rough and scalings just discussed, but rather the international scaling in Eq. 4 with an adequate , probably , as argued in Ref.[18]. For the same reasons, much higher values of are expected, compared to Fig. 6e, once the radiative barrier is exceeded [18].
3.2 Dependence on magnetic field
A series of experiments was also conducted in which the heating power was kept constant but the strength of the magnetic field, , was varied. The purpose of this was to move the cyclotron resonance and, to a lesser extent, the UHR and the X-mode cutoffs, but not the O-mode cutoff. These changes affected the efficiency of candidate mode-conversion and heating mechanisms. Therefore, the scan had the promise of helping to isolate which mechanisms were taking place in the experiments.
The intermediate was the same as for the power scans in Sec. 3.1. The higher and lower values are the highest and lowest permissible values such that neither the fundamental nor the second harmonic resonant surfaces intersect the launch window (similar to Fig. 2a). This is to avoid damage to the window. The values of given in the legends of Figs. 7-8 are evaluated at the origin of the plane.


The stub-tuning was the same for all the experiments in this scan. This resulted in net power coupling of kW in all cases except X-mode launch at 88 mT, which had a net coupling of about 2 kW.
The results are shown in Fig. 7 for O-mode launch and in Fig. 8 for X-mode launch. For O-mode launch, the and profiles exhibit the greatest sensitivity to . Changes of profile shape were also observed, with both and becoming increasingly hollow as increased, and the core density being halved.
By contrast, for X-mode launch the profiles exhibited little to no variation with .
4 Full-wave modeling
In order to predict and interpret the experimental results, the interactions between injected microwaves and the CNT plasma was modeled by means of the full-wave, finite-difference time-domain code IPF-FDMC.[24] The code solves Maxwell’s equations coupled with the fluid equation of motion for electrons in a nonuniform magnetized plasma. As a result, it accounts for effects such as the O-X mode conversion and tunneling of the X-mode through the evanescent region between the UHR and fast X cutoff.
A damping term invoking a collision frequency in the range is assumed, which damps the slow X-mode in the vicinity of the UHR[12]. Here is the wave frequency. The total damped power is not sensitive to the value of within this range. As it will be discussed in Sec. 5.5, collisional damping is expected to dominate over conversion to EBWs, in the CNT experiments presented here. No cyclotron damping is accounted for in these simulations, but is expected to be negligible anyway (Sec. 5.4).
Full-wave calculations were performed for all values of , and polarizations in the experimental scans of Sec.3. Selected cases (maximum and minimum and ), corresponding to panels d and e of Figs. 3-4 and 7-8, are plotted respectively in panels f and g of the same figures. Shown are the contours of steady-state, time-averaged amplitude of the microwave electric field, , normalized to its peak value (which changes from one contour plot to the other). The profiles of and adopted in the simulations are based on the fits of the experimental profiles in panels a and b.
The launcher is located on the right of the computational domain and injects linearly polarized waves with a Gaussian distribution of intensity. This is a realistic model of the experiment (Fig. 1c and 2a). Perfectly absorbing conditions are adopted at all other boundaries, unless noted otherwise. Hence, the plotted refers to the first pass of microwaves but neglects additional power re-impinging on the plasma after reflections off the vessel walls or internal coils. The percentages of first-pass power absorption, primarily due to collisional damping, are indicated in panels f and g.
In each case in which the UHR is visible, enhancement of is noticeable in a narrow region (much narrower than the vacuum wavelength) close to the UHR. Only the X-mode is sensitive to this resonance, but enhancement is observed for nominal O-mode launch as well. This is ascribed to a combination of O-X mode conversion and lack of modal purity: as discussed above, neither in the experiment nor in the modeling are the linear polarizations injected pure O- or X-polarizations, which would be elliptical. This implies that some X-mode is injected during nominal O-mode launch.
Field enhancement near the UHR favors collisional damping. In some cases this can account for as much as 36% absorption in a single pass (Fig. 8f). In other cases, only 1% of power is absorbed at the first transit (Figs. 3g and 7f). This is due to the recessed location of the UHR, such that, in those cases, the beam does not encounter the UHR in its first transit.
4.1 Modeling multiple reflections
In the experiment, the unabsorbed power is reflected by the metallic walls of the vacuum vessel and by the metal cases of the in-vessel coils, and effectively re-injected in the plasma. To study this effect, the calculations of Figs. 7g and 8g were repeated with perfect electrical conductors lined on the left and bottom edges of the computational domain. The conductors simulate the in-vessel coils placed at the approximate same locations, although with an inclination of 78∘ (or, equivalently, 102∘) relative to each other (Fig. 9).

For O-mode launch, this results in field-enhancement and absorption in a new location (upper left of Fig. 10a), compared with Fig. 7g. The field pattern for X-mode launch (Fig. 10b), on the other hand, does not change significantly with respect to the same case with fully absorbing boundaries (Fig. 8g). In brief, reflections may or may not contribute to field-enhancement and absorption, depending on geometry and polarization. The same is expected of wall reflections.

These effects were integrated in two-dimensional (2D) full-device simulations. The computational domain is now a cross-section of the entire vessel, which the plasma intersects twice. One result in this larger domain, for the case of O-mode at low power with B = 87.5 mT, is shown in Fig. 11a. Significant field enhancement is visible at the lower left of the figure. There is no direct line of sight from the launcher to that toroidally remote location, which the wave reaches after multiple reflections off the walls and coils.

As a result, the fraction of absorbed power increases from 2% for first-pass (Fig. 3f) to 51% when multiple reflections are taken into account (Fig. 11a). The remaining 49% of the power was reflected back into the waveguide, as evidenced by the standing-wave pattern in the launch antenna in the upper-right corner of Fig. 11a. Other standing waves can also be noticed, between the plasma and the wall. All twelve experimental combinations of , and polarization of Figs. 3-4 and 7-8 were numerically modeled. For brevity, contours of are only shown for eight cases in the restricted domain with absorbing boundaries (panels f-g of the said figures) and for three cases in the enlarged domain, with reflections included (Fig. 11). However, significant increases of fractional absorption were observed in all twelve cases. Barring three exceptions at 15%, 29% and 39%, the fraction of power absorbed amounted to 50-80%. These calculations underscore the crucial role of reflections in coupling the microwave power to the CNT plasma in these experiments.
Even higher absorption percentages are expected in 3D simulations. This is because the fractional surface of the launcher and other unshielded ports (relative to the total surface of the wall) is even smaller than the fractional arc subtended by the launcher (relative to the total circumference of the wall) in the 2D problem. Therefore, on average in 3D the beam will experience more reflections before impinging on a port and abandoning the vessel. Consequently, it will cross the plasma a higher number of times, and deposit more power.
Resistive losses at the wall are neglected because the reflectivity of stainless steel to 2.45 GHz microwaves exceeds 99.9 % [27].
It is well known that an incident O-mode (or X-mode) can be partly reflected by smooth metallic surfaces as X-mode (or O-mode). This property is known as depolarization or polarization mixing, and in the fusion literature it is often referred to as polarization scrambling [28]. When using reflective boundaries, as in Figs. 10 and 11, IPF-FDMC naturally accounts for this effect.
Corrugated surfaces can cause additional scrambling [29], to the point that depolarization is often used as a measure of surface roughness [30]. This is because waves of different polarizations tend to be reflected at the corrugations’ crests and troughs, respectively. Said otherwise, realistic features, unless much smaller than , introduce phase-shifts that affect polarization. In the present case, thanks to the large wavelength , it was sufficient to model the CNT vessel and coils with 1 cm accuracy to take this effect into account as well.
Yet, the amount of polarization scrambling observed in the simulations was relatively modest. For instance, the X wave launched in Fig. 11b remains fairly purely polarized in X-mode even after reflections, as indicated by the fact that it barely penetrates beyond the right-handed FX cutoff.
5 Discussion: mode conversion, UHR accessibity, and heating mechanisms
In the following Subsections various mode-conversion and wave-damping mechanisms are examined one by one, and invoked or discarded as possible explanations of the experimental results presented in Figs. 3-8, on the basis of analythical or numerical arguments.
5.1 SX-B mode conversion
The SX-B mode conversion is not possible in the first pass, because the beam is launched from the low-field side. However, all plasmas discussed here were overdense both to the O- and X-mode (see for example profiles, cutoff layers and shaded regions in panels a, d and e in Figs. 3-4 and 7-8). In fact, the beams encounter the O and FX cutoff layer within 15 cm of the launch window. Consequently, part of the incident power is reflected by the plasma and experiences multiple reflections off the chamber walls, off the in-vessel coils (coated in metal jackets), and off the plasma. At the wall and at the coils, “polarization scrambling” occurs [28], causing incident O-mode to be reflected as X-mode and vice versa. Some of the reflected X-mode (whether it conserved its original polarization or it originated from an O-mode launch) may access the UHR from the high-field side, resulting in some SX-B conversion (Fig. 9).
It should be noted that much of the core plasma is overdense to slow X waves (see, for example, Fig. 4d-e). This creates a “bottleneck” narrower than between the overdense core and the UHR. Such bottleneck restricts wave access to the UHR inside or near the LCFS (again, see Fig. 4d-e, or see arrow in Fig. 9), thereby partly inhibiting the SX-B conversion. Accessibility would improve if was lower, due to the smaller overdense core. However, the fact that the case of least-restricted access was also the case with the lowest core density and temperature (Fig. 7) indicates that SX-B conversion does not play a significant role in heating the plasma.
5.2 FX-B conversion
First-pass FX-B conversion should be possible. Its efficiency depends on the thickness of the layer between the FX cutoff and the UHR.[31] The power transmission through this layer is approximately , where is the Budden factor (Sec. 13.5 of Ref.[32]).
For example, the evanescent layer in front of the launcher in Fig. 8e is as thin as = 0.5 cm, along the beam axis. Compared with the vacuum wavelength = 12.2 cm, this gives = 45%, along the beam axis. That is, nearly half the power injected in X-mode along that ray can tunnel through the evanescent region and reach the UHR.
It should also be noted, however, that, while thin in certain locations (for example, along the beam axis in Fig. 8e), the evanescent layer can be thicker elsewhere (for example, at higher in Fig. 8e). As a result, if we model the beam as a bundle of rays, some rays have to tunnel through thicker regions, with reduced transmissivity. Density can also fluctuate as a function of time, or from one discharge to another, and if decreases by just 25% outside the LCFS, increases from 0.5 cm to 5 cm in the case considered, giving .
In conclusion, if the FX cutoff and the UHR layers lie in front of the launcher, and the region in between is sufficiently thin, as is the case in Fig. 8e, significant power reaches the UHR directly at the first transit, without assistance from wall reflections. At the UHR, it can either convert to EBWs or, most likely, be collisionally damped, as discussed below. If, instead, the region is thick (for instance, due to low ), as is the case in Fig. 4d or 8d, only a small fraction of X-mode power penetrates it, at every single transit. Finally, for sufficiently high the FX cutoff and UHR lie “behind” the launcher, there is no evanescent layer to penetrate, and the beam impinges directly on the overdense core, as in in Fig. 4e.
5.3 O-X-B conversion
The CNT launch antenna emits an angularly broad beam. If treated as a bundle of rays, not all rays can simultaneously have the special direction for the O-X conversion to occurr. This aspect can be improved in the future by introducing a refocusing, steerable mirror to collimate the O-mode beam and aim it at the O-mode cutoff with the optimal angle.
In addition, the CNT launch antenna can only output linearly polarized waves, whereas a pure O-mode propagating obliquely to would be elliptically polarized, which will require the introduction of a phase-shifter.
Nevertheless, finite O-X coupling is possible in CNT due to its low at the location of the O-mode cutoff (0.3 to 0.4 for the O-mode profiles shown here). Here, is the density lengthscale. For such steep density gradients -relatively speaking-, the tolerance on the optimal angle for O-X conversion is known to relax.[33, 34]
5.4 Electron cyclotron damping of O- and X-mode
As seen in panels d-e of Figs. 3-4 and 7-8, portions of the EC resonance are directly accessible to the microwave beam, without mode conversions, because the plasma is locally underdense. This is for example the case of the point marked by the star symbol in Fig. 3d at coordinates (9.5 cm, -6 cm). In principle, cyclotron damping of electromagnetic O- and X-waves would be possible in these areas, provided that the optical depth is sufficient. For finite density and oblique propagation, is given in Table XII of Ref. [35]:
| (5) | |||||
| (6) |
Here is the index of refraction, is the angle between the propagation vector and , is the electron thermal velocity, and is the scale length of variation in along the beam trajectory. The O1 subscript denotes first-harmonic O-mode; X1 denotes first-harmonic X-mode.
Fusion plasmas are typically optically thick to first-harmonic O-mode, thanks to their high . In CNT, though, is three orders of magnitude lower. Additionally, due to the low , hence low , thus low wave frequency, is nearly two orders of magnitude longer. As a consequence, and , hence first-pass cyclotron damping is negligible in the underdense edge of CNT.
On the other hand, some cyclotron damping may occur in the overdense core. This is attractive because it intercepts a larger and more central (thus, more intense) portion of the Gaussian beam. The interceptions are schematically illustrated in Fig. 12 in the two limits of low and high field (Figs. 8d-e), corresponding to different locations of the EC resonance. Cyclotron damping of the attenuated O- or X-mode is possible, in the overdense core, provided that the wave reaches the Doppler-broadened EC resonance with finite wave-amplitude and, again, provided that the optical depth is sufficient. The increased value of is advantageous in this respect. However, it is not as high as to compensate for the five orders of magnitude mentioned before. Moreover, the wave evanesces too rapidly. As an example, let us consider the 0.5 kW O-mode case in Fig. 3, where , and let us consider a location where mT and . The Appleton-Hartree dispersion relation[32] gives us a wavenumber for O-mode propagation; hence, the electric field decays to of its incident value within 3 cm of the cutoff layer. The penetration depth would be even lower in denser plasmas.

This is in contradiction with O-mode experiments, where denser plasmas tend to be hotter (Figs. 3a-b and 7a-b). Due to this contradiction and, more importantly, to the low optical thickness and short penetration length, it is concluded that cyclotron damping of the O- and X-mode is not a plausible heating mechanism, neither in the underdense nor in the overdense regions.
5.5 Collisional absorption at the UHR vs. excitation of EBWs
In Secs. 5.1-5.3 we have discussed three mechanisms by which the X-mode can reach the UHR despite cutoffs. For brevity they were referred to by their standard names in the literature: SX-B (unlikely), FX-B (most likely) and O-X-B (somewhat likely) mode conversions. It remains to be discussed whether the electrostatic B mode actually develops. This mode has wavelength comparable with the electron Larmor radius , propagates away from the UHR (in this heating scheme; the opposite in a diagnotic scheme) and is cyclotron-damped near the EC resonance.
The alternative is that an electromagnetic SX mode approaches the UHR, decelerates, acquires shorter and shorter wavelength but does not convert in EBWs, because first it is collisionaly damped near the UHR. Note that even in the so called FX-B conversion, the FX branch couples with the SX branch of the dispersion relation first, before converting in EBWs.
In CNT, like in other cold plasmas or plasma edges, collisional damping prevails on the conversion to EBWs. This is because the electron-ion collisionality is relatively high ( 1-10 MHz): collisions are numerous, during the long time spent by the slow X wave near the UHR. The time spent near the UHR can be estimated numerically, but, as an order of magnitude, the Larmor radius for 5 eV and = 70 mT is . Waves of frequency = 2.45 GHz and wavelength propagate with phase velocity m/s. By the time this wave has travelled 10 cm near the UHR, on average every electron has collided with an ion once, in a plasma of 10 MHz. Here “every electron” includes electrons oscillating in the wave field (upper hybrid oscillations) and, effectively, sustaining these partly electrostatic waves. Due to collisions, energy is transfered from these electrons (thus, ultimately, from the wave) to the ions, which are not resonating with the electron Bernstein wave and are not supporting it. In brief, electron-ion collisions subtract energy from the wave. Here this effect is quantified with the aid of the IPF-FDMC full-wave code that, as mentioned, includes collisions.
5.6 Earlier experiments in other devices
Similar mechanisms have been observed on other devices with similar plasma parameters. Full-wave simulations and modulated power measurements for 2.45 GHz plasmas in TJ-K both indicated that power deposition occurred primarily at the UHR for both O- and X-mode heating.[12] In WEGA, simulations and experiments both pointed to significant deposition of EBWs at the cyclotron resonance.[13] The TJ-K experimental conditions are perhaps more similar to CNT because of the steep density gradients in the vicinity of the upper hybrid resonance. The WEGA setup, by contrast, (1) was designed to place the UHR in a region with a low gradient and (2) made use of an antenna optimized for O-X coupling. Power modulation measurements on CHS indicated significant levels of EBW heating for both O- and X-mode (linearly polarized), injected both normally and obliquely to the O-cutoff.[6]
6 Conclusions and future work
In summary, overdense microwave plasma heating has been observed in CNT with exceeding the cutoff density by factors of more than 4. Density and temperature profiles tend to be hollow, and changes in heating power affect temperatures primarily at the edge rather than at the core. Variations in had significant effects on the profiles for O-mode launch, but not for X-mode launch.
These observations are consistent with collisional damping of an X-mode at the upper hybrid resonance (UHR). Note that the X-mode can reach the UHR even for O-mode launch, after O-X mode conversion and/or polarization-scrambling reflections off the CNT walls and internal coils. Such interpretation is supported by full-wave modeling performed with the IPF-FDMC code. In the relatively cold plasmas presented, heated with less than 10 kW of microwave power, the X-mode is completely damped before completing its conversion in the Bernstein mode.
Future work will include upgrades to higher power for high stability research [18], as well as modulated-power experiments that will improve our understanding of the heating deposition locations. In addition, full-wave calculations in three dimensions (3D) will further refine the 2D modeling presented here. 3D effects are expected to be important, due to the low aspect ratio of CNT.
7 Acknowledgments
The authors thank S.D. Massidda and X. Sarasola for their help in installing an earlier 1 kW magnetron and obtaining the first microwave plasma, which encouraged the experiments at 10 kW presented here.
References
- [1] R. Prater. Heating and current drive by electron cyclotron waves. Phys. Plasmas, 11(5):2349, 2004.
- [2] H. P. Laqua. Electron bernstein wave heating and diagnostic. Plasma Physics and Controlled Fusion, 49:R1, 2007.
- [3] T. Maekawa, T. Kobayashi, S. Yamaguchi, K. Yoshinaga, H. Igami, M. Uchida, H. Tanaka, M. Asakawa, and Y. Terumichi. Doppler-shifted cyclotron absorption of electron Bernstein waves via -upshift in a tokamak plasma. Physical Review Letters, 86:3783, 2001.
- [4] V. Shevchenko, Y. Baranov, M. O’Brien, and A. Saveliev. Generation of noninductive current by electron Bernstein waves on the COMPASS-D tokamak. Physical Review Letters, 89:265005, 2002.
- [5] Y. Yoshimura, H. Igami, S. Kubo, T. Shimozuma, H. Takahashi, M. Nishiura, S. Ohdachi, K. Tanaka, K. Ida, M. Yoshinuma, C. Suzuki, S. Ogasawara, R. Makino, H. Idei, R. Kumazawa, T. Mutoh, H. Yamada, and the LHD Experiment Group. Electron bernstein wave heating by electron cyclotron wave injection from the high-field side in LHD. Nuclear Fusion, 53:063004, 2013.
- [6] R. Ikeda, K. Toi, M. Takeuchi, C. Suzuki, T. Shoji, T. Akiyama, M. Isobe, S. Hishimura, S. Okamura, K. Matsuoka, and CHS Experimental Group. Production and heating of overdense plasmas by mode-converted electron Bernstein waves at very low toroidal field in the Compact Helical System. Physics of Plasmas, 15:072505, 2008.
- [7] A. H. Seltzman, J. K. Anderson, A. M. DuBois, A. Almagri, and C. B. Forest. X-ray analysis of electron bernstein wave heating in mst. Review of Scientific Instruments, 87:11E329, 2016.
- [8] J. Preinhaelter and V. Kopecký. Penetration of high-frequency waves into a weakly inhomogeneous magnetized plasma at oblique incidence and their transformation to Bernstein modes. Journal of Plasma Physics, 10:1, 1973.
- [9] H. P. Laqua, H. Maassberg, F. Volpe, and the W7-AS Team and ECRH-Group. Electron bernstein wave heating and current drive in overdense plasmas in the W7-AS stellarator. Nuclear Fusion, 43:1324, 2003.
- [10] A. Mueck, L. Curchod, Y. Camenen, S. Coda, T. P. Goodman, H. P. Laqua, A. Pochelon, L. Porte, and F. Volpe. Demonstration of Electron-Bernstein-Wave Heating in a Tokamak via O-X-B Double-Mode Conversion. Phys. Rev. Lett., 98(17):175004, April 2007.
- [11] K. Nagasaki, Y. Nakamura, S. Kamioka, H. Igami, F. Volpe, T. Stange, K. Sakamoto, H. Okada, T. Minami, S. Kado, S. Kobayashi, S. Yamamoto, S. Ohshima, G. Weir, S. Konoshima, N. Kenmochi, Y. Otan, Y. Yoshimura, N. Marushchenko, and T. Mizuuchi. Development of electron bernstein emission diagnostic for heliotron j. Plasma Fusion Research, 11:2402095, 2016.
- [12] A. Köhn, G. Birkenmeier, E. Holzhauer, M. Ramisch, and U. Stroth. Generation and heating of toroidally confined overdense plasmas with 2.45 GHz microwaves. Plasma Physics and Controlled Fusion, 52:035003, 2010.
- [13] Y. Y. Podoba, H. P. Laqua, G. B. Warr, M. Schubert, M. Otte, S. Marsen, F. Wagner, and E. Holzhauer. Direct observation of electron-Bernstein wave heating by O-X-B-mode conversion at low magnetic field in the WEGA stellarator. Physical Review Letters, 98:255003, 2007.
- [14] T. S. Pedersen, A. H. Boozer, J. P. Kremer, R. G. Lefrancois, W. T. Reiersen, F. D. Dahlgren, and N. Pomphrey. The Columbia Nonneutral Torus: a new experiment to confine nonneutral and positron-electron plasmas in a stellarator. Fusion Sci. Technol., 46:200, 2004.
- [15] J. P. Kremer, T. S. Pedersen, R. G. Lefrancois, and Q. Marksteiner. Experimental confirmation of stable, small-debye-length, pure-electron-plasma equilibria in a stellarator. Phys. Rev. Lett., 97:095003, 2006.
- [16] X. Sarasola and T. S. Pedersen. First experimental studies of the physics of plasmas of arbitrary degree of neutrality. Plasma Phys. Controlled Fusion, 54:124008, 2012.
- [17] K. C. Hammond, A. Anichowski, P. W. Brenner, T. S. Pedersen, S. Raftopoulos, P. Traverso, and F. A. Volpe. Experimental and numerical study of error fields in the CNT stellarator. Plasma Physics and Controlled Fusion, 58:074002, 2016.
- [18] K. C. Hammond, S. A. Lazerson, and F. A. Volpe. High- equilibrium and ballooning stability of the low aspect ratio CNT stellarator. Physics of Plasmas, 24:042510, 2017.
- [19] K. C. Hammond, R. R. Diaz-Pacheco, Y. Kornbluth, F. A. Volpe, and Y. Wei. Onion-peeling inversion of stellarator images. Review of Scientific Instruments, 87:11E119, 2016.
- [20] P. W. Brenner, T. S. Pedersen, J. W. Berkery, Q. R. Marksteiner, and M. S. Hahn. Magnetic surface visualizations in the Columbia Non-Neutral Torus. IEEE Transactions on Plasma Science, 36(4):1108, 2008.
- [21] R. Jaenicke, E. Ascasibar, P. Grigull, I. Lakicevic, A. Weller, M. Zippe, H. Hailer, and K. Schwörer. Detailed investigation of the vacuum magnetic surfaces on the W7-AS stellarator. Nuclear Fusion, 33(5):687–704, 1993.
- [22] S. Lazerson, M. Otte, S. Bozhnekov, C. Biedermann, T. S. Pedersen, and the W7-X team. First measurements of error fields on W7-X using flux surface mapping. Nuclear Fusion, 56:106005, 2016.
- [23] P. C. Stangeby. The Plasma Boundary of Magnetic Fusion Devices. Plasma Physics Series. Taylor & Francis Group, 2000.
- [24] A. Köhn, Á. Cappa, E. Holzhauer, F. Castejón, Á. Fernández, and U. Stroth. Full-wave calculation of the O-X-B mode conversion of Gaussian beams in a cylindrical plasma. Plasma Physics and Controlled Fusion, 50:085018, 2008.
- [25] A. Tanga, P. R. Thomas, J. G. Cordey, J. P. Christiansen, S. Ejima, A. Kellman, E. Lazzaro, P. J. Lomas, P. Morgan, M. F. Nave, P. Noll, and F. C. Schüller. Start-up of the Ohmic phase in JET. In H. Knoepfel, editor, Tokamak Start-up, page 159. Plenum Press, 1986.
- [26] H. Yamada, J. H. Harris, A. Dinklage, E. Ascasibar, F. Sano, S. Okamura, J. Talmadge, U. Stroth, A. Kus, S. Murakami, M. Yokoyama, C. D. Beidler, V. Tribaldos, K. Y. Watanabe, and Y. Suzuki. Characterization of energy confinement in net-current free plasmas using the extended International Stellarator Database. Nucl. Fusion, 45:1684, 2005.
- [27] M. Dressel, O. Klein, Donovan S., and G. Grüner. High frequency resonant techniques for studying the complex electrodynamics response in solids. Ferroelectrics, 176(1):285, 1996.
- [28] F. Albajar, M. Bornatici, and E. Engelmann. Electron cyclotron radiative transfer in the presence of polarization scrambling in wall reflections. Nuclear Fusion, 45:L9, 2005.
- [29] P. Beckmann and A. Spizzichino. The Scattering of Electromagnetic Waves from Rough Surfaces. Radar Library. Artech House, 1987.
- [30] L. Liu, X. Li, and K. Nonaka. Rev. Sci. Instrum., 86:023107, 2015.
- [31] K. G. Budden. Radio Waves in the Ionosphere. Cambridge University Press, 1961.
- [32] T. H. Stix. Waves in Plasmas. Springer, 1992.
- [33] E. Mjøhlus. Coupling to Z mode near critical angle. Journal of Plasma Physics, 31:7, 1984.
- [34] H. Igami, H. Tanaka, and T. Maekawa. A survey of mode-conversion transparency windows between external electromagnetic waves and electron bernstein waves for various plasma slab boundaries. Plasma Physics and Controlled Fusion, 48:573, 2006.
- [35] M. Bornatici, R. Cano, O. De Barbieri, and F. Engelman. Electron cyclotron absorption and emission in fusion plasmas. Nucl. Fusion, 23(9):1153–1257, 1983.