Did the 2000 November 8 solar flare accelerate protons to 40 GeV?
Abstract
It has been reported that a 5.7 directional muon excess coincident with the 2000 July 14 solar flare was registered by the L3 precision muon spectrometer [Ruiguang Wang, Astroparticle Phys., 31(2009) 149]. Using a same analysis method and similar criteria of event selection, we have analyzed the L3 precision muon spectrometer data during November 2000. The result shows that a 4.7 muon excess appeared at a time coincident with the solar flare of 8 of November 2000. This muon excess corresponds to above 40 GeV primary protons which came from a sky cell of solid angle 0.048 sr. The probability of being a background fluctuation is estimated to be about 0.1%. It has been convinced that solar protons could be accelerated to tens of GeV in those Class X solar flares which usually arose solar cosmic ray ground level enhancement (GLE) events. However, whether a Class M solar flare like the non-GLE event of 8 November 2000 may also accelerate solar protons to such high energies? It is interesting and noteworthy.
keywords:
Solar flares; Solar energetic protons; Ground level enhancement (GLE); Muon enhancements; Muon drift chamber.1 Introduction
It is known that solar energetic particles are accelerated during intense solar high energy process which usually accompanied by solar flares (SFs) and/or coronal mass ejections (CMEs). When the fluxe of solar protons with energies above 10 MeV exceeds 10 pfu (1 pfu = 1 proton ), the event is referred to as a solar proton event (SPE). From 1976 to now, more than 265 SPEs have been observed by spacecraft-based detectors[1]. Those SPEs, in which if solar energetic particles with energies above several hundred MeV produce particles cascade at the top of the atmosphere and give rise to a available flux increase of cosmic rays on the surface of the Earth, are also called cosmic ray ground level enhancements (GLEs). Up to now, 71 GLEs have been recorded mainly by the worldwide network of neutron monitors (NMs)[2] since the first GLE observation in 1942[3].
The worldwide NMs detect the fluxes of secondary neutrons produced by incident protons coming from all acceptance at ground level and show the energy threshold of incident protons with the local geomagnetic rigidities. Compared to NMs, some directional detectors (such as muon telescopes) operating at higher energies should be better suited for detecting higher energy solar proton beams in big solar flares. Since energy thresholds are typically fixed by the instrument design and their atmospheric or underground depth, these instruments can register events, in principle, with energies up to or beyond 100 GeV [4]. Unfortunately, few such muon detectors is in operation or running for a long period in the world.
In recent years, utilizing the technique of particle trajectory tracing [5] a GLE can be modelled from different NMs’ data with an advanced model of the magnetospheric magnetic field [6, 7]. The solar proton beam approaching the Earth can be described in simulations [8, 9, 10]. Many such studies showed that the arrival direction of relative solar protons in big flares is often anisotropic, sometimes quite anisotropic, and these protons often follow a steep spectrum.
Lots of investigations of SPEs and GLEs have been reported in many typical papers, such as these works [11, 12, 13, 14, 15, 16, 17, 18, 19, 20]. Measurements of the GLEs have indicated that the Sun could accelerate protons up to tens of GeV in energy [21, 22, 23, 24, 25]. In contrast, the information on solar relativistic protons produced in those SPEs of non-GLEs is still scarce. It is very interest to know whether there are still high energy solar proton beams and how high energies the solar protons can be accelerated in such big SPEs of non-GLE. In 1971 a positive correlation was obtained between a significant muon intensity increase and a specific solar flare by a narrow-angle telescope located at a underground mine in Colorado [26], although no response of NMs to this event. It is the first experiment evidence for solar particle production in above 75 GeV energy region in a solar flare of class M8. After that we have not seen any significant report on this subject.
The L3+C experiment could measure the momentum and direction of cosmic ray muons [27] with the precision muon chamber of the L3 spectrometer [28]. Its typical superiorities should be high directional resolution, high momentum resolution, low momentum threshold and a large sensitive volume. Its running periods (1999 - 2000) were just covering the peak years of the solar cycle 23. These factors offer a great opportunity for us to search for high energy solar protons in SPEs and to try to answer the questions discussed above.
Using L3 precision muon spectrometry, a muon excess correlated with the GLE of 14 July 2000 was obtained from a small sky cell of a solid angle of 0.046 sr [24, 25], corresponding to primary solar protons from 40 GeV to 100 GeV. Exception the GLE of July 14, a biggest SPE happened on November 8 of this year. Adopting the same analysis technique for the GLE of 14 July 2000, we also analyzed the data of 8-9 November 2000 and found a new muon excess. In this paper we will present the data analysis and the results for this event. After a brief introduction of this event and our experiment in the next two sections, we will mainly explain the data analysis technique and the results in Section 4, following some discussions and a conclusion in the last two sections.
2 The solar proton event of 8 November 2000
The SPE of 8 November 2000 was associated with an M7.4/3F class parent solar flare produced in the optical coordinates N10W77. Several small flares in the regions NOAA9212, NOAA9213 and NOAA9218, gave rise to this strong M7.4 flare at 23:38 UT and triggered a strong solar storm of high-energy particles [29]. The X-ray flare, lasting from 22:42 UT to 00:05 UT of November 9 with a peak at 23:28 UT, was accompanied by a fast partial halo CME at 23:06 UT [30]. The CME speed was about 1738 km/s. It was the second largest SPE ever occurred in 2000s. A type IV radio burst happened at 23:45 UT [31], designating the starting of high energy phenomena in the flare and being thought to be close to the time of relativistic proton acceleration [11]. Soon after that, a strong solar storm of high-energy particles was triggered. The satellite-borne detectors, both GOES-8 and GOES-10, observed a rapid increase of proton fluxes with energies larger than 10 MeV, 50 MeV and 100 MeV, respectively. At about 00:10 UT of 9th the flux of protons with energy up to 500 MeV peaked in about 3 orders high. The Solar-Terrestrial activity chart [32] shows solar wind exceeded about 900 km/s about two days later. It is interesting to note that no NMs have significant response to this event.
3 The L3+C Experiment
The L3+Cosmics (L3+C) detector [27] combines the high precision muon drift chambers of the L3 spectrometer with an air shower array on the surface. As shown in Figure 1, only the muon detectors, the magnet and the scintillator tiles of the L3 spectrometer were used to measure cosmic rays. The muon drift chamber, installed in a 1000 magnetic field of 0.5 T, shows an octant shape in the plane perpendicular to the beam (11 m in width and 11 m in height) and a square shape in the plane along the beam (11 m in length). The maximum geometrical acceptance is , covering a zenith angle range from 0∘ to .
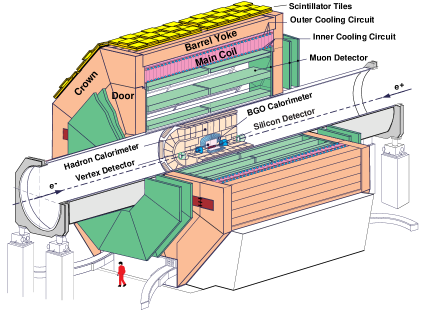
The detector is located shallow underground near Geneva (6.02∘E, 46.25∘N) at an altitude of 450 m above sea level, where the vertical geomagnetic rigidity cutoff is 5 GV. The approximately 30 m molasse above the detector provides a 15 GeV cutoff for the muon energy, corresponding to primary proton energies above 40 GeV. In order to independently observe cosmic ray events a timing detector, composed of 202 of plastic scintillators, was installed on top of the magnet, and a separate trigger and DAQ system were used for the data taking of cosmic ray events.
Although a independent data taking system was set up for cosmic ray event register, much high background still existed when LEP positron-electron collisor was operating. Fortunately, the collision experiment has been stopped after the end of October 2000. So the subsequent muon data taken by muon drift chambers had very low background, which is very crucial for analysis of the SPE of 8 November 2000.
4 Data analysis and results
This analysis is to search for possible muon excess signals from our reconstructed muon data set during the period of the SPE of 8 November 2000, to see if there also exist high energy protons of tens of GeV. In view of the features of solar high energy protons mentioned in Section 1 and 2, and based on our analysis experience for the GLE of 14 July 2000, we could judge: 1) the GeV high energy protons, if existed, is more possible coming from a narrow sky cell; and 2) their onset time to arrive the Earth should be a little earlier than hundred MeV protons. Observations from GOES-8 showed the fluxes of protons with energies up to 500 MeV peaked at about 00:10 UT of 9th November. Thus, the searching for a possible muon excess should mainly focus on each sky cell and short time period around the peak time of the increase seen by GOES, starting at 24:00 UT of 8th. That is to see whether there was any time-coincident muon excess with GOES-8 data.
A data set of muons with surface energies over 20 GeV within the full acceptance of the L3+C detector was used for this analysis. In order to ensure the real muon events, exact event selections are necessary for reconstructed muons. In next subsections, we introduce the event selection criteria and analysis technique which were adopted in previous study on the GLE of 14 July 2000 [24, 25].
4.1 Event selection
As stated above, LEP positron-electron collisor has stopped after the end of October 2000. But the muon drift chambers of the L3 spectrometer were still running normally. A clean muon data set was obtained. So in this analysis we did not need to use the cut of variable T0 which was applied in previous analysis. Other previous selection criteria were still adopted:
1. Only a single muon track is present in the muon chamber;
2. The track is composed of at least 3 segments of hits in P-chambers (wires parallel to the magnetic field) and by 2 segments of hits in Z-chambers (wires perpendicular to the magnetic field), ensuring it being a good muon track.
3. The back-tracking of the track from the muon chambers to the surface is successful in order to ensure good pointing.
4.2 Time binning and sky mapping
All selected events were binned in time according to live-time and in space according to muon s arrival direction on the ground.
The L3+C data taking system set 0.839 s as a minimal time bin. We also used this minimal time bin as a live-time interval. In our analysis, we combined 100 live-time intervals to form a 83.9 s live-time bin as the basic time unit.
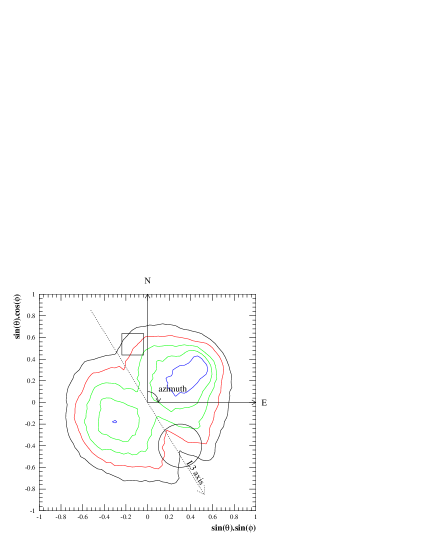
In space division the direction cosines
= sincos
= sinsin
were used as measurables of the muon directions, where
and are the zenith and azimuth angles of the muon direction
at the surface. The squared area of the variables and was
divided into a grid. Ignoring those cells with
poor statistics within the detector acceptance, 59 sky cells
containing at least 50 events remained for the investigation. The
contour lines for directions having an equal event rate are shown
in Figure 2 for data of 8 November 2000.
4.3 Background
In a day before the flare the Sun was relatively inactive and the GOES satellite showed that the 4 MeV proton flux was stable [33]. So we choose 12 hours data before 21:00 UT of 8th as background measurement. The same event selection criteria, same time binning and direction binning were applied to the background analysis.
4.4 Result
To find possible excesses we compared the data with the background for each sky cell, within the peak time of GOES-8. As a result, an count excess in a bin containing 634 events was found (seeing Figure 3a) in the sky cell No.48 which defined as (with a solid angle of 0.048 sr). It was within a 8.39 min live-time window (with the real time from 00:07 UT to 00:16 UT of 9th). This excess was obtained after a first search for an 83.9 s live-time bin (resulting from the on-line live-time counting), starting from 24:00 UT and having an anomalously large number of events followed by other two 83.9 s live-time bins which also had a higher number of events. The bin at 00:07 UT that met these requirements was taken as the starting bin for a possible excess. The following 5 live-time bins were combined with it to form the 8.39 min live-time window.
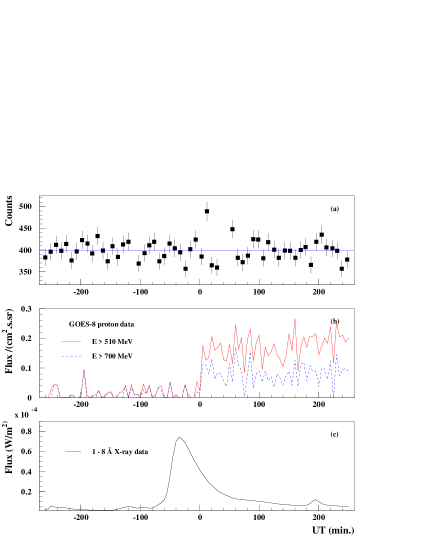
We can see from Figure 3b the excess appeared at a time just coincident with the peak increase of lower energy solar protons. With 8.39 min live-time bins we investigated the background of 12 hours before 21:00 UT for the same sky cell. The background distribution is shown in Figure 4 and is fitted by a Gaussian. Using the fitted mean of 535 and the standard deviation equal to 20.9, the excess of 99 events gives rise to a 4.7 effect.

Out of the 634 muons in sky cell No. 48 and in 8.39 min live-time bin at 00:07 UT of 9th November 2000, there were 373 muons plus and 261 muons minus. The charge ratio of muons was about 1.43 and the distribution of their momenta up to 100 GeV/c was shown in Figure 5.

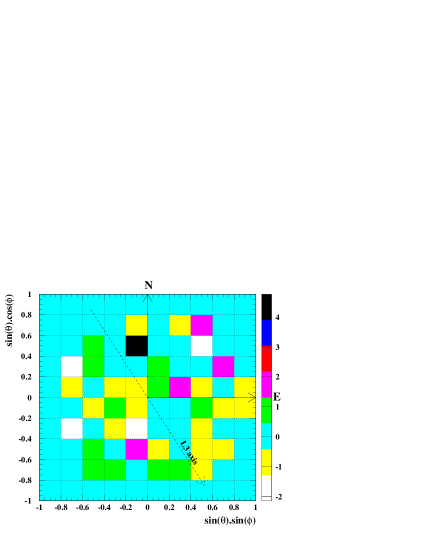
The sigma distribution of 59 sky cells in 8.39 min live-time bin at 00:07 UT of 9th November 2000 was shown in Figure 6. It is obvious that the most significant cell appeared in the sky cell No.48.
5 Discussion
We have found an excess of 4.7 in one of 59 sky cells with the selected live-time binning of 8.39 min. The total number of trials is equal to the number of cells timing the number of time window selections. In this searching process the total number of trials was estimated as . Here the 9 corresponds to the number of trials to find the start bin within 00:00 - 00:10 UT which have large number of events over mean and should be followed by other two 83.9 s live-time bins which also had a higher number of events than mean, and the 5 corresponds to the 5 time groups to get the 8.39 min live-time bin. Based on the total number of trials we can estimate that the probability for such an excess being due to a background fluctuation is about 0.1% . Using the same event selection criteria, same time binning and direction binning, five days’ data (November 5, 6, 7, 10, 11) were independently analyzed with the ‘running mean’ method. The result confirmed that no more significant excess than 4.7 was found except November 8.
Using the air shower simulation code CORSIKA [34], a Monte Carlo simulation was carried out in order to estimate the primary energies of solar protons which could be at the origin of the observed excess. The simulation considerations were as following. Primary protons were assumed to be incident along the directions that make the produced muons to appear in the direction of sky cell No. 48. Supposing this major SPE also having a soft solar proton spectrum like the GLE of 14 July 2000, the index of the primary power law was also set to -6 above 20 GeV. The simulation result shows that about 90% of the recorded muons are produced by primary protons energies ranging from 40 GeV to 200 GeV with a most probable energy of 74 GeV. The highest energy of protons is up to about 1000 GeV. If the primary spectrum is not so steeper, this value will be higher. Therefore, this observed excess could be attributed to solar protons of energies above those a set of NMs being sensitive to.
An upper limit of primary proton flux has also been estimated for this excess. Sampling a proton flux with a power index -6 and penetrating into the atmosphere from directions around the sky cell No.48, muons was produced and traced reaching to the surface by Monte Carlo program. An area centered around the muon chambers was marked off on the surface. This area should be large enough to contain the air shower cores, ensuring a very small fraction loss of muons (less than 1%). Each muon in this area was traced through the molasse and the muon chambers and reconstructed using the same program as for the data. For the background the same simulation procedure was done except changing a power law index from -6 to -2.7 for a primary cosmic ray spectrum. Since the primary proton flux is known, we can calculate an upper limit of primary solar protons by comparing the observed data with the simulated data. The flux upper limit of the solar proton beam entering the upper atmosphere around the direction of the sky cell No.48 may be
GeV) 9.2 (90% c.l.).
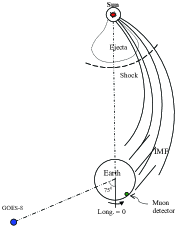
The event of 8 November 2000 is one of the largest SPE except for 16 GLEs in solar cycle 23. Although not forming a GLE it still possesses following features like most of GLEs: a related flare locating at more western hemisphere of the Sun, a shock driven by a fast wide CME for particle acceleration, and a accompanied radio type II/IV burst [13]. To help us to understand the particles’ transmission and detection, a location map of the Sun, Earth, satellite GOES-8 and L3+C muon detector just at 00:07 UT of 9th November 2000, ia shown in Figure 7. In this drawing, the curved dashed thick line represents shocks driven by large tagged eruptions which expressed as a dashed thin line. The Parker spiral field line connecting the Sun to the Earth is drawn and their tangent parallel lines near the earth form 450 angle with the Sun-Earth line.
It has reported that anti-Sunward detectors may still see high energy solar protons in some extreme events. For example, the earliest arriving particles were detected by stations observing the anti-Sunward hemisphere in the GLE of 28 October 2003 [35]. In this event there should exist a great possibility of solar protons being detected by a high directional resolution muon spectrometer, because the in situ detector is not in the position of full back to the Sun, though no NMs had a corresponding. One reason we speculated may be the following. Since the relativistic solar protons is quite anisotropic, they usually arrive to the Earth in a narrow space direction, that is, forming a solar proton beam. The ground-based NM, as an integrating detector, are usually not sensitive to these particle beams if their flux is not enough large. Even if detected it may be a ‘hidden registration or poorly-identified’ GLE [36], like a recent SPE on 2014 January 6.
It should be note that the L3 muon spectrometer was still running stably during 2000 November. There was no abnormality in the experimental environment. Furthermore, the background from collision events completely disappeared because LEP positron-electron collisor has stopped running after the end of October 2000. It is because of this background that about 2/3 muon data was cut off in the event of 2000 July 14 [24, 25]. Up to now we have not found any other related sources for this muon excess except for time coincident with the solar flare of 8 of November 2000.
6 Conclusion
In the solar proton event of 8 November 2000 an excess of 99 muons with 20 GeV over a background of 535 was observed in a particular sky region, lasting from 0:07 to 0:16 UT of 9th. The chance probability for such an excess to be a background fluctuation is about 0.1% in this search. It was time-coincident with the peak increase observed by the satellite borne detector GOES-8 during the impulsive phase of the solar flare. If the excess was really induced by solar protons, the observation indicates that solar protons with energies greater than 40 GeV were required to produce the excess. If so this may be the second evidence of solar protons above tens of GeV in major SPEs but non-GLEs since 1971.
This study shows that a high directional resolution muon
spectrometer at a shallow depth may detect high energy solar
proton beams which although can not be recorded by NMs. Did it seem to show that a major solar proton non-GLE event
may also produce solar protons with energies above 40 GeV?
Acknowledgments We acknowledge the all L3 collaboration members for their unique muon data in this solar cosmic ray event. We would like to thank Herbert. H. Sauer for providing GOES data and information about GOES position at the flare time.
References
- [1] http://umbra.nascom.nasa.gov/SEP/seps.html.
- [2] http://cosmicrays.oulu.fi/GLE.html.
- [3] S. E. Forbush, Phys. Rev., 70(1946), 771.
- [4] A. A. Chilingarian & A. E. Reymers, Astroparticle Phys. 27(2007), 465.
- [5] Cramp, J. L., Duldig, M. L., Fl ckiger, E. O. et al., J. Geophys. Res. 102, 24237.
- [6] N. A. Tsyganenko, Planet. Space Sci. 37(1989), 5.
- [7] N. A. Tsyganenko, J. Geophys. Res., 107(2002), 1029.
- [8] M. L. Duldig, D. J. Bombardieri, J. E. Humble, Proceedings of 28th ICRC, Tsukuba, SH1.4, 2003, 3389.
- [9] Bieber, J. W., DROGE, W., Evenson, P. A. et al., Astrophy. J., 567(2002), 622.
- [10] D. J. Bombardieri, M. L. Duldig, K. J. Michael and J. E. Humble, Astrophy. J., 644(2006), 565.
- [11] E. W. Cliver, S.W. Kahler, M. A. Shea, & D. F. Smart, D. F., Astrophy. J., 260(1982), 362.
- [12] E. W. Cliver, Astrophy. J., 639(2006), 1206.
- [13] R. G. Wang, Astroparticle Phys., 26(2006), 202.
- [14] R. G. Wang & J. X. Wang, Adv. Space Res., 38(2006), 489.
- [15] R. G. Wang, Adv. Space Res., 40(2007), 1835.
- [16] H. V. Cane, I. G. Richardson & T. T. Von. Rosenvinge, J. Geophys. Res, 115(2010), A08101.
- [17] K. A. Firoz, J. Hwang, I. Dorotovi et al., Astrophys. Space Sci., 331(2011), 469.
- [18] K. A. Firoz, Y.J. Moon, S.H. Park et al., Astrophy. J., 743(2011), 190.
- [19] K. A. Firoz, W. Q. Gan, Y.J. Moon, & C. Li, Astrophy. J., 758(2012), 119.
- [20] M. J. Aschwanden, Space Sci. Rev., 171(2012), 3.
- [21] P. N. Parker, Phys. Rev., 107(1957), 830.
- [22] C. E. Navia et al., Astrophy. J., 621(2005), 1137.
- [23] R. G. Wang & J. X. Wang, Astroparticle Phys., 25(2006), 41.
- [24] P. Achard et al. 2006, A&A, 456(2006), 351.
- [25] R. G. Wang, Astroparticle Phys., 31(2009), 149.
- [26] S. M. Schindler & P. D. Kearney, Nature, 237(1971) 503.
- [27] O. Adriani et al. , Nucl. Instr. and Meth. in Phys. Res., A 488(2002), 209.
- [28] B. Adeva et al., Nucl. Instr. and Meth. in Phys. Res., A 289(1990), 35.
- [29] http://cdaw.gsfc.nasa.gov/meetings/2002 sep/data/event list.html
- [30] http://cdaw.gsfc.nasa.gov/CME list/UNIVERSAL/2000 11/ univ2000 11.html
- [31] ftp://ftp.ngdc.noaa.gov/STP/space-weather/solar-data/solar-features/solar-radio/radio-bursts/tables/spectral-sgd/2000/11/ Solar Radio Spectral Obs 0011.pdf
- [32] http://hirweb.nict.go.jp/sedoss/solact3/do?d=2000%2c10%2c18
- [33] http://spidr.ngdc.noaa.gov/spidr/save.do?task=print
- [34] D. Heck, J. Knapp, Forschungszentum Karlsruhe, Technical report FZKA 6019, 1998.
- [35] J. W. Bieber, J. Clem, P. Evenson & R. Pyle, Geophys. Res. Lett., 32(2003), L03S02.
- [36] C. Li, L. I. Miroshnichenk & C. Fang, Research in Astronomy and Astrophysics, 15(2015), 1036.