SF2A 2017
WebPlotDigitizer, a polyvalent and free software to extract spectra from old astronomical publications:
application to ultraviolet spectropolarimetry
Abstract
In this contribution, we present WebPlotDigitizer, a polyvalent and free software developed to facilitate easy and accurate data extraction from a variety of plot types. We describe the numerous features of this numerical tool and present its relevance when applied to astrophysical archival research. We exploit WebPlotDigitizer to extract ultraviolet spectropolarimetric spectra from old publications that used the Hubble Space Telescope, Lick Observatory 3 m Shane telescope and Astro-2 mission to observe the Seyfert-2 AGN NGC 1068. By doing so, we compile all the existing ultraviolet polarimetric data on NGC 1068 to prepare the ground for further investigations with the future high-resolution spectropolarimeter POLLUX on-board of the proposed Large UV/Optical/Infrared Surveyor (LUVOIR) NASA mission.
keywords:
Physical data and processes, Methods: numerical, Software1 Introduction
Astronomical spectra acquired before the era of Internet and on-line data storage are only available through papers published in physical form. Observational data, in particular those obtained by small missions and modest telescopes before the 90’s, are not all stored in databases and several observations cannot be retrieved. New observations are thus required but it is a time-consuming task, especially for those who only want to fit their numerical simulations in order to test the relevance of their model. In this context, asking for observational time on new satellites and telescopes that are already facing high pressure-factors is a waste of effort. The best solution relies on digitalization of the old spectra using high resolution scanners. The digitalized plots are thus available for data extraction using modern softwares. However, many of the software tools dedicated to this task are either expensive or not very versatile. The common complaints about the existing tools are their limited features, poor compatibility with different operating systems and closed source code.
In this contribution, we present WebPlotDigitizer, a software created by Ankit Rohatgi that is distributed free of charge as an open source web-based tool. Thanks to its large adaptability, we show that the software can be easily handled to accurately extract data from any published paper in the field of astrophysics (and beyond). To show the great potential of this tool, we use it to retrieve the old ultraviolet polarimetric data of NGC 1068, a Seyfert-2 active galactic nuclei (AGN), acquired before the millennium by the Hubble Space Telescope, Lick Observatory 3 m Shane telescope and Astro-2 mission. This preliminary step will allow us to test model predictions for the high-resolution spectropolarimeter POLLUX that is proposed for the NASA’s mission study LUVOIR.
2 Description and application of WebPlotDigitizer
2.1 An overview of the software
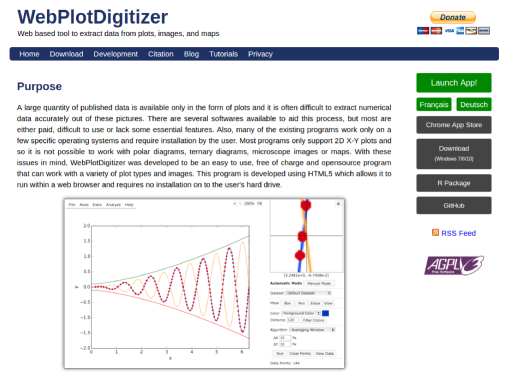
WebPlotDigitizer has been continuously developed since its creation in 2011 by Ankit Rohatgi at the University of Notre Dame (Indiana, USA). This software uses affine transformations to map pixel location in the image to data points on a figure based on the calibration points provided by the user. Various image processing algorithms included with this software can be used to extract large number of data points from uploaded figures with great precision. WebPlotDigitizer is distributed under the GNU General Public License version 3, and the latest stable version of the software (v3.12, June 2017) can be used directly from the website http://arohatgi.info/WebPlotDigitizer. Fig. 1 is a screenshot of the main web page. It shows the software launching button as well as all the recent developments of the code. A language selection is available (English, French and Deutsch). One can also download the code or donate for the code’s sustainability.
2.2 Extracting data from figures
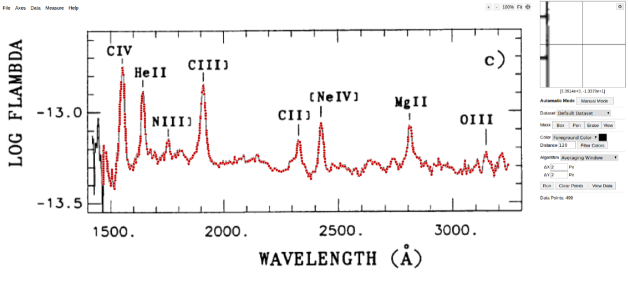
In order to extract a spectra from an archival paper, the first step is to create an image that isolates the spectrum, including the horizontal and vertical axes. The presence of text and legends won’t interfere. Once the image of the spectrum created (see, e.g., Fig. 2), it must be loaded by the program using File Load image. Different plot types can then be selected (regular XY plot, but also 2D bar plots, polar and ternary diagrams, maps with scale bar and images) to correctly map the image pixels to the corresponding data values in the image. The next step is to quantitatively calibrate the data using axes alignment. The software will ask the user to select a few known points on the axes (2 points on the X-axis and 2 more points on the Y-axis for a 2D spectrum) and enter the corresponding values. For better accuracy during the digitization process, it is better to pick points that are as far away from each other as possible.
To acquire the data after plot axes calibration, several options are available. A tedious option is to manually select data points on the image (particularly helpful for low-resolution spectra with error bars). A zoomed view, on the top-right corner of the screen, see Fig. 2, helps to be precise and reflects actual data coordinates corresponding to the mouse position on the image. The manual mode allows for point selection, adjustment or removal by manually clicking at the desired locations. An alternative, faster method, is to use the automatic mode. In the automatic mode, the user can set up and execute an extraction algorithm that can differentiate between the data points and the image background and identify several data points in a short time. This is the method that was used to extract the total flux spectrum from NGC 1068 from Code et al. (1993) in Fig. 2.
Boxes of user-defined sizes and a virtual pen are used to define the region of interest where the spectrum resides. The user literally paints the spectrum, without spilling over the axes or legends, and the algorithms look for the foreground color specified for the data and ignore everything else. A background mode also allows the algorithms to include everything except the background color as potential data points, a very useful feature in the case of overlapping curves/spectra of different colors. If the user paints over the axes, then it is possible to erase the erroneous parts and paint again, without limits on the number of attempts. When the spectrum is fully colored, the user simply has to press the Run button to start the auto-detection algorithm. After this is completed, the detected points appear in red over the image (see Fig. 2). If necessary, one can adjust the parameters of the extraction algorithm, mask or color settings and run the algorithm until satisfied.
The last stage of the operation is to download the digitized values. By clicking the View Data button, a popup window appears and the values can be sorted by the variable or in order of the distance between the points (Nearest Neighbor). The final values can be copied and saved***A detailed user manual is available on the software webpage: http://arohatgi.info/WebPlotDigitizer/userManual.pdf, and additional examples are shown on YouTube videos..
2.3 Application to ultraviolet spectropolarimetric data on NGC 1068
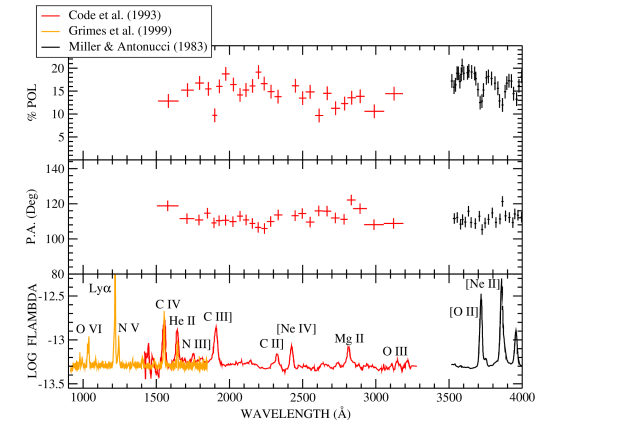
We used WebPlotDigitizer to extract the total flux spectra and polarization from old observations. Namely, we first extracted the ultraviolet flux spectrum (in log(Fλ)) from Grimes et al. (1999). They observed the far-ultraviolet spectrum (912 – 1840 Å) of NGC 1068 using the Hopkins Ultraviolet Telescope during the 1995 March Astro-2 mission. The spectrum is represented in orange in Fig. 3. Due the pixel resolution on screen the data are not as smooth as in the publication (resolution degradation to 0.5 Å) but all the emission lines and the absorption features are correctly duplicated, together with the proper fluxes levels. We then extracted the total flux spectrum and polarization degree and angle taken by the Lick Observatory 3 m Shane telescope mounted with a Cassegrain Pockels cell polarimeter (Miller & Antonucci 1983). The near-ultraviolet emission is shown in black in Fig. 3. Finally, in red, is the Hubble Space Telescope spectropolarimetric observation made by Code et al. (1993). We merged the three total flux spectra by normalizing their narrow line emission fluxes and continuum emission.
The final composite polarization spectrum of NGC 1068 is shown in Fig. 3. This is a compilation of all the observed ultraviolet polarimetric data we know on this nearby, very bright type-2 AGN whose optical polarized spectrum allowed in 1985 to understand the true nature of radio-quiet AGN (Antonucci & Miller 1985). The numerous gaps in wavelengths and the very low polarimetric data resolution for this source makes it a perfect target for new generations of space-based polarimeters. In this regards, POLLUX, a high-resolution ultraviolet spectropolarimeter for the LUVOIR space mission at NASA (Stahl & Hopkins 2015; Bolcar et al. 2016; France 2016; Peterson et al. 2017) is the ideal instrument. Supported by CNES and developed by a European consortium, POLLUX is expected to provide very high resolution polarimetric observations of bright sources in the 900 – 4000 Å band (desired wavelength coverage). The study of AGN at high polarimetric resolution will enable to probe the physics of outflowing winds with incredible precision. The launching site of the theoretical disk-born winds can be probed at the closest radii from the central supermassive black hole and the polarized emission line and continuum will be directly influence by the geometry and composition of the wind (Marin & Goosmann 2013a, b, c). Additionally, the composition of the dusty material, at radii larger than the physical limits imposed by dust sublimation, could be probed in a waveband where no terrestrial or space-born polarimetric data exists with sufficient wavelength coverage and resolution (Hines et al. 2001).
3 Conclusions
We have shown the ability of the WebPlotDigitizer software to precisely and efficiently digitize graphical spectra. Such an ability has potential implications for easy model-to-data comparison in many fields of astronomy. It can help access old data in record time without going through data reduction again and can be used, for example, to compile all existing spectra of a particular object. We applied WebPlotDigitizer to the case of NGC 1068, a bright type-2 Seyfert galaxy whose ultraviolet polarization spectrum lacks a proper coverage, both in wavelength and resolution. By creating the first composite ultraviolet polarimetric spectrum of NGC 1068, we highlighted the need for a high-resolution ultraviolet spectropolarimeter such as POLLUX.
Acknowledgements.
F.M acknowledges funding through the CNES post-doctoral position grant “Probing the geometry and physics of active galactic nuclei with ultraviolet and X-ray polarized radiative transfer”.References
- Antonucci & Miller (1985) Antonucci, R. R. J. & Miller, J. S. 1985, ApJ, 297, 621
- Bolcar et al. (2016) Bolcar, M. R., Feinberg, L., France, K., et al. 2016, in Proc. SPIE, Vol. 9904, Space Telescopes and Instrumentation 2016: Optical, Infrared, and Millimeter Wave, 99040J
- Code et al. (1993) Code, A. D., Meade, M. R., Anderson, C. M., et al. 1993, ApJ, 403, L63
- France (2016) France, K. 2016, in Proc. SPIE, Vol. 9904, Space Telescopes and Instrumentation 2016: Optical, Infrared, and Millimeter Wave, 99040M
- Grimes et al. (1999) Grimes, J. P., Kriss, G. A., & Espey, B. R. 1999, ApJ, 526, 130
- Hines et al. (2001) Hines, D. C., Schmidt, G. D., Gordon, K. D., et al. 2001, ArXiv Astrophysics e-prints
- Marin & Goosmann (2013a) Marin, F. & Goosmann, R. W. 2013a, MNRAS, 436, 2522
- Marin & Goosmann (2013b) Marin, F. & Goosmann, R. W. 2013b, in SF2A-2013: Proceedings of the Annual meeting of the French Society of Astronomy and Astrophysics, ed. L. Cambresy, F. Martins, E. Nuss, & A. Palacios, 475–478
- Marin & Goosmann (2013c) Marin, F. & Goosmann, R. W. 2013c, in SF2A-2013: Proceedings of the Annual meeting of the French Society of Astronomy and Astrophysics, ed. L. Cambresy, F. Martins, E. Nuss, & A. Palacios, 479–482
- Miller & Antonucci (1983) Miller, J. S. & Antonucci, R. R. J. 1983, ApJ, 271, L7
- Peterson et al. (2017) Peterson, B. M., Fischer, D., & LUVOIR Science and Technology Definition Team. 2017, in American Astronomical Society Meeting Abstracts, Vol. 229, American Astronomical Society Meeting Abstracts, 405.04
- Stahl & Hopkins (2015) Stahl, H. P. & Hopkins, R. C. 2015, in Proc. SPIE, Vol. 9602, Optics for EUV, X-Ray, and Gamma-Ray Astronomy VII, 960206