Picosecond timing of Microwave Cherenkov Impulses from High-Energy Particle Showers
Using Dielectric-loaded Waveguides
Abstract
We report on the first measurements of coherent microwave impulses from high-energy particle-induced electromagnetic showers generated via the Askaryan effect in a dielectric-loaded waveguide. Bunches of 12.16 GeV electrons with total bunch energy of GeV were pre-showered in tungsten, and then measured with WR-51 rectangular (12.6 mm by 6.3 mm) waveguide elements loaded with solid alumina () bars. In the 5-8 GHz single-mode band determined by the presence of the dielectric in the waveguide, we observed band-limited microwave impulses with amplitude proportional to bunch energy. Signals in different waveguide elements measuring the same shower were used to estimate relative time differences with 2.3 picosecond precision. These measurements establish a basis for using arrays of alumina-loaded waveguide elements, with exceptional radiation hardness, as very high precision timing planes for high-energy physics detectors.
I Introduction
Future colliders with center-of-mass energies in the tens to even a hundred TeV are now under detailed study TeVColliders ; Chekanov17 . Among the most pressing design issues is the need for new methods to address the daunting levels of pileup in detectors near the collision region. Equally challenging are the high levels of ionizing radiation near the beam, leading to more and more rapid degradation of detector elements as luminosity grows. One of the most promising ways to make progress on the former issue is to improve the detector timing precision down from the nanosecond to the picosecond level. And in the case of the latter issue, extreme radiation environments will require use of materials with intrinsic radiation hardness.
Significant effort is now underway to improve the timing of current collider detector technologies, and timing resolutions of 15-30 ps with silicon-based detectors have been demonstrated in some cases White14 ; Albrow14 ; Cartiglia17 ; Apresyan17 . Traditional vertexing of collider events has been primarily three-dimensional, with the event time generally known to no better than 100 ps, equivalent to 30 mm of spatial precision, far worse than the sub-millimeter precision of spatial trackers. In fact because of the finite duration of bunch crossings in the collision region, events may share the same vertex but a different time, or occur at the same time, at different vertices. With pileup events projected to be in the hundreds for the high-luminosity upgrade to the LHC, the need for four-dimensional vertexing, including precision timing, is becoming acute. Planned timing upgrades to the 20-30 ps range will lead to timing constraints of order 1 cm, a significant improvement but still an order of magnitude from the spatial tracker constraints. It is evident that for future colliders at even higher collision energies, fully commensurate four-dimensional fits to vertex positions will become critical to optimizing performance of these systems.
With such precision timing and radiation hardness goals in mind, we have performed an experiment to test the possibility that coherent microwave Cherenkov signals arising from the Askaryan effect Ask62 can be used to for precision characterization of high-energy particles via their secondary electromagnetic showers. To achieve adequate sensitivity, we use cryogenic cooling to reduce thermal noise, and dielectric-loaded waveguide elements to yield controlled geometries that afford high-precision timing. Copper waveguide loaded with solid alumina, among the most radiation-hard dielectrics known, is used as the detector element. Our goal was to establish scaling relations for the least-count energy in such a detector, and how arrays of such elements might perform as a timing instruments for constraining vertex geometry in a sampling high-energy physics detector. These goals have been investigated via the SLAC National Accelerator Laboratory program, experiment T-530, entitled the Askaryan Calorimeter Experiment (ACE)Note1 .
The Askaryan effect – coherent radio Cherenkov emission from the negative charge excess in a high-energy electromagnetic cascade Ask62 – was first confirmed at SLAC in 2001 SLAC01 using a silica-sand dielectric target in the T-430 experiment. Cosmic-particle-induced radio impulses based on the Askaryan effect provide the basis for a host of particle astrophysics experiments within the last two decades primarily aimed at detecting ultra-high-energy neutrinos Hankins ; GLUE ; RICE ; ANITA . In these experiments, the high-energy particle cascades take place in unbounded dielectrics, such as cold polar ice, or the lunar regolith, and the resulting radio signals are detected by embedded or external detectors. In general, because of the large scale of these experiments and the presence of natural thermal noise, the primary particle energy threshold for the radio emission to exceed thermal noise is in the tens of PeV to EeV range or more. Such methods thus have to date not been viewed as relevant for precision particle detection in high-energy physics accelerator or collider experiments.
Coherent microwave to millimeter wave emission from high-energy charged particle bunches has been studied at accelerators for many years, primarily with a view to improve beam diagnostic methods. Takahashi et al. (2000) Tak2000 specifically studied the generation of mm-wave coherent Cherenkov radiation from electron bunches in close proximity to, though without entering, adjacent dielectrics. Other sources of coherent millimeter and microwave radiation including synchrotron, transition radiation, and Smith-Purcell radiation have also been studied under similar conditions cohRad1 ; cohRad2 . In these experiments, the bunch charges are typically very large, to enhance the microwave or mm-wave power by the quadratic dependence of power on bunch charge in coherent radiation. To date, these investigations have not considered detection of particles using secondary emission from the Askaryan effect, but the theory developed in support of these experiments will help to provide a context for evaluating Askaryan-induced emission as a high-energy physics tool.
In the following, section II outlines the theory of Cherenkov emission from a finite track in a dielectric. Section III provides a detailed description of the detector design, including (A) GEANT4 simulations of the particle showers in the detector, (B) finite-different-time-domain simulations of the electrodynamics of this process, and (C) applications of these results to the theory of section II. Section IV describes our beam test experiment and the results, which include (A) high and (B) low beam current tests, (C) energy calorimetric results, and (D) fast timing results. Section V discusses some important issues such as (A) the effects of system noise temperature, (B) track length in the detector, (C) magnetic field effects, and concludes with (D) some discussion of applications for the methodology.
II Background theory
Our detector concept employs a finite track of a relativistic charged particle bunch through a dielectric bounded on either end of the track by the conductive waveguide wall, a classical application of Cherenkov radiation from finite tracks, first described by Tamm in 1939 Tamm39 . The charged bunch can originate as a secondary shower from a single primary energetic particle, in which case the charge excess is the relevant contributor, or it could be a pre-collimated bunch delivered by an accelerator. The coherent microwave and millimeter emission from the latter process was studied in detail in the 1990’s in accelerator experiments Tak2000 . In these efforts the difference between Cherenkov and transition radiation becomes indistinct when the track length becomes comparable to the wavelength scale of the frequencies involved, as is the case for our experiment.
Tamm’s theory did not distinguish between the nature of the radiation by this nomenclature, and it applies to either case. The theory is derived for only emission from a single charged particle, and thus coherent emission from many charges partially or fully in-phase must include the appropriate phase factors in computing their radiation field. Tamm also assumed open boundary conditions for the radiation; thus a bounded waveguide structure will also modify the results. Although these modifications lessen the direct applicability of Tamm’s theory to our experiment, we will use it as a basis for comparison, particularly because it encompasses both Cherenkov and closely-related transition radiation which are the appropriate emission processes in our case.
For a finite-length charged particle track in a dielectric bounded by conductors, the power per unit solid angle , per unit frequency interval is
| (1) |
with the frequency-dependent angular response given by
| (2) |
Here is the fine structure constant, the index of refraction of the dielectric, the path length, the normalized particle speed, and the polar angle relative to the track. For a number of co-propagating charged particles in this scenario, the resulting power will depend on the summed electric fields produced by each particle, with respective phase factors:
| (3) |
Here is the field from the th particle, is its position, and the unit vector in the direction of observation. We will use this formalism for a first-order analysis of the expected signal in a later section.
III Detector Design
A high-energy charged particle or jet of particles propagating out from a collision vertex will generate showers along its track in any non-vacuum portion of a detector system. Of course measurements of these showers are essential to calorimetric detectors. The material in which the shower is generated must therefore be able to either directly sample the shower particle density, or measure it by secondary emission. In our case, while sampling of showers using radio Cherenkov emission is calorimetric, its relatively high least-count energy resolution (at least in the current realization) leads to reduced importance of the calorimetry in favor of the timing resolution.
Whether used for calorimetry or timing, the material that samples the shower must be transparent to the microwave emission generated in it, as this emission must propagate over a significant distance in the waveguide element. Since this material is likely to also be very near the interaction region, especially in a forward detector, it must also possess a high immunity to radiation damage. Materials of higher density and higher microwave dielectric constant will also increase the coupling of the microwave signal to the waveguide element. Finally, the manufacturability of the material into shapes commensurate with a rectangular waveguide is important. These considerations lead to alumina, a ceramic available at low cost with very high purity, as the material of choice in our detector.
For alumina (aluminum oxide, Al2O3) at microwave frequencies, the real part of the relative dielectric constant is typically and remains constant over a wide range of frequencies. The dielectric loss tangent of pure Alumina at microwave frequencies is typically , among the lowest of any material known; only sapphire (which is also a form of Aluminum oxide) and fused silica possess lower loss tangents, at least among any commonly available solid dielectrics. Fused silica is also an excellent choice from the point of view of its low loss tangent and radiation hardness, however its density and dielectric constant are of order half that of Alumina and sapphire, which has impact both on the frequency response of loaded waveguide elements, and in reducing the coherent Cherenkov signal. Synthetic sapphire exceeds Alumina in all relevant microwave and material properties, but would require a costly manufacturing process for rectangular bars.
Alumina is used ubiquitously for electrical insulators in a very wide range of applications, including in reactor cores where the radiation environment (particularly neutrons) is very intense. It is also among the best and most robust of high-voltage insulators; automobile spark plugs are commonly built with Alumina insulators. Under heavy irradiation, Alumina can develop slight radiation-induced conductivity (RIC) Al1 ; Warman91 . This RIC never reaches a level capable of causing high voltage breakdown, and the impact on the microwave loss tangent is also small Molla95 .
Alumina is also quite dense among standard ceramics, g cm-2. This leads to more compact shower development within the material, and a smaller Moliere radius, leading to microwave coherence at higher-frequencies than other low-loss dielectrics such as polyethylene, teflon, or fused silica.
These considerations, as well as the ready availability of high-purity rectangular alumina bars that fill standard waveguide shapes, led us to choose alumina as the dielectric load in our beam test waveguide elements. For rectangular waveguide uniformly loaded with a low-loss, non-magnetic dielectric, the frequency of the waveguide cutoff for the lowest-order mode scales as :
| (4) |
where is the larger dimension of the rectangular waveguide, is the speed of light. The upper limit for single-mode operation depends on the appearance of the next-order mode; for standard rectangular waveguide, this limits the upper range to . Operation too close to the lower frequency cutoff is also difficult because of dispersion effects, so one typically moves up about 15-20% above the cutoff to ensure a clean signal transmission.
Thus for WR-51, with cross-sectional inner dimensions of mm, the normal waveguide cutoff for the unloaded mode is 12 GHz, but due to impedance dispersion close to the cutoff, the practical operating single-mode bandwidth is 15-24 GHz. The operating band moves down to 5-8 GHz when loaded with Alumina. For standard waveguide this poses another problem: the intrinsic impedance also scales in a similar way, and thus the nominal 50 waveguide develops a characteristic impedance of closer to 17 . An impedance transition is therefore necessary to efficiently couple out the signals into standard coaxial cable.
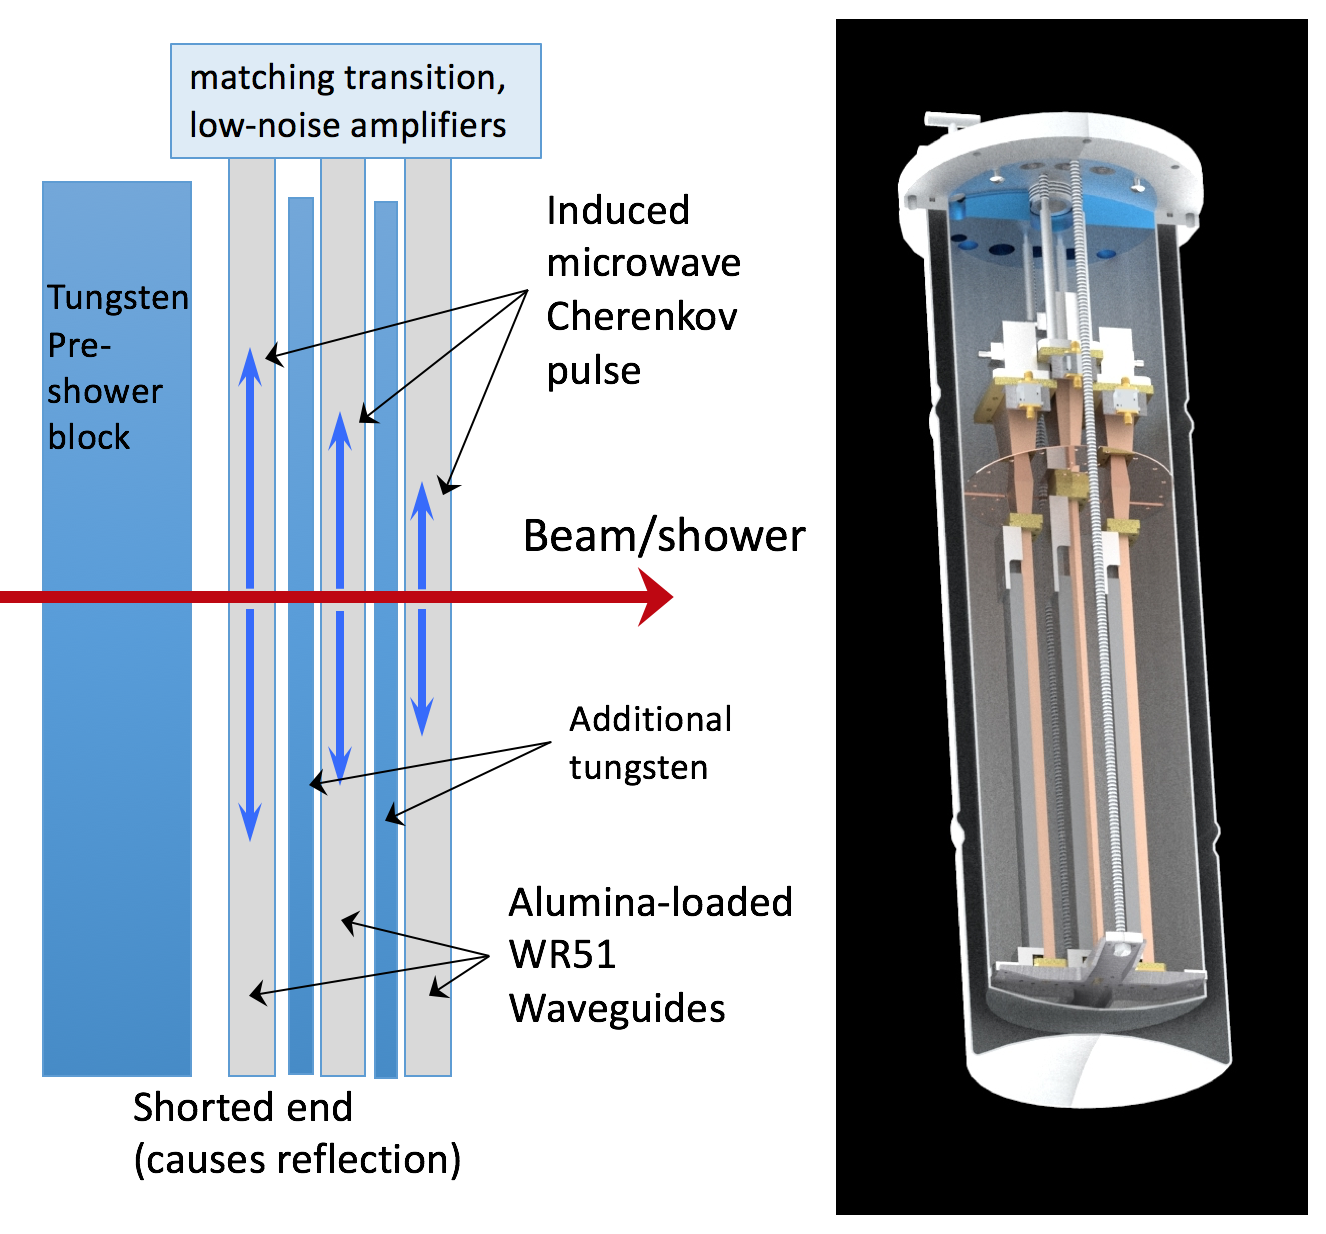
Fig. 1 shows both a conceptual diagram (left) and solid model (right) of our initial experimental prototype. Three loaded waveguides are aligned transverse to the accelerator beam. A radiation length (RL) tungsten-alloy bar (90% W, 7% Ni, 3% Fe) is used as necessary to pre-shower the particle bunch, and additional 2.5 RL tungsten bars also may be used to further increase the rate of shower development between the waveguide elements. The combined radiation length of the two 1 mm copper waveguide walls, and the 6.3 mm thick Alumina bar contributes and additional 0.23 radiation lengths per ACE element. Microwave emission is induced within the waveguides by the charge excess, coupling to the internal waveguide modes, and then propagating to both ends. On one end, the received signal passes through an impedance-matching transition, and is coupled out to a microwave low-noise amplifier (LNA). On the other end, the waveguide is shorted, and the signal reflects as an inverted pulse, and then propagates back up to the LNA.
The charge excess can also include a significant or even dominant contribution from the input charge of the bunch. In fact we used bunches with high charge levels, and no tungsten elements, to initially verify the system performance. Once the input bunch charge falls below several hundred electrons, the secondary charge of the EM shower becomes dominant, and the Askaryan charge excess supplies the net current element that induces the microwave impulse.
We then use secondary amplifiers to increase the signal up to a level where it is then able to be digitized using a Tektronix TDS6804 (8 GHz bandwidth) or TDS6154 (15 GHz bandwidth) oscilloscope. The right side of Fig. 1 shows a rendering of the actual detector assembly, contained within a liquid nitrogen dewar.
III.1 GEANT4 shower simulations
Even relatively simple multilayer particle detectors produce showers with a high degree of complexity due to the myriad of possible interactions. To simulate the shower development in ACE we created a GEANT4 model of our system which allows us to predict the total and net charge distributions in each ACE element, along with time and spatial profiles to evaluate the form factors of the evolving shower front as it passes through the system GEANT .
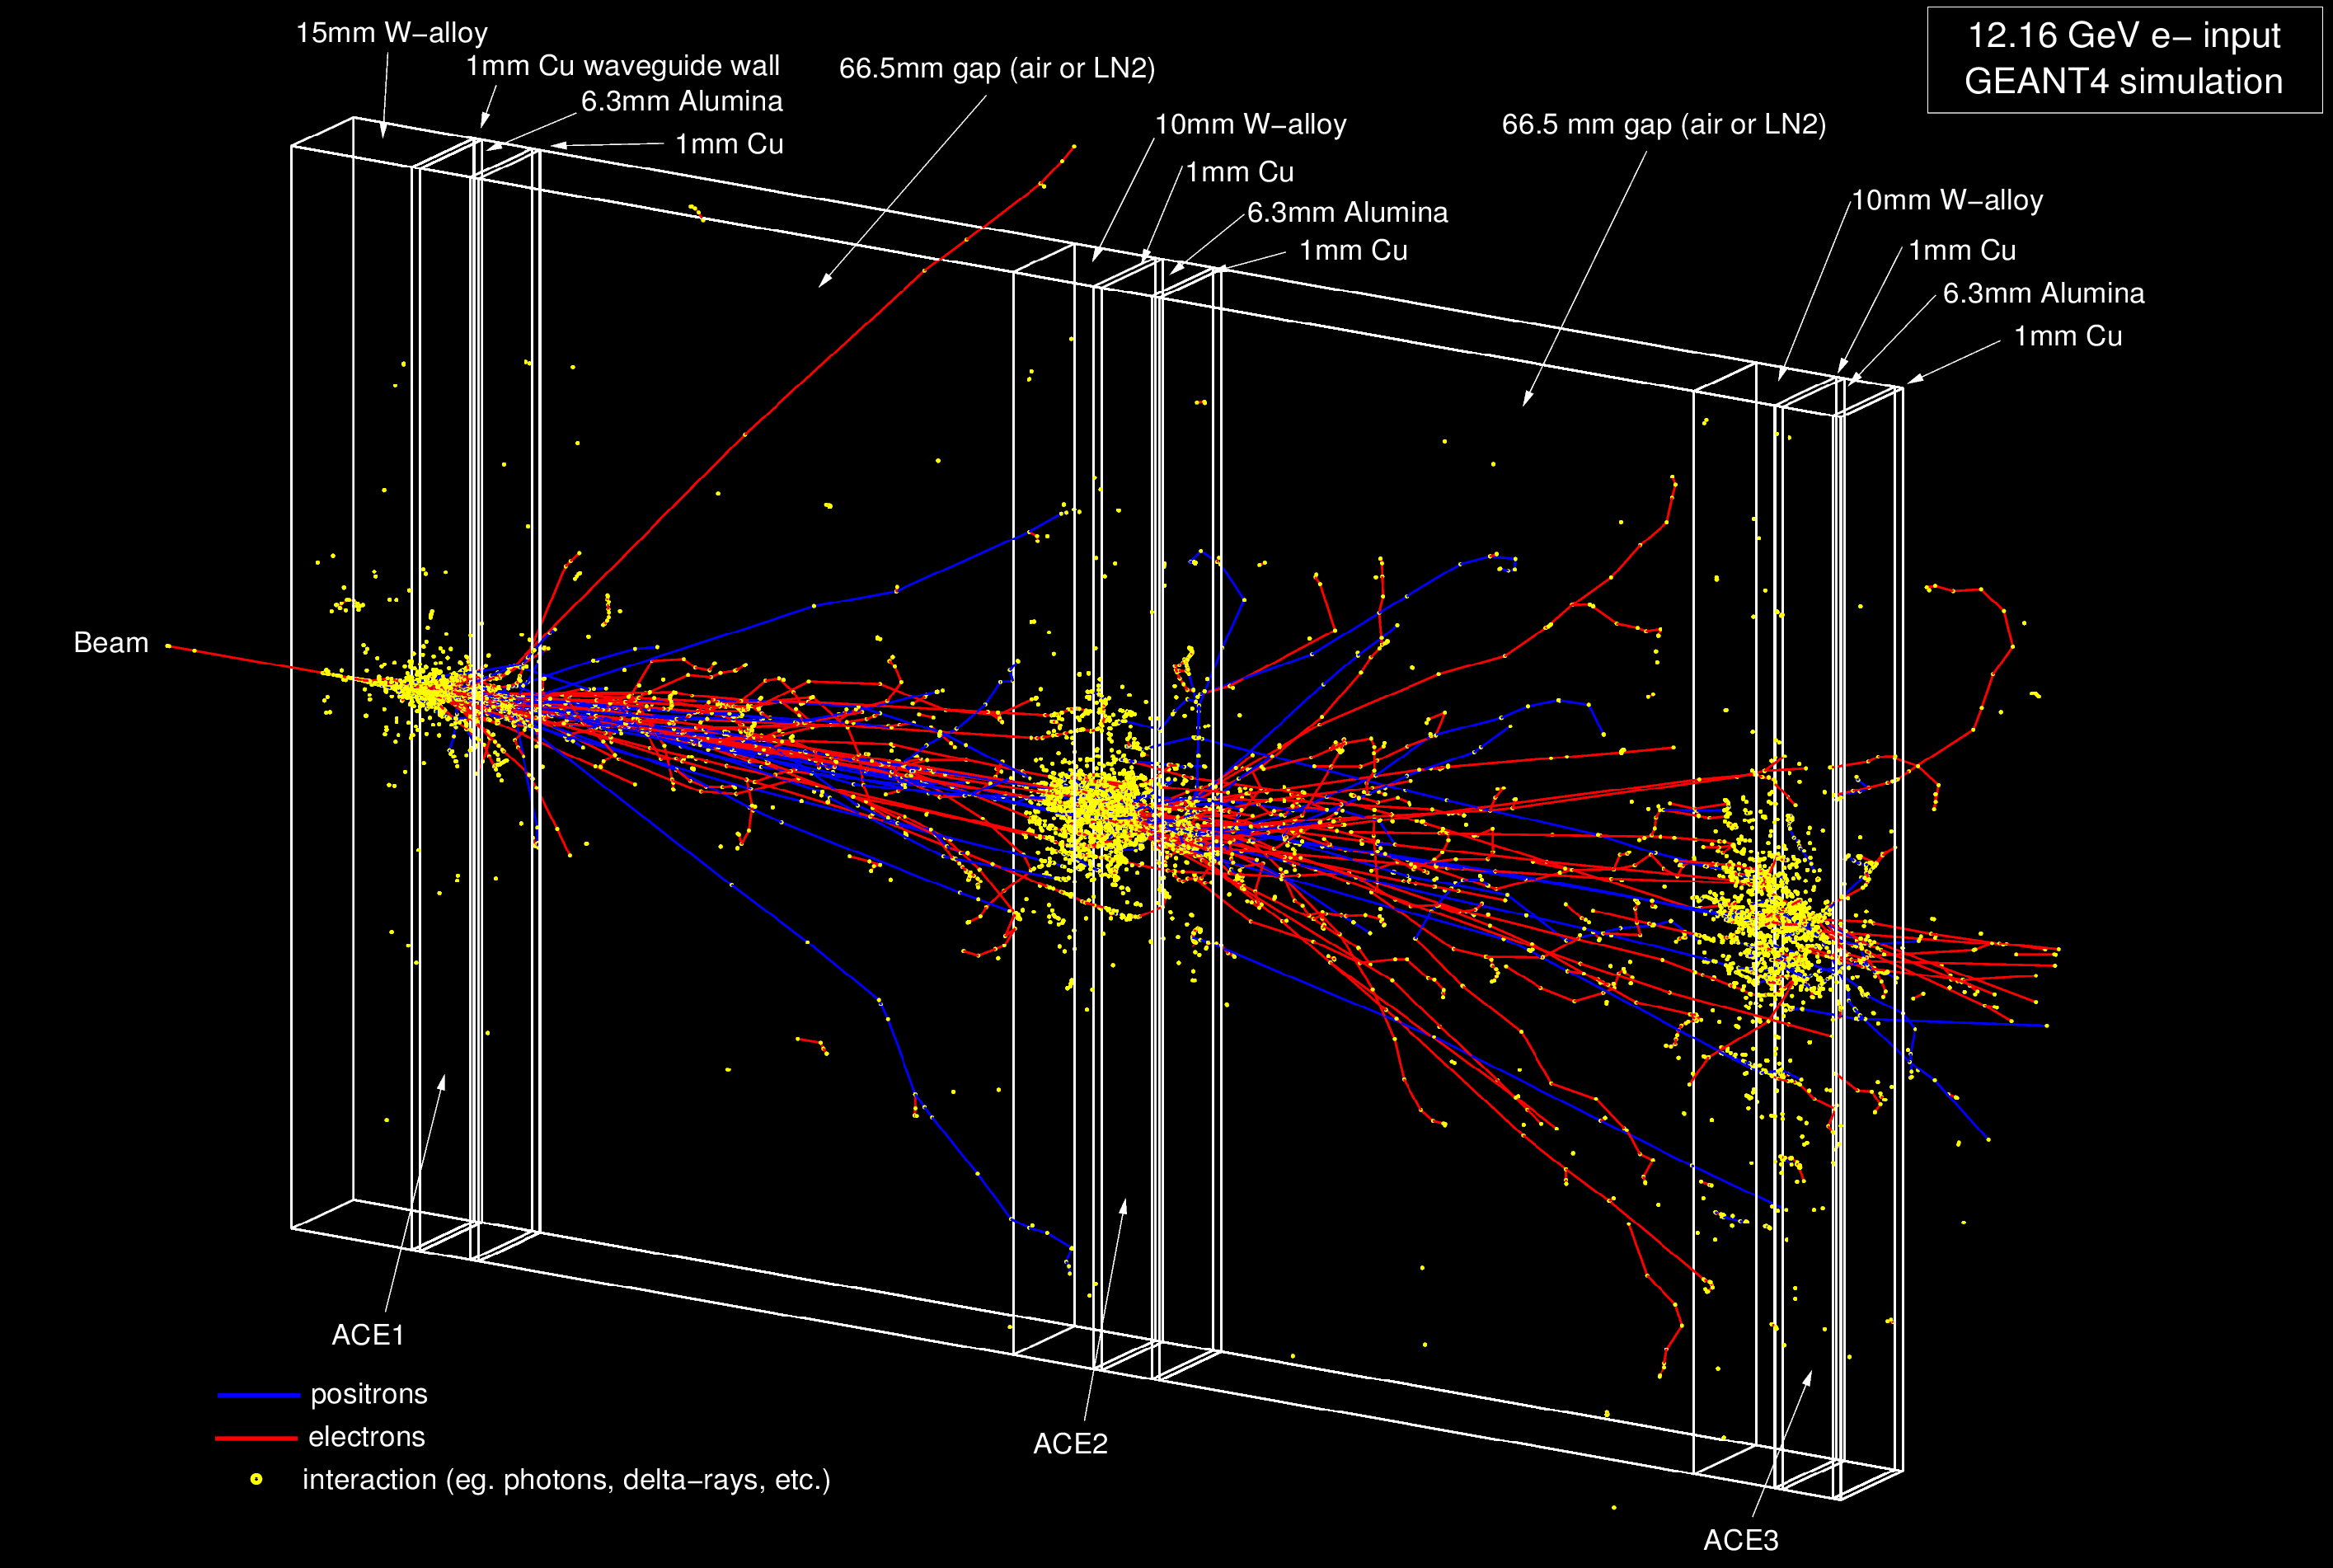
Fig. 2 shows a labeled wireframe representation of our detector, along with an example of a single simulated shower from a 12.16 GeV electron. For simplicity we have ignored the beam pipe exit window (very thin aluminum), the m of air between this exit and our dewar, and the mm of stainless steel in the dewar wall. Positrons are shown as blue tracks, electrons as red tracks. Yellow dots mark vertices of a variety of interactions and collisions, and here we include those vertices from photons, although the photon tracks themselves are suppressed for clarity. Because Alumina has a high microwave index of refraction , and we are interested in all that could produce Cherenkov emission, we do not cut off any low energy electrons, down to well below the Cherenkov threshold determined by .
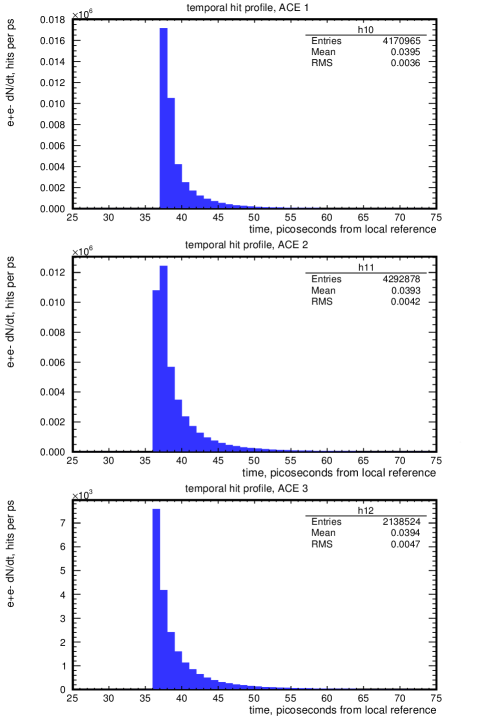
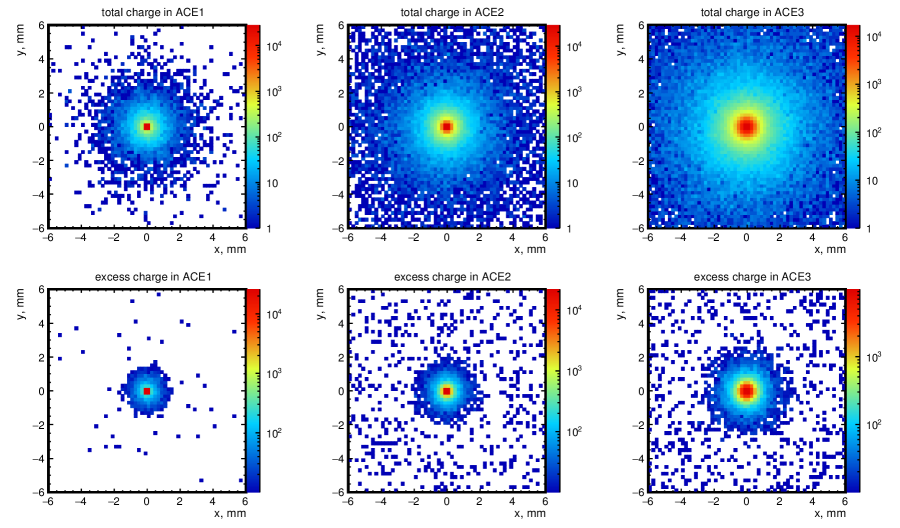
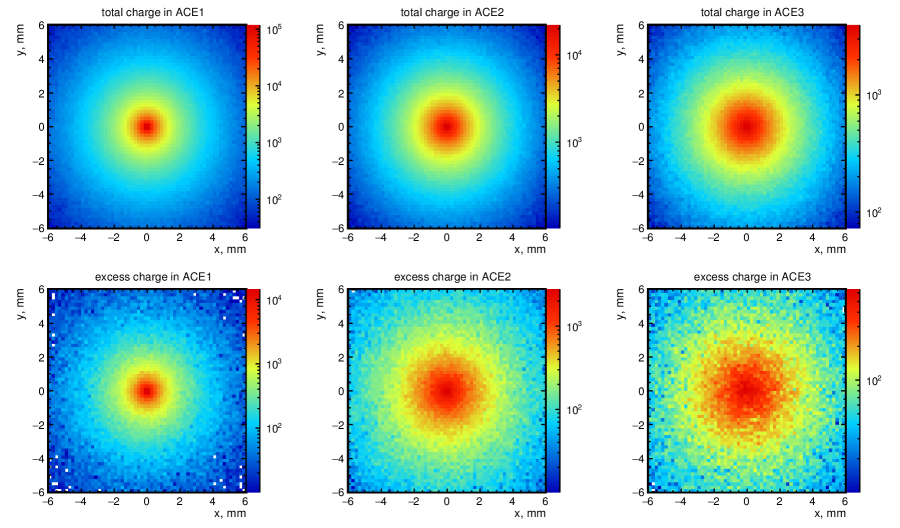
Fig. 3 shows the simulated distribution of charge passing through a mm portion of the detector around the beam axis for two cases: the upper two rows for 6.4 GeV electrons and no tungsten, and the lower two rows for 12.16 GeV electrons and the full load of tungsten, including the pre-shower block and additional blocks between the elements. In each case electrons were simulated. Shower development in the first case is observed to be very limited, consistent with the 0.23 radiation length of material per ACE element. To compute the charge excess, we assign opposite weights to positrons (-1) and electrons (+1) in the histogram, which is clipped at zero. In the second case, we expect shower maximum to occur in the tungsten prior to the second ACE detector, and thus the shower is declining by the third detector.
For purposes of estimating the net charge for Tamm’s theory, we integrate the charge (or charge excess) within the inner quarter-wavelength central region around the beam axis, since beyond that limit the Rayleigh criterion will no longer be satisfied and destructive interference will diminish the coherent field contribution. A better approach would be to couple the GEANT4 simulations directly to an electromagnetic simulation, using equation 3 above to determine the phase factors, but this option is complex to develop for our geometry and thus beyond our scope in this report.
The average charge excess in each of the three detector elements from Fig. 3 is integrated over a centered mm area and scaled to the equivalent of 100 incident beam electrons, giving a net excess charge of 112, 117, and 122 electrons per 100 incident electrons for ACE1, ACE2, and ACE3 in the case with 6.4 GeV bunches and no tungsten. For the 12.16 GeV case with full tungsten, the excess charge is 611, 493, and 199 electrons per 100 incident electrons, corresponding to 18.2, 19.0, and 20.6% of the total charge for ACE1, ACE2, and ACE3 respectively. Since the amplitude of signals generated via the Askaryan effect is proportional to the coherent charge excess, we can expect that the amplitudes observed in our detectors should follow these ratios to first order. In addition, we can use these net charges as inputs to Tamm’s theoretical estimates of the microwave emission power.
In addition to the effect of space charge localization on microwave pulse coherence, we also consider the time coherence, since particles scattered away from the primary beam axis may also suffer delays. Fig. 4 shows the arrival times of the shower particles in each ACE element for the fully loaded tungsten case with 12.16 GeV electrons. In the temporal domain, the highest single-mode frequency in our system is 8 Ghz, giving 125 ps per cycle, or just over 30 ps per quarter cycle. It is evident that the vast majority of the charge in each case arrives well within 10 ps of the lead bunch arrival time, and we thus expect the time delays to have negligible effects on the phase coherence of the signals.
III.2 Electromagnetic signal simulation for initial design
There is considerable uncertainty in adapting current open-boundary condition theory and semi-empirical analysis for coherent microwave emission from an EM shower to the conditions of a closed dielectric-loaded waveguide. As noted above, the sudden appearance and disappearance of the charge excess as the shower enters and exits the waveguide will produce transition radiation that may constructively or destructively interfere with the coherent Cherenkov emission. In addition, the coupling of the radiation to the waveguide modes takes place in near-field conditions where calculations are challenging. Both Cherenkov and transition radiation produce emission that is azimuthally symmetric around the charged bunch track, but only a portion of this emission can couple to the longitudinally-propagating and modes of the waveguide. And finally, the very sharp impulsive nature of the emission produced by these radiation mechanisms does not lend itself well to standard single-frequency, steady-state analysis methods. While Tamm’s theory does account for the combination of TR and CR, it does not provide guidance on how to estimate the instrinsic time-domain pulse shape of the signal, which is critical to our detection process.
Fortunately there are numerical simulation methods developed for time-domain analysis which inherently obey Maxwell’s equations and are capable of high precision even in very complex geometries and with unusual source stimuli. These Finite Difference Time Domain (FDTD) methods provide a framework for gridded EM simulations that can be used for our application, with some careful attention to the representation of the source current, which in our case is a relativistic current impulse. For our simulations, we build models using Remcom’s XFDTD simulator XF7 .
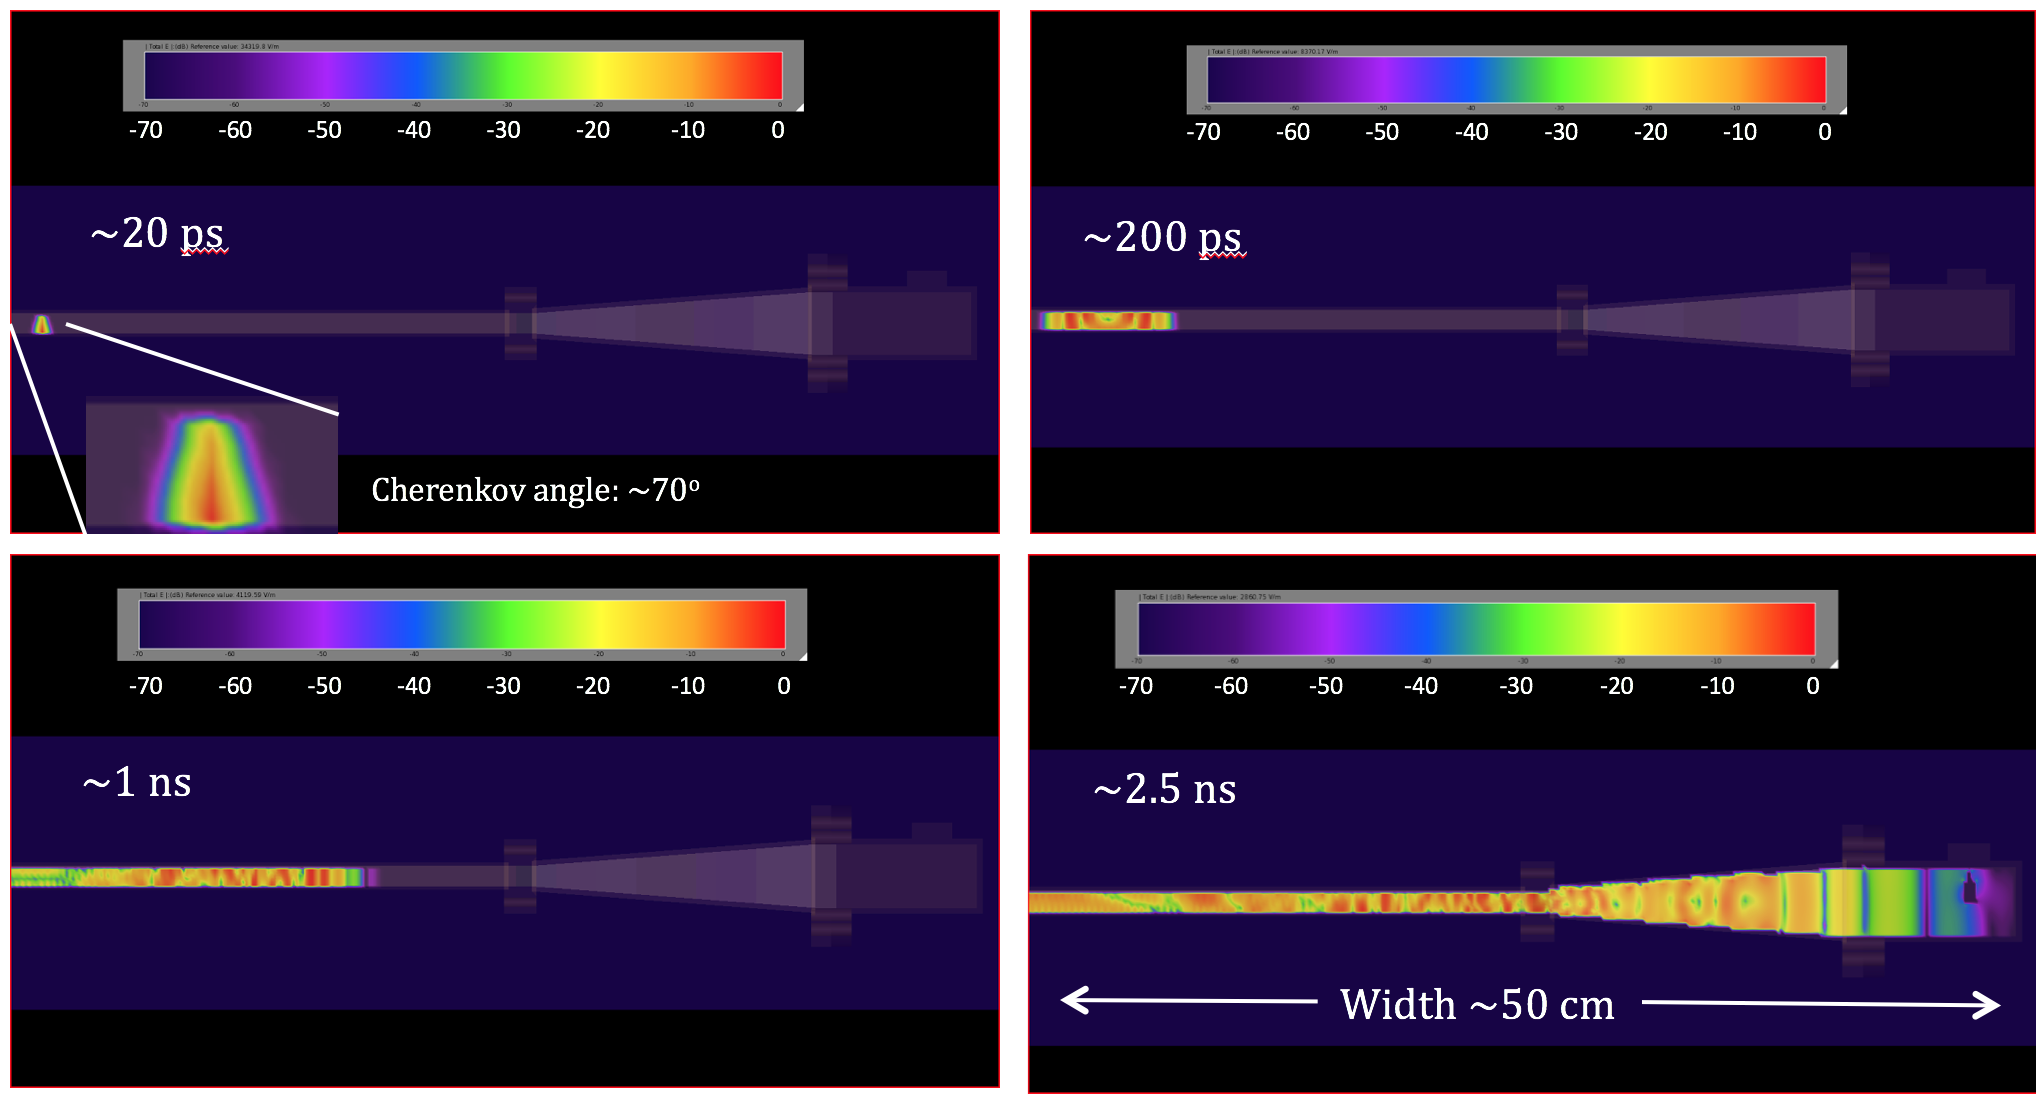
Fig. 5 shows four time slices of the signal generated in one simulation through one of the detector elements. The beam transits from bottom to top in the initial, upper left pane, and generates a transient signal with Cherenkov-like characteristics, at an angle of relative to the beam direction, consistent with the radio index of refraction of alumina. In the second frame of the sequence, the signal can be observed to propagate symmetrically in opposite directions within the waveguide, although in these frames we only follow one of the signals to the waveguide transition. In the third (lower left) frame, the leading portion of the pulse couples to the dominant mode in the waveguide, while some trailing transient modes are still evident. In the final frame, the wavelength then expands as the signal passes into the tapered transition and then into the waveguide-to-coaxial adapter, through a stepped gradient of the index of refraction.
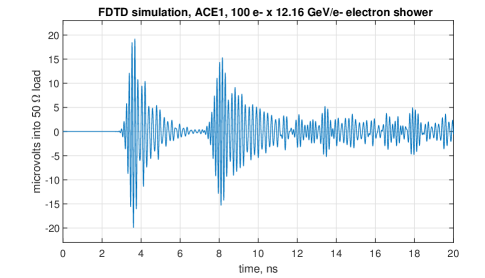
Fig. 6 shows a detailed FDTD simulation of the as-built ACE detector, excited via a source designed to closely mimic the current impulse produced by a relativistic charge bunch transiting the waveguide element. In this case one end of the waveguide element has been shorted as in the deployed version of the detector. The current pulse amplitude matches the GEANT4-determined amplitude for a 100-electron 12.16 GeV shower through the initial tungsten radiator, giving a 611-electron bunch in the waveguide element. The resulting response includes the reflection from the far end, as well as the residual ringing caused by the lack of matched termination of that shorted end. The pulse resulting from the secondary reflection also transits a much longer section of the waveguide, leading to a larger degree of absorption and waveguide dispersion as observed.
This waveform has also been filtered to limit the output to only the 5-8 GHz single-mode response of the waveguide; this is necessary since the very sharp current impulse excites all of the higher-order modes of the waveguide as well, but these are generally too complex in their behavior to be of use for these measurements. We do not show the expected thermal noise of the system in this simulation; but we note that the V peak output of the leading pulse is about 3.3 times the thermal noise level at the K system temperature measured for the detector when cooled by liquid nitrogen.
The FDTD simulations illustrate one of the features that enables very precise timing: the modulation pattern observed provides a very effective time-domain vernier with frequency content much higher than is typical for detectors used in high-energy physics. This is due in part to the effects of waveguide dispersion, which extend the duration of the pulse and increase the number of cycles of the passband modulation. This comes at some expense in the overall peak amplitude of the pulse, but because it is deterministic depending on the waveguide used, it can be removed completely in analysis.
III.3 Tamm theory estimation
The FDTD results, which rely only on a finite-element implementation of Maxwell’s equations, include all of the electrodynamic radiation mechanisms for a relativistic charge bunch passing through a loaded waveguide, and also include the intrinsic waveguide coupling, dispersion, along with inefficiency and losses. It is howeve useful to also make a signal strength estimate based on Tamm theory to confirm the order-of-magnitude of the simulation.
To do this, we introduce an ansatz regarding the coupling efficiency of the finite-length Cherenkov emission to the waveguide. We assume that energy emitted within around the longitudinal axis of the waveguide will be coupled into the lowest order mode, and we numerically integrate equation 1 above over this range. This assumption is motivated by standard methods of coaxial-to-waveguide coupling, which make use of quarter-wave monopole feeds to excite the mode in standard rectangular waveguide.
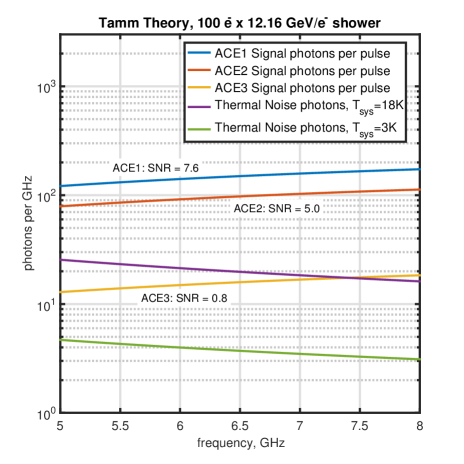
Fig. 7 shows the results of this for the parameters of our system, using alumina-loaded WR-51 with a system noise temperature we estimated at K, and a bunch charge equivalent to that produced by a 1200 GeV shower via the Askaryan effect. The system temperature is dominated by the low-noise amplifier; since the alumina loss tangent is negligible it does not contribute to the thermal noise, and the waveguide losses at our frequency range also contribute only a fraction of a Kelvin of thermal noise. The results of Fig. 7 are given in terms of differential photon counts for both the signal and the background thermal noise. We also include the thermal noise for a much lower noise commerical amplifier, giving K. Because we are operating with very low-noise amplifiers and in cryogens, the resulting signals approach the regime , and we thus use the proper estimator for the standard deviation in photon counts Zm03
| (5) |
where is the receiver efficiency (about 0.9 in our case), and is the mean photon count integrated over the frequency band. Fig. 7 also indicates the signal-to-noise ratio for each of the three ACE channels in the fully loaded tungsten case.
The results indicate a SNR which is about a factor of 2 higher than that given by the FDTD simulation. It is likely that several factors, including lower coupling efficiency than we have assumed, along with waveguide losses and dispersion, contribute to a reduction of the peak amplitude in the FDTD simulation, and accounting for these factors the two methods give reasonable agreement. In fact, as we will show in later analysis, deconvolution of the waveguide response using correlation methods recovers most of the difference in SNR that we observe here.
IV Beam Test Description & Results
Our initial ACE beam test, was performed at the SLAC National Accelerator Laboratory as experiment T-530, and took place over the period August 5-10, 2015 in the End Station A Test Beam facility (ESTB).
Because the beam parameters were set by experiments underway at the SLAC Linear Collider Light Source (LCLS) facility, we initially ran with electrons of energy ranging from 4-6 GeV. Beam currents were controllable from electrons per bunch down to as low as several tens of electrons per bunch. The gain of our low-noise amplifiers and signal chain, when fully instrumented, was of order 65 dB, allowing us to reach thermal noise levels for the low-beam current cases. Initially, however, to establish timing and optimize the placement of our detectors, we ran at high beam currents without amplification.
Since the generation of microwave Cherenkov emission arises from any beam current passing through our detector, whether it is part of the charge excess in an EM shower, or just the current impulse from a transiting electron bunch, our initial testing was done without the tungsten in place. In fact this was preferable during the runs with 4-6 GeV bunch energy, since at this energy, the multiplication of charge in the shower is much reduced compared to higher energies, thus reducing the contribution from the Askaryan effect compared to the direct Cherenkov of the transiting bunch. These earlier runs allowed us to optimize our configuration for the final testing which was done with 12.16 GeV bunches, for which the Askaryan contribution is dominant.
IV.1 High beam current tests
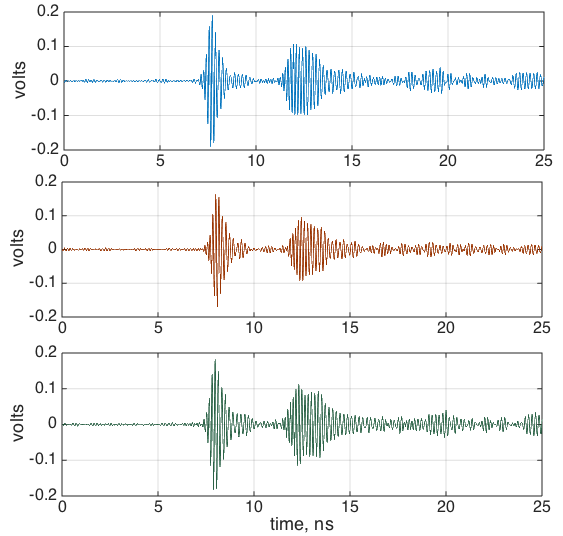
Fig. 8 shows a typical set of beam-induced impulses from a run with a 6 GeV beam, taken with a high beam current of electrons per bunch, and no LNA amplification or tungsten radiators. The goal for these initial data was to establish the behavior of the underlying emission process in the absence of thermal noise or significant shower development. The figure panes from top to bottom are the microwave signals for the three WR-51 elements from front to back. No correction for cable timing offsets have been done in these data, thus the time delays in the traces do not yet accurately reflect the physical offsets. As noted above for the GEANT simulations, each ACE element is only 0.23 radiation lengths thick, and thus shower development between the first and third element is only slight, leading to similar signals in all three detectors. Variations are due to slight differences in the coupling and also the length of the three elements; the center element was 2.5 cm for mechanical reasons.
The initial peak in each of the traces in Fig. 8 is the direct signal from the beam transit, followed by the reflection off the far end, which suffers from roughly three times the dispersion of the direct signal, and is thus reduced in amplitude. Comparison of the shape and modulation of the direct peak to the simulations shown in Fig. 6 shows good agreement with expectations. The lower amplitude of the reflected pulse is likely due to imperfections in the coupling of the end of the Alumina and the shorting plate.
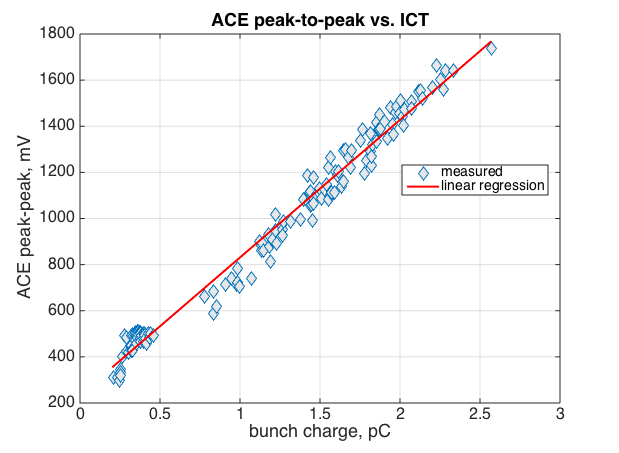
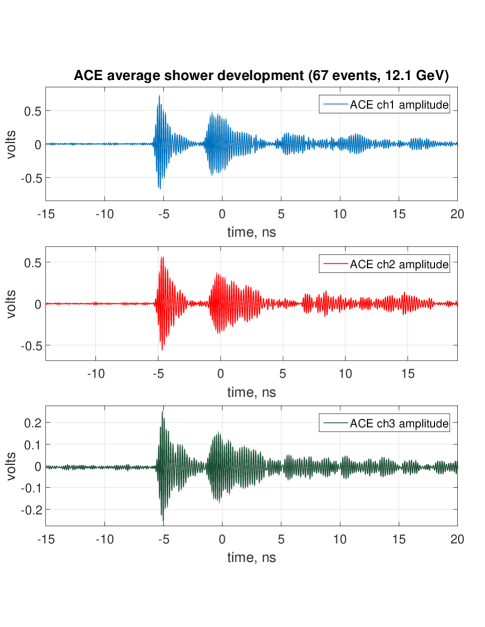
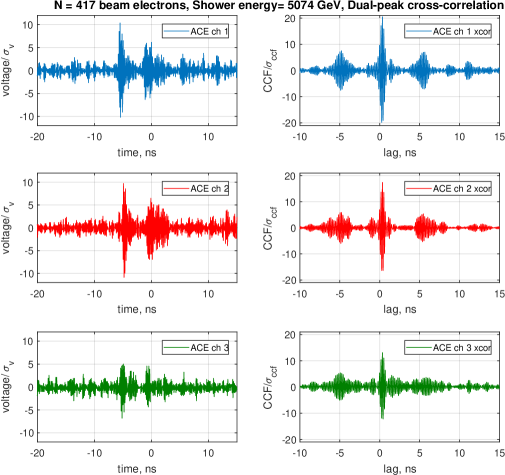
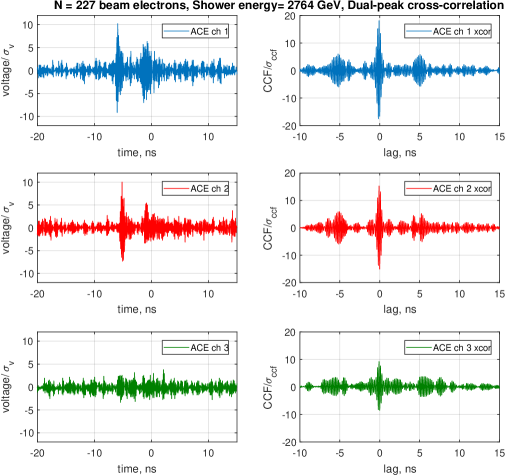
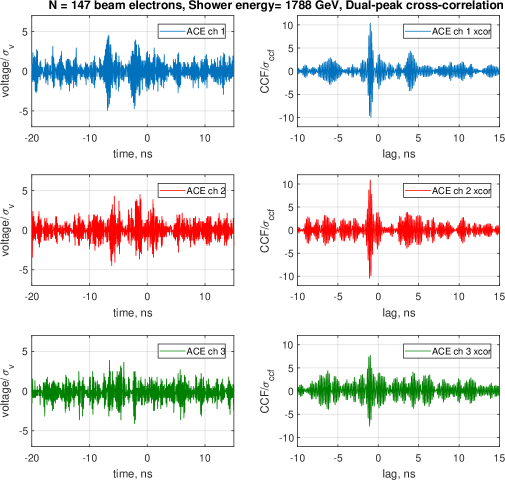
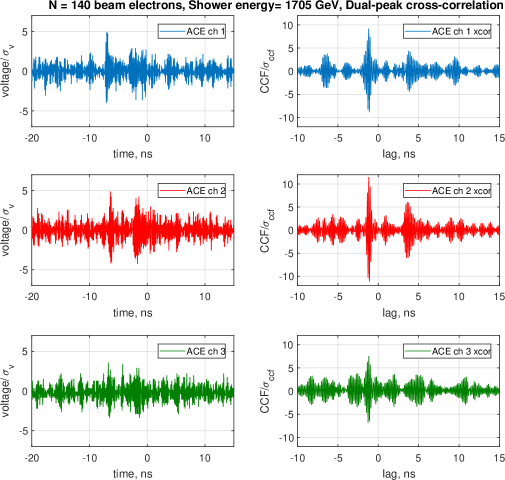
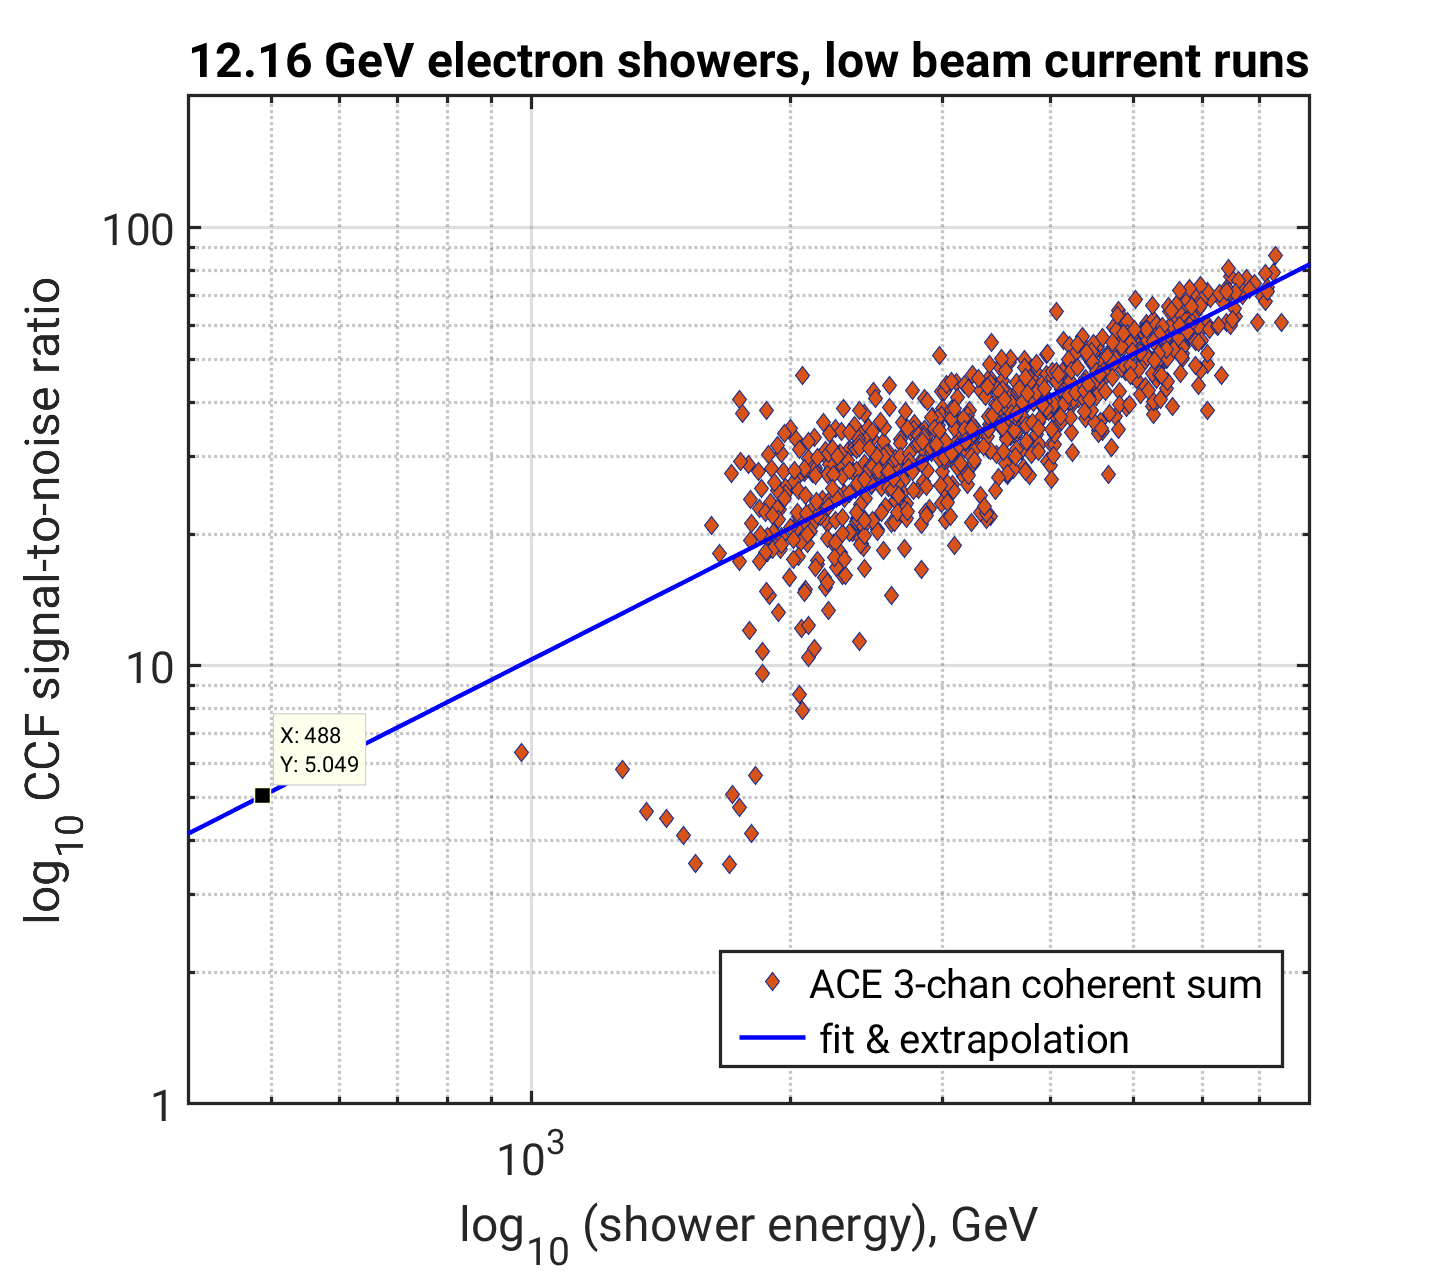
Fig. 9 shows the correlation of the peak-to-peak amplitude of the ACE signals with beam current measurements from a commercial Integrating Current Transformer (ICT) used to accurately estimate the actual delivered beam current to our target. This covers a range from where the ICT drops below its limiting sensitivity at about 0.2 pC per bunch, up to about an order of magnitude higher. Slight deviations from a linear trend could be due to uncalibrated ICT or ACE non-linearities, but overall the correlation is quite good, indicating that the emission in ACE is dominated by coherent effects, as expected.
IV.2 Low beam current runs
Since one of our goals in T-530 was to operate the detector at or near its threshold of least-count energy sensitivity, we used a combination of beam collimators, screens, and a momentum slit to reduce the beam current to the minimum level where the signal could still be detected, now using our full low-noise amplification signal chain, and liquid nitrogen to reduce the thermal noise of the system. In addition, because we wished to enhance the Cherenkov emission from the Askaryan effect well above any subdominant transition radiation effects, we focused our efforts on using higher energy bunches, in this case 12.16 GeV which was available during our run. With the tungsten blocks in place, the ACE counters measure the shower at depths of between 4-8 radiation lengths.
To trigger the system and independently establish the beam current we used a separate, thin-target optical Cherenkov detector coupled to a silicon-PMT (SiPMT) array. In practice, we found that the SiPMT detector was usable down to a minimum beam current of electrons per bunch, and thus for this experiment the SiPMT determined the the detection floor, equivalent to a least count energy of order 1500 GeV per bunch for the 12 GeV runs. The composite bunch energy is our effective proxy for the single particle energy of a secondary in a vertex collision experiment (assuming that the bulk of its energy is deposited in an EM shower). While our minimum trigger energy was quite high in this experiment, it afforded us with sufficient data to estimate the intrinsic scaling to lower energies, including what could be achievable with more aggressive cooling, and higher-order detector combinatorics.
To ensure that the behavior of the instrinsic signal scaled closely from the high beam current runs, we selected events from the 12.16 GeV low-current runs with higher SNR, and created an average profile, as shown in Fig. 10. The signal shapes matches those taken at high beam current quite closely. The amplitude ratios in this case also follow closely the (6.1:4.9:2.0) ratios of excess charge for (ACE1:ACE2:ACE3) determined from the GEANT4 simulations above. Here we have scaled each y-axis range according to the GEANT4 excess charge ratios to illustrate this result by the graphical similarity. Only ACE3 deviates modestly from the excess-charge ratio, with an amplitude slightly larger than given by simulation; this may be due to the effect of the underlying Rician amplitude statistics of a signal in the presence of thermal noise, since ACE3 has the lowest SNR of the three channels.
Fig. 11 shows four typical events approaching SiPMT counter minimum energy. In each of the four events, on the left is the direct scope record, sampled at 20 Gsamples/sec, with the three ACE elements in the order front-to-back appearing top-to-bottom in the figure panes. As noted above the pre-shower tungsten is about 4 RL thick, each ACE element adds an additional 0.23 RL from the copper waveguide and alumina, and the later tungsten layers are each 2.5 RL. Thus the shower reaches its maximum development at these energies between the first and second ACE element. A reduction in microwave pulse amplitude in the later counters is evident.
On the right hand side of each of the figures, we show the cross-correlation function (CCF) of the signal with the signal template measured from an average of high-SNR events as shown in Fig. 10. The CCF is equivalent to using a matched filter based on the impulse and reflection, and yields a correlated amplitude, which is normalized to the root-mean-square of the CCF at non-signal lags. In effect, the CCF also removes the dispersion effects of the waveguide, and because the thermal noise is uncorrelated to the signal pulse, the result shows significant improvement in SNR, exceeding a factor of two in many cases. The CCF also estimates a time lag for the signal relative to the template, thus providing a high precision measure of the relative delay between the pulse and template. Both of these parameters are representative of the processed data that can be expected from such a detector in practice.
Because of the excellent timing precision afforded by the microwave signals, we can coherently sum all three of the ACE channels, using phase alignment provided by the CCF, to get an estimate of the least-count energy achievable with the current system. We define the least-count energy by requiring at least a detection above thermal noise. Fig. 12 shows a scatter plot of the combined coherently-summed SNR of the CCF, with a fit to allow for extrapolation to the least-count energy, giving 480 GeV at the level in this case. The extrapolation is necessary because the unexpected high energy threshold of our SiPMT detector. The least count energy is dominated in our case by the system thermal noise, which we estimate to be of order K for our LNAs used at liquid nitrogen temperatures.
The estimate from Tamm theory above indicated a single-element voltage threshold for ACE1 of about 1000 GeV. Empirically, the template CCF appears to improve the SNR by about a factor of two, and energy threshold should improve approximately as , which leads to a Tamm theory single-element estimate of order 700 GeV, close to what is observed. The combination of three elements, with improvement going as , implies a threshold least-count energy of about 400 GeV, commensurate with the experimental result. Thus while of necessity we used some ad hoc assumptions to apply the theory, there is experimental indication that these are not far from correct.
In general, the least-count energy should scale with , thus operating with better LNAs, colder cryogens, and more detectors in combination can reduce this by factors of several, possibly approaching 100 GeV.
IV.3 Energy calorimetric scaling
While our goal for ACE was not to create a new shower calorimeter, the Askaryan process by its nature lends itself to calorimetry, and it is thus useful to investigate the energy response to ensure that we understand the behavior of the system vs. energy. Fig. 13 shows the energy resolution vs. the beam energy. Because the energy measurement scatter was dominated by the coarse resolution of our SiPMT detector which operated near threshold, we used a two step process to estimate the energy resolution curve. First the average energy response function of the SiPMT was used to calibrate a scale for one of the ACE elements. Then we correlated the quasi-calibrated ACE element against the second ACE element to get a resolution function that reflects more accurately the quadrature response of the two ACE elements with respect to one another.
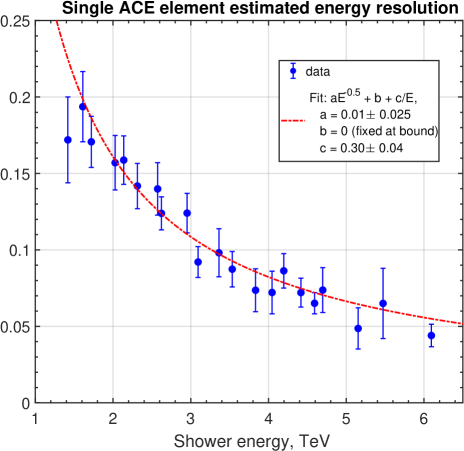
Fig. 13 shows the estimated energy resolution function based on the method outlined above. We confirmed that the measured data were dominated by thermal noise, and thus the CCF amplitude errors are uncorrelated between the two. Thus the estimated error bars as well as the fractional energy resolution, which arise from the convolution of the errors from two uncorrelated detectors, is estimated to be larger than what may be achieved intrinsically from a single ACE detector element. As noted above, the least count energy is quite high, but to the degree that the errors are dominated by thermal noise, the entire graph should scale down with a reduction in thermal noise. It is also worth noting that energy resolution is normally quoted for an entire detector system, which in our case would most likely improve the resolution by for detector elements.
We also fit these data to a standard parametric curve vs. shower energy , and find that the fit is dominated by the term; for these data we find for the quadrature response, or for a single calibrated element.
If in fact we aggressively reduce the thermal noise to put the least count energy down at 100 GeV as described above, the equivalent curve for samples of the shower would be
For which is realistic for a typical particle-induced shower, the resulting energy resolution is . While not of interest for current collider detectors, future TeV-scale colliders may benefit from this technology for shower calorimetry as well as timing. It is notable also that such technology could be applied immediately to heavy ion collisions, where nuclear fragments often carry multi-TeV energies in the angular region very close to the beam. Current high-rapidity forward collider detectors also do not generally provide high precision timing of such events, and thus the timing precision we detail in the following section may provide new tools for such investigations.
IV.4 Event timing
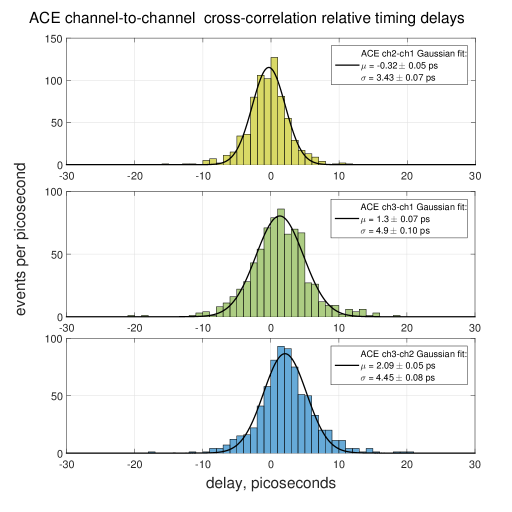
As we noted above in describing the phasing of the three CCF signals to produce a coherent amplitude estimate, the CCF produced by the template-matched optimal filter used in Fig. 11 above also yields a resolved time of arrival for the pulse. Again, since the time resolution precision afforded by the SiPMT detector, with a rise time of order 1 ns, was much coarser that the ACE elements, we estimate relative time differences from one ACE element with respect to another measured in all three channels within a single high-bandwidth oscilloscope, which preserves the intrinsically small jitter of the scope in our measurements. Since the thermal noise that dominates the errors in our measurements is intrinsically uncorrelated between different channels (we have verified this in many such experiments), the relative time differences are an accurate measure of the joint statistical precision that is achievable with these devices.
Fig. 14 shows the time resolution for the low-beam current data at 12.16 GeV electron energy, and composite bunch energies in the range of up to about 5 TeV. The fitted precision for measurement between the two higher SNR ACE detectors is ps, implying an intrinsic resolution of about 2.4 ps for each element. Some fraction of the scatter is also due to the intrinsic jitter of the Tektronix oscilloscope, which specifies a sample-to-sample time difference accuracy of 0.64 ps. Removing this from the measured jitter in quadrature gives a slightly better intrinsic resolution of 2.3 ps for the ACE elements.
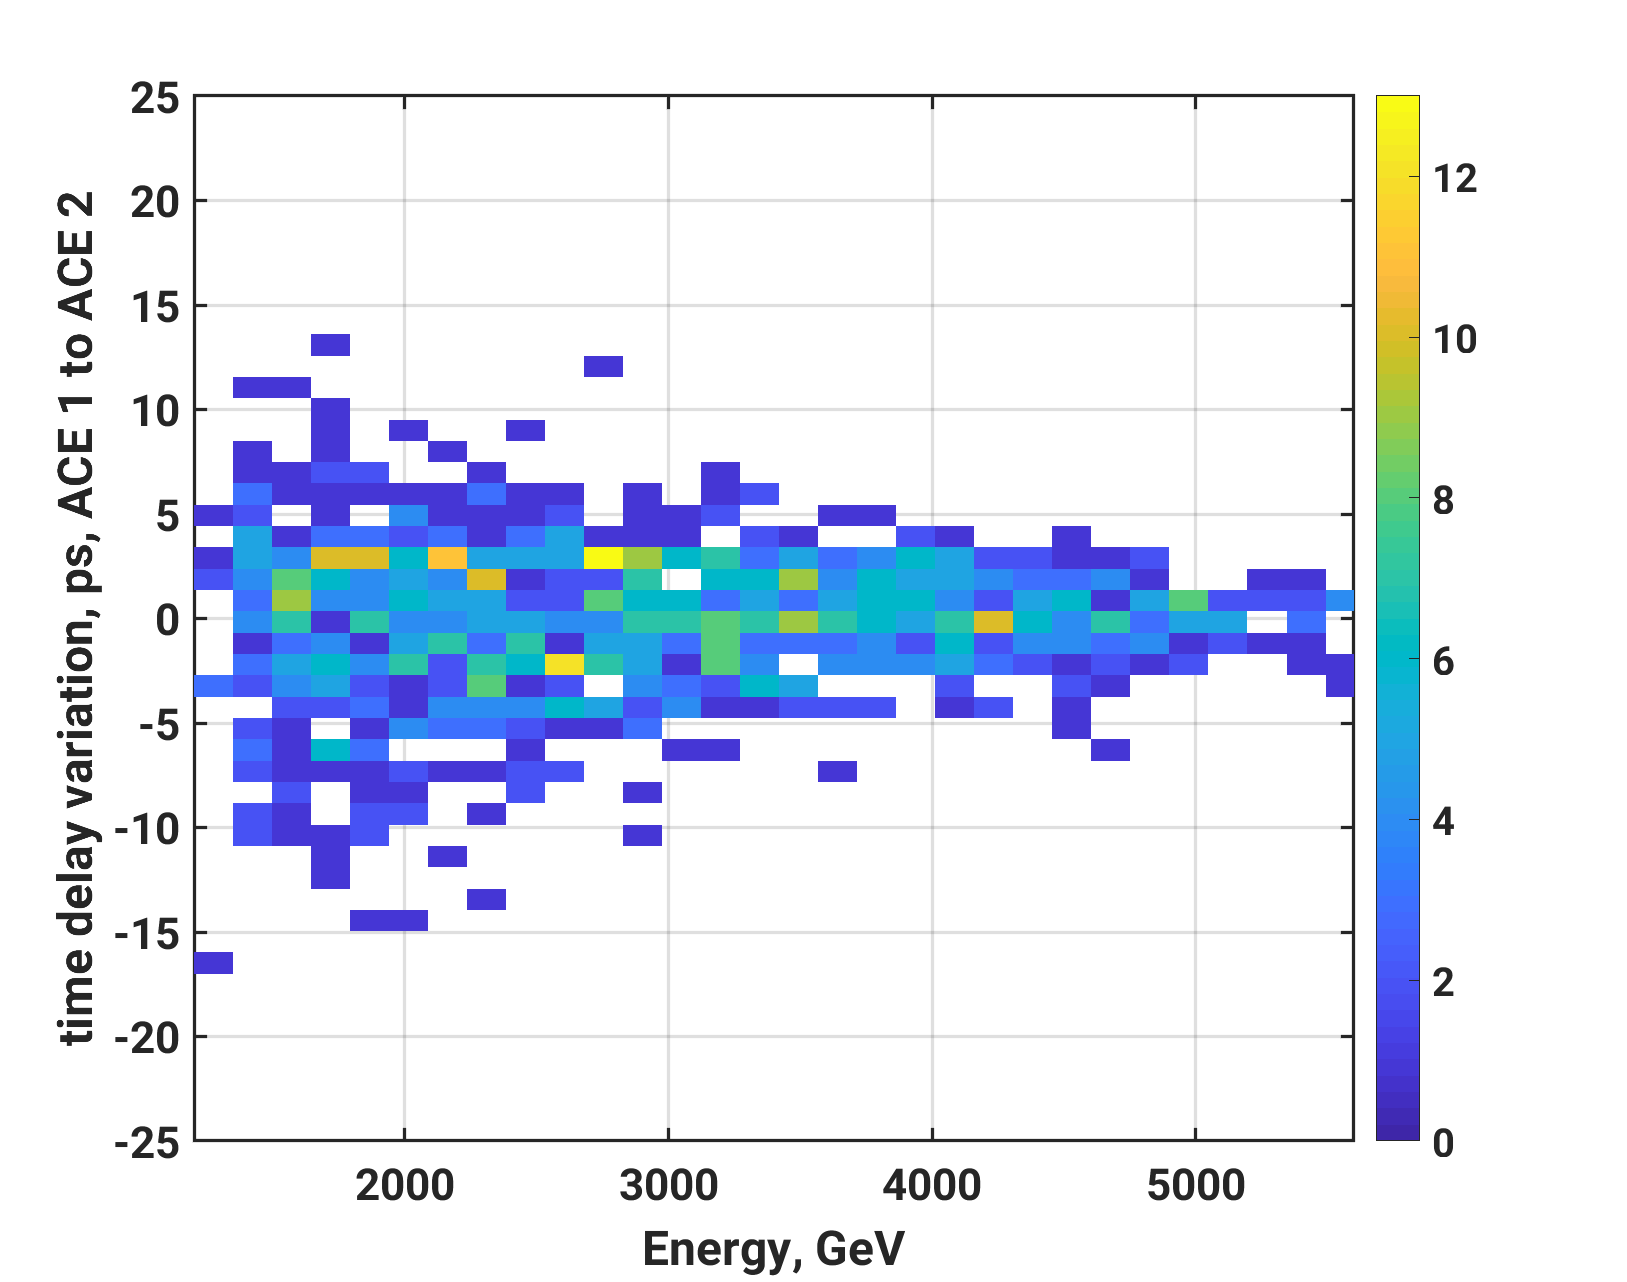
Fig. 15 illustrates the measured time resolution as a function of energy. These data were taken during a run that was constrained in time and thus the statistics are not high, but the clear trend toward tighter time resolution with higher shower energy is evident, following an dependence in a manner similar to the energy resolution.
If we again project these results down to lower energies based on coherent combination of four detectors, then at liquid nitrogen temperatures, a least-count energy of GeV, and a reference clock with sub-picosecond precision, it is straightforward to scale our current results to a timing precision of
| (6) |
At this level of precision, it is evident that the requirement for precise timing transfer of clock signals to the digital data acquisition system becomes acute. In addition, high-precision samplers with accuracy and resolution comparable to high-end realtime oscilloscopes are also a necessity.
V Discussion
The value of this technology will for many applications depend strongly on the limiting least-count energy threshold at which a shower, produced as part of a particle jet from a collision, is detected. Thus the scaling laws that determine this are important to delineate. We discuss several of the important factors here.
V.1 System noise temperature
It is convenient to work with the field strength of the signal and the resulting induced detector voltage, since in this form the coherent signal strength scales linearly with the shower energy. The root-mean-square (RMS) detected voltage from a thermal noise source is then given by
where is Boltzmann’s constant, the impedance of the receiver, and is the frequency bandwidth. The receiver impedance is typically . The system noise is dominated by the low-noise amplifier, but may also contain some contribution due to the loss-tangent of the dielectric, or resistive losses in the waveguide walls. For alumina and a high-conductivity-coated and polished waveguide surface, the latter contributions are usually negligible.
Since the signal for a coherent source is linearly proportional to beam current and thus shower energy for the Askaryan effect, the net effect is that energy threshold improves as . Although also plays a role here, it is usually constrained by impedance matching requirements in the system and is thus not a free parameter. Bandwidth is also constrained in a waveguide, with the upper limit governed by the lowest-order mode requirement, and the low end limited by the waveguide cutoff. Thus for these practical reasons, lowering the system temperature is a straightforward way to improve the energy threshold.
In our case, cooling to liquid helium temperatures ( K), LNAs with noise temperatures of order 1-2 K are commercially available. If the waveguide and dielectric were also maintained close to liquid helium temperatures, K is possible, and a four-element ACE cluster could achieve a least-count shower energy in our system of order 100 GeV. In addition, the linear dynamic range of these detector elements is limited only by the dynamic range of the amplifier chain.
In typical applications, once the signal has been amplified by dB in a first, low-noise stage, there is no penalty for splitting the signal to go to several different gain stages. The base level thermal noise for K in a 3 GHz band is -91 dBm. For a +30-40 dB LNA which compresses at 0 dBm, the dynamic range is already 50-60 dB, a factor of over 300-1000 in shower energy (since the Askaryan field strength scales directly with it). At 100 GeV least-count shower energy, the linear dynamic range will approach 100 TeV in shower energy.
V.2 Track length in detector
In Tamm’s theory, the track length plays a complex role in the resulting intensity of the emission, appearing both as a scale factor on the overall power, and as a factor in the resulting angular distribution of the radiation via the -like term. In our case the requirement for coupling to the waveguide dominant mode places constraints on the range of track lengths that are possible. For a beam entering perpendicular to the waveguide, the track length is fixed at the short dimension of the waveguide, 6.3 mm in our case. If the waveguide boundary were absent, the emission would form a cone peaking with polar angle from the track. Only a fraction of the solid angle is directed along the waveguide longitudinal direction. This is reflected in a coupling factor for radiation into the waveguide.
One way that the track length could be increased would be to direct the particle tracks into a more aligned configuration with the longitudinal axis of the waveguide. An analogous method is used in forward high-rapidity calorimeters which use optical fibers nearly aligned with the beam axis, in the so-called spaghetti calorimeter configuration. For optical Cherenkov emission, this geometry trades a long track length in the fiber for a relatively low efficiency for light coupling to the fiber. A similar approach may in fact yield lower least count energies for an ACE as well, but we were unable to test these kind of geometries in the current experiment.
Another way to increase track length in the waveguide element is to move to lower frequencies and thus larger waveguide cross sections. For example, Alumina-loaded WR-112 would more than double the track length compared to WR-51; however, the usable bandwidth would be halved, and the net improvement in least-count energy would be at best , but with potentially a loss in timing resolution. In fact if the shower microwave coherence obtains up to 8 GHz, there might be no improvement in the threshold for WR-112 compared to WR-51, because the microwave Cherenkov signal grows with frequency, only flattening out once the shower Moliere radius approaches the wavelength of the microwave signal. Our studies here did not explore this parameter space; optimization will depend on exactly which measurements are of most interest for a specific investigation.
A more direct way to increase length by a factor of two for a given rectangular waveguide is to use waveguide with a square, rather than standard rectangular, cross section. Square waveguide support two degenerate but orthogonal lowest order modes, the and modes. The degeneracy means that both modes can and will be present in the same frequency range, but because of orthogonality, they are not necessarily excited together, especially if the current element that excites the waveguide is aligned with one of the modes and not the other, as is the case for a shower propagating perpendicular to one of the waveguide faces. Square waveguide also supports lower intrinsic ohmic losses. In effect, the two degenerate modes can be thought of as two crossed linear polarizations in the waveguide. It is possible to then couple them out independently as such. We have explored this option only in preliminary fashion for this study, but it appears a promising approach, which leads directly to a factor of two reduction in the least-count energy, placing the least count energy well below 100 GeV for aggressively cooled detectors.
V.3 Magnetic field effects
In our measurements, no magnetic field was applied to the system. In a collider detector, magnetic fields up to several Tesla or more may be present in the system, to provide charge separation in tracking instruments. It is thus important to consider the effects of such ambient fields on an ACE.
While the presence of a strong field will have no effect on the alumina or copper, both of which have negligible permeability, the field could have negative effects on a low-noise amplifier. Such effects have been measured Daw97 : in the case where a 3.6T field was oriented perpendicular to the plane of an LNA, an increase of noise figure was observed from 5.5K to 9K at liquid helium temperatures. Fortunately, such effects can be mitigated by orienting the plane of the amplifier with the field, and in this case the effects were observed to vanish Daw97 . Such an orientation would in any case be natural for the field configuration used in typical collider detectors.
Magnetic effects on the shower development are more complex to consider. In our experiment with 4RL of tungsten pre-shower, and assuming a 50 GeV primary, the mean shower energy of the electrons entering our waveguide would still be above 1 GeV, and even a 10T field would give a gyroradius of more than 30 cm, leading to very little charge separation on the scale of the waveguide. However, in that case, the shower would enter the waveguide only partially developed, well below its maximum, and thus likely to produce a lower amplitude. Shower maximum would occur at roughly 12-14 RL of tungsten, and if this depth of pre-shower was used, the mean electron energy would be of order the critical energy in tungsten, around 8 MeV, with a corresponding gyroradius of cm. Any significant field of a few Tesla or more will lead to significant charge separation as the shower transits the detector. This could lead to increased amplitude, since the full charge, rather than the charge excess, may come in to play in generating the signal, but the effects will also complicate the calibration of the system, and will require detailed study. Optimizing the design of the pre-shower system will thus require careful thought and simulation.
V.4 Applications.
As we have stated above, the most straightforward practical value for an ACE-like instrument is in providing one or more timing planes in larger hybrid detector. ACE elements could occupy discrete layers at several depths in either an electromagnetic or hadronic calorimeter, taking advantage of the existing absorbing layers to sample showers at various depths.
For a timing plane, our results indicate that the best resolution will be obtained if the detectors sample showers near their maximum development. For this case there is no reason to separate the detectors along the shower direction so that they sample different shower depths; for improved resolution they should be arranged back-to-back to provide uncorrelated measurements at close to the same shower depth. A timing layer of four loaded WR51 waveguides would require a thickness of 33 mm for the detectors, with a column density of about 1 radiation length, along with possible several thin-walled stainless-steel layers assuming the timing plane would require its own dewar for cooling. If the timing layer is embedded in a detector which is already cryogenically cooled, then the dewar would not be necessary, and the heat load from the ACE elements is very small, tens of mW per channel or less.
Several layers could then be used to provide better coverage of showers developing deeper in the overall detector system. Our ACE results apply directly to high-energy photon and electron/positron showers, but large subshowers of a hadronic interaction would also be detectable above the energy threshold.
VI Conclusions
We have demonstrated that the coherent microwave Cherenkov radiation produced by the Askaryan effect can provide a methodology for precise measurements of both the energy and arrival time for electromagnetic showers produced by hadronic or electromagnetic interactions of high-energy particles, in a bounded, dielectric-loaded waveguide. We find that the microwave impulses produced by transit of a secondary EM shower through an Alumina-loaded waveguide can be timed to a precision of a few picoseconds or better, once the impulse amplitude exceeds the system thermal noise by a factor of 2-3.
While the several hundred GeV least-count energy of the current experiment is too high to be of immediate relevance to current collider detectors, improvements in detector cooling based on commercially available low-noise amplifiers and liquid helium cryogens, along with more favorable detector geometry, could lead to sub-100 GeV thresholds, with exceedingly high dynamic ranges, up to 100 TeV per shower. The resulting radiation-hard detector elements could provide planar sections in future large composite detector systems, and would provide picosecond timing of a subset of particles in a collision, as well as complementary calorimetric information as well. Such detector planes are potential candidates for technologies in next-generation colliders, as well possible augmentations to heavy-ion detectors even in their current form.
We thank the excellent staff at the SLAC National Accelerator Laboratory for their support of this project. This material is based upon work supported by the Department of Energy under Award Numbers DE-SC0009937, DE-SC0010504, and DE-AC02-76SF0051.
References
- (1) M. L. Mangano, editor, Physics at the FCC-hh, a 100 TeV pp collider, CERN-2017-003-M, ISBN (Print) 978-92-9083-453-3, ISBN (PDF) 978-92-9083-454-0, (2017), DOI: http://dx.doi.org/10.23731/CYRM-2017-003.
- (2) S.V. Chekanov, M. Beydler, A.V. Kotwal, L. Gray, S. Sen, N.V. Tran, S.-S. Yu, J. Zuzelski, Initial performance studies of a general-purpose detector for multi-TeV physics at a 100 TeV pp collider, JINST 12 (2017) P06009.
- (3) S. White, R&D for a Dedicated Fast Timing Layer in the CMS Endcap Upgrade, Acta Physica Polonica B vol. 7, no. 4, 735, (2014).
- (4) M.G. Albrow, Fast Timing Detectors for Leading Protons at the LHC: QUARTIC, Acta Physica Polonica B vol. 7, no. 4, 719, (2014).
- (5) A. Apresyan, Precision timing at CMS for HL-LHC, Proc. of the 12th Trento workshop on advanced silicon radiation detectors (TREDI) 2017 (in press).
- (6) N. Cartiglia, et al., Beam test results of a 16 ps timing system based on ultra-fast silicon detectors, NIM A850, 1 April 2017, pages 83-88.
- (7) Askaryan GA, Excess negative charge of an electron-photon shower and its coherent radio emission, SOVIET PHYSICS JETP-USSR 14 (2): 441-443 1962; Askaryan GA, Coherent radio emission from cosmic showers in air and in dense media, SOVIET PHYSICS JETP-USSR 21 (3): 658, 1965.
- (8) Because our experiment centers around the investigation of a detector element, the ”E” in our acronym will be used interchangeably for experiment or element where appropriate.
- (9) J. Allison , M. Gayer , et. al. , Nuclear Instruments and Methods in Physics Research A 835 (2016) 186-225.
- (10) REMCOM XFDTD, XF7 release, www.remcom.com, 315 South Allen Street, Suite 416 State College, PA 16801.
- (11) David Saltzberg, Peter Gorham, Dieter Walz, Clive Field, Richard Iverson, Allen Odian, George Resch, Paul Schoessow, and Dawn Williams, Observation of the Askaryan Effect: Coherent Microwave Cherenkov Emission from Charge Asymmetry in High-Energy Particle Cascades, Phys. Rev. Lett. 86, 2802 (2001).
- (12) T. H. Hankins R. D. Ekers J. D. O’Sullivan, A search for lunar radio Cherenkov emission from high-energy neutrinos, Monthly Notices of the Royal Astronomical Society, Volume 283, Issue 3,(1996), 1027.
- (13) P. W. Gorham, C. L. Hebert, K. M. Liewer, C. J. Naudet, D. Saltzberg, and D. Williams, Experimental Limit on the Cosmic Diffuse Ultrahigh Energy Neutrino Flux, Phys. Rev. Lett. 93, 041101, (2004).
- (14) I. Kravchenko, G.M. Frichter, T. Miller, L. Piccirillo, D. Seckel, G.M. Spiczak, J. Adams, S. Seunarine, C. Allen, A. Bean , D. Besson, D.J. Box, R. Buniy, J. Drees, D. McKay, J. Meyers, L. Perry, J. Ralston, S. Razzaque, and D.W. Schmitz, Limits on the ultra-high energy electron neutrino flux from the RICE experiment, Astroparticle Physics vol. 20, no. 2, 195, (2003).
- (15) P. W. Gorham et al. (ANITA Collaboration), New Limits on the Ultrahigh Energy Cosmic Neutrino Flux from the ANITA Experiment, Phys. Rev. Lett. 103, 051103, (2009).
- (16) Takahashi T., Shibata Y., Ishi K., Ikezawa M., Oyamada M., Kondo Y., Observation of coherent cerenkov radiation from a solid dielectric with short bunches of electrons, Phys Rev E. 62(B), 8606 (2000).
- (17) Ishi K, Shibata Y, Takahashi T, Hasebe S, Ikezawa M, Takami K, Matsuyama T, Kobayashi K, Fujita Y, Observation of coherent Smith-Purcell radiation from short-bunched electrons, Phys Rev E Stat Phys Plasmas Fluids Relat Interdiscip Topics. 1995 Jun;51(6):R5212-R5215;
- (18) Peter W. Gorham, David P. Saltzberg, Paul Schoessow, Wei Gai, John G. Power, Richard Konecny, and M. E. Conde, Radio-frequency measurements of coherent transition and Cherenkov radiation: Implications for high-energy neutrino detection, Phys. Rev. E 62, 8590, (2000).
- (19) I.E. Tamm, J. Phys. Moscow I, 439, (1939).
- (20) L. W. Hobbs, F. W. Clinard, Jr, S. J. Zinkle, and R. C. Ewing, Radiation effects in ceramics, Journal of Nuclear Materials 216, (1994), 291-321.
- (21) J. Molla, A. Ibarra, and E.R. Hodgson, In-beam dielectric properties of alumina, Journal of Nuclear Materials, Volume 219, 2 March 1995, Pages 182-189.
- (22) John M. Warman et al Electronic processes in semiconductor materials studied by nanosecond time-resolved microwave conductivity. Al2O3, MgO and TiO2 powders International Journal of Radiation Applications and Instrumentation. Part C. Radiation Physics and Chemistry Volume 37, Issue 3, 1991, Pages 433-442
- (23) E. Daw, and R. F. Bradley, Effect of high magnetic fields on the noise temperature of a heterostructure field-effect transistor low-noise amplifier, J. Appl. Phys. vol. 82, no. 4, 1925, (1997).
- (24) J. Zmuidzinas, Thermal noise and correlation in photon detection, Appl. Optics vol. 42, no. 25, 4989 (2003).