Simulations of submonolayer Xe on Pt:
the case for a chaotic low temperature phase
Abstract
Molecular Dynamics simulations are reported for the structural and thermodynamic properties of submonolayer xenon adsorbed on the surface of platinum for temperatures up to the (apparently incipient) triple point and beyond. While the motion of the atoms in the surface plane is treated with a standard two-dimensional molecular dynamics simulation, the model takes into consideration the thermal excitation of quantum states associated with surface-normal dynamics in an attempt to describe the apparent smoothing of the corrugation with increasing temperature. We examine the importance of this thermal smoothing to the relative stability of several observed and proposed low-temperature structures. Structure factor calculations are compared to experimental results in an attempt to determine the low temperature structure of this system. These calculations provide strong evidence that, at very low temperatures, the domain wall structure of a xenon monolayer adsorbed on a Pt substrate possesses a chaotic-like nature, exhibiting long-lived meta-stable states with pinned domain walls, these walls having narrow widths and irregular shapes. This result is contrary to the standard wisdom regarding this system, namely that the very low temperature phase of this system is a striped incommensurate phase. We present the case for further experimental investigation of this and similar systems as possible examples of chaotic low temperature phases in two dimensions.
pacs:
68.43.-h, 68.35.Md, 68.35.Rh, 64.70.RhI Introduction
The physical adsorption of gas atoms (adatoms) on solid crystalline substrates produces an interesting collection of phase transitions in a nearly two-dimensional (2D) environment.Bruch et al. (1997) These include a rich variety of structural phase transitions driven by mismatches between the natural periodicities of the adsorbed layer and the crystalline substrate.Bruch et al. (2007); Corboz et al. (2008) These effects are not restricted to the lowest layer, but can be found even in upper layers as they are subjected to the periodic field generated by the lower ones.Corboz et al. (2008); Ahn et al. (2016); Morishita (2017)
Of the various possible combinations of adsorbates and adsorbents, the adsorption of noble gas atoms on well-ordered crystalline surfaces provides an especially attractive and useful set of examples for both theorists and experimentalists interested in fundamental questions.Madeira and Vitiello (2017) There are a number of reasons to consider these excellent examples of model systems. First, the interactions between the various noble gas atoms in vacuum are simple and well understoodAziz (2011) with the modifications to these interactions due to the adsorption of the atoms on certain surfaces being reasonably well modeled.Bruch (1983) Second, there is a well-developed approach to the interaction of these atoms with the crystalline surfacesSteele (1974) with the values of the interaction parameters (for many specific systems) being reasonably well determined.Vidali et al. (1991) Therefore, there is the opportunity to make quantitative comparisons between theory and experiment with some confidence, more than may be justified for many other adsorbate-adsorbent combinations (where the modeling is not on as firm a foundation and the systems are not as well characterized).Jardine et al. (2004); Hayes and Manson (2012); Farias and Rieder (1998)
The adsorption of a xenon adatom on the surface of platinum (Xe/Pt) is one of the more interesting cases of physical adsorption.Gellman et al. (2016); Chen et al. (2012); Diehl et al. (2004) Unlike many of the cases involving the physical adsorption of noble gas atoms on crystalline substrates, the sites for adsorption are directly “over” the Pt surface atoms and not at the hollow positions,Diehl et al. (2004); Seyller et al. (1999) the latter being the expected situation for dielectric surfaces and confirmed for Xe on the basal plane surface of graphite (Xe/Gr). Perhaps related to this, the corrugation along the surface plane is much larger than it is for many other cases of the adsorption of noble gases.Barker and Rettner (1992); *BarRet94 This strong bonding of the xenon adatom to the platinum surface is associated with a significant redistribution of the electron density in both the adatom and the platinum surface atoms, which gives this system some characteristics of chemisorption.Betancourt and Bird (2000)
The strong corrugation and dilated lattice of Xe/Pt suggests an interesting question: Is there anything unusual about the structure of this system at very low temperatures? In chemisorbed systems, there exist examples exhibiting chaotic structures at very low temperatures.Liang et al. (1990) Paradoxically, at higher temperatures, such systems relax to form a more regular, ordered structure. Similar behavior has been seen in some magnetic systemsJensen and Bak (1983) and in systems with charge-density waves.Bak (1982) In all these cases, the resulting chaotic structure can be attributed to pinned domain walls which lock down the structure with a certain degree of randomness in the placement of these walls.Bak (1982) In adsorbed systems, this chaotic behavior relies on the forces of the substrate lattice acting on the domain walls (the Peierls pinning force)Hobart (1965a); Bak (1982); Hobart (1965b); Ziman (1972); Joos (1990); Boutchko and Bruch (2004); Jensen and Bak (1983) being comparable to or stronger than the interactions between these domain walls.Bak (1982) This same physics appears to be important to a related problem, the development of friction in monolayer patches sliding across periodic substrates.Varini et al. (2015); Mandelli et al. (2017); Guerra et al. (2017)
Here we investigate whether similar chaotic behavior at low-temperatures can be present in the physical adsorption case of Xe/Pt. In order to do so, we perform molecular dynamics simulations using a hybrid approach, combining a classical treatment of the dynamics along the surface with a quantum treatment of the dynamics perpendicular to that surface. We refer to this as a quasi-two-dimensional (Q2D) treatment, justifying this treatment based upon the very different nature of the variation in the surface interaction along the surface compared to the variation perpendicular to that surface. Our model is constructed using a combination of the Barker-Rettner modelBarker and Rettner (1992); *BarRet94 for Xe/Pt with a Xe-Xe “Hartree-Fock-Dispersion” interaction,Aziz (2011) modified by the McLachlan interaction for Xe/Pt.Mclachlan (1964) The largest case study reported here approaches the size of some experimental systems, but is smaller than the experimental best-case scenario.Kern et al. (1986a); Kern (1994)
We provide evidence of irregular, extremely narrow domain walls for the low temperature Xe/Pt system. These walls tend to zigzag in a rather haphazard (and perhaps “chaotic”) fashion and do not appear to relax as the run is extended in time, nor when the temperature is raised. This behavior is consistent with these domain walls being pinned, at low temperature, by the Peierls force, and is in agreement with early preliminary calculations.Not (a) We will label such structures as chaotic, although we can not show they fit any strict definition of such a state. We will use the phrase “disordered state” to refer to the phase above the melting transition.Novaco et al. (2015)
We also report other structural and thermodynamic analyzes for constrained (the xenon monolayer uniformly fills the entire simulation cell) and unconstrained (a xenon patch in center of the simulation cell) system geometries. This includes calculations of substrate corrugation parameters, determination of the ground state phase, and evidence of meta-stability for the low temperature phases. The effects of size dependence are made explicit by the calculation of both (the hexatic order parameter)Novaco and Bruch (2014) and (the Net-Domain-Phase order parameter)Novaco et al. (2015) as functions of the temperature and size of the system. The effects of the rotation of the monolayer with respect to the substrate are also examined. Some of these results are to be found in the supplementary material.
Our calculations of the static structure factor allow for comparisons between our simulations and known experimental results. There is a claim, based upon HAS experiments,Kern et al. (1988) that the very low temperature phase of Xe/Pt is an striped incommensurate phase. This has become the conventional wisdom for this system.Bruch et al. (2007); Comsa et al. (1992) The principle experimental evidence for this striped phase involves an analysis of the static structure factor, comparing the hexagonal domain wall structure to that of the striped phase.Kern et al. (1986a, b, 1987); Kern (1987) However, it does appear that this analysis did not consider the possibility of a chaotic (i.e. disorganized) domain structure that is made evident in our simulations, and as such, makes no prediction about the existence of such a state.
We show that chaotic-like structures can exist as meta-stable (long-lived) states in Xe/Pt. Furthermore, the resulting structures can mimic the experimental results used as evidence for the striped phase. In addition, some aspects of the experimental results seem at odds with the structure factor for the meta-stable striped phase reported here. Some results of our simulations have been reported in Ref. [Novaco et al., 2015]; this article being both a follow-up to and a completion of that work.
II Model for Xe Adsorbed on Pt
Much of the behavior seen in the simulations of this system is driven by the strong corrugation and the dilated lattice of Xe/Pt. The minimum barrier to translation from one adsorption site to the next is roughly K, whereas the minimum in the effective interaction between xenon atoms is about K.Bruch and Novaco (2000) In contrast, the minimum barrier to translation for Xe/Gr is about K, while the Xe-Xe interaction is nearly unchanged.Bruch and Novaco (2008); Novaco and Bruch (2014) In addition, the Xe-Xe spacing for the R () phase of Xe/Pt is 4.80 Å, significantly larger than the position of the minimum in the Xe-Xe interaction (4.37 Å). It would seem that this particular combination of a large corrugation and a dilated lattice is what leads to a replacement of a normal triple-point transition with an order-disorder transition (an incipient triple-point).Novaco et al. (2015) We did not explore the boundaries of the parameter space that would generate this behavior.
The literature for classical simulations of the Xe/Pt monolayer, both Molecular Dynamics (MD) and Monte Carlo (MC), is quite sparse. There are some early MD simulations of small systems,Black and Bopp (1987, 1986); Black and Janzen (1989a, b); Brunet et al. (2002) but no MC work to speak of. There is an extensive body of work (by Bruch and Gottlieb) on the stability of various possible structures that might exist in this sort of system (using a harmonic lattice dynamics approach). In particular, there is a direct application of their ideas to the Xe/Pt system,Gottlieb (1990); Gottlieb and Bruch (1991a, b) Unfortunately, some of these early calculations used older (and less realistic) forms for the Xe-Xe interactions and-or simplistic models for the Xe-Pt interactions. However, the stability of the various possible structures for this system has been shown to be sensitive to relatively small changes in these interactions.Novaco et al. (2015); Gottlieb (1990); Brunet et al. (2002)
A model that has been successful in describing the interaction of a xenon atom with the platinum surface is that of Barker and Rettner (BR),Barker and Rettner (1992); *BarRet94 a semi-empirical model that fits a significant collection of experimental data. Only a few of the early calculations for Xe/Pt used the BR model for this interaction, and more importantly, these calculations did not directly examine the effects of thermal excitation perpendicular to the surface on the effective corrugation of the system. This motion has an important effect on the thermal smoothing of the corrugation and thus on the thermal properties of the monolayer.Novaco et al. (2015) Furthermore, when the dynamics of this (and other) adsorbed systems in the surface-normal direction has been treated, it has typically been done by using a purely classical treatment of that motion.Flenner and Etters (2002, 2006); Brunet et al. (2002); Ustinov and Do (2014); Ustinov (2014)
The problem with a purely classical approach to the surface-normal dynamics is that even when the surface-parallel motion is well treated by classical dynamics, the same can not be said of the surface-normal dynamics. This is due to the narrowness of the potential energy well in the surface-normal direction and the corresponding large excitation energies of the adatom. The corresponding thermal motion has an important influence on the effective corrugation and thus on the predictions of stable structures and phase transitions in this system.Boutchko and Bruch (2004); Brunet et al. (2002); Novaco et al. (2015) In the following, we describe how our model is constructed to overcome these issues.
II.1 Q2D approach
The adatom coordinates along the surface plane are (denoted by ), while the coordinate in the surface-normal direction is . We start with a quantum description of the system, approximating the exact wave function by a set of product wave functions having the form:Novaco (1992)
| (1) |
More to the point, we consider the Hilbert space of all such functions, assuming appropriate orthogonality and completeness conditions for the set. It must be noted that, in the end, we will approximate the dynamics of the surface parallel terms using a classical MD simulation, but will retain a quantum description of the surface-normal dynamics as noted in the previous paragraph.
Following Ref. [Novaco, 1992], it is convenient to consider three subsets of contributions to the total energy of the system. These three energy contributions are denoted by , , and (each on a per adatom basis). The first contribution, , is the kinetic energy associated with the -direction plus the laterally averaged substrate interaction . This term depends only on the factor, and it is the thermal behavior of this factor that is primarily responsible for the temperature dependence of the substrate corrugation. The second contribution, , is the remaining kinetic energy terms plus the interaction between the xenon adatoms. Strictly speaking, this interaction term depends upon both the and variation of the wave function. However, it is a very good approximation to treat this as dependent only on the factor because of the narrowness of the functions.Novaco (1992) The third and final term consists of the remaining contributions to the Xe/Pt interaction, that is the non-zero (platinum reciprocal lattice vectors) terms in a Fourier expansion of the BR interaction, projected onto the plane as described below and in the supplementary material. This term, which determines the effective corrugation, depends on both the and the factors in . In this work, as in Ref. [Novaco, 1992], is written as a product of single-particle Gaussians, effectively treating the monolayer vibrational mode polarized in the surface-normal direction as a flat mode with no variation in frequency across the two-dimensional Brillouin zone.Bruch and Novaco (2000); Novaco (1992) This has been shown to be a good approximation.Bruch and Novaco (2000)
This Q2D approach involves an explicit assumption that the adatom finds the optimum -position as it moves along the surface. This means that there is an implicit assumption being made about the coupling of the motion in to that in . Given this, there are a number of avenues to the projection of the 3D potential energy of the BR model into the plane of , some purely classical in approach and some quantum in nature. The quantum projections build upon the classical projections by averaging various expressions of the classical projections over the zero-point (and thermal) motion of the adatom in the -direction. That is, a quantum projection corresponding to any particular classical one replaces the potential energies (and their derivatives with respect to the -displacement) with the appropriate quantum thermal averaging using the Self-Consistent Phonon (SCP) Gaussian distributions as specified in Refs. [Novaco, 1988, 1992]. This Q2D approach results in a modified form of the 3D Steele expansion of the potential energy of an atom due to the surface of a crystalline substrate,Steele (1973, 1974) using quantum thermal averaging to project the 3D potential energy into the plane of . This effective potential energy, denoted by , can be written as a Fourier series in the form:
| (2) |
where is a reciprocal lattice vector of the two-dimensional surface lattice and the effective, Q2D Fourier coefficients depend upon temperature as a result of the quantum thermal averaging of the xenon dynamics in the surface-normal direction. (See Appendix A for the reciprocal lattice naming and indexing conventions used).
Our Q2D approach uses the quantum states that describe the factor to calculate the Q2D Fourier coefficients that describe the variation of the substrate corrugation as a function of . The details of how this is done is described in the supplementary material, which describes two quantum-based methods and three classical approximations.
There is an important caveat in this approach, and it is associated with the mixing of a classical treatment of the -motion with a quantum treatment of the -motion. It is obvious how to deal with both the and the terms since the first depends only on (quantum treatment) and the second only on (classical treatment). However, the term depends upon both, so there is some ambiguity about how to properly treat this term because the effective Fourier coefficients defined by this term can reasonably be averaged over both the and the motions.Novaco (1992) The decision was to match the MD and SCP energies (at zero temperature) as closely as possible by following the procedure in Ref. [Novaco, 1992], even though this might overstate the effects of quantum and thermal smoothing at finite temperatures. On the other hand, this approach does come close to aligning the adatom-substrate classical potential energy with the corresponding SCP potential energy, even at finite temperatures. This approach can be interpreted as an approximate wave packet calculation, the approximations involving the replacement of the quantum thermal average of the Fourier term with a cumulant expansion as is done in Ref. [Novaco, 1979], and the use of constants for the second cumulants of the Gaussian distributions, these cumulants being calculated separately by a SCP treatment of the phase.Bruch and Novaco (2000) Additional details are to be found in the supplementary material.
II.2 Xenon-xenon interaction
The interaction between two isolated xenon atoms is taken to be the HFD-B2 interaction on page 177 of Ref. [Dham et al., 1990], which is a “Hartree-Fock-Dispersion” interaction.Aziz (2011) This interaction does an excellent job of describing the various features of the xenon-xenon pair interaction in vacuum. However, since the Xe atoms are adsorbed on a surface, there is a modification of this pair interaction generated by the dielectric properties of this surface. Thus, the HFD-B2 interaction is modified by adding a McLachlan interactionMclachlan (1964) with the parameters given by Bruch for the Pt surface.Bruch et al. (2000) This model (HFD-B2+McLachlan) has been used successfully in Ref. [Bruch and Novaco, 2000] for a lattice dynamics analysis of this system and in Ref. [Bruch et al., 2000] as part of the analysis of HAS experiments. In addition, as was the case in Ref. [Bruch and Novaco, 2000], the effects of any induced xenon dipole as well as three-body terms are ignored. Details, justification, and values of relevant parameters are given in Ref. [Bruch and Novaco, 2000] as is the justification for ignoring any dipole-dipole interactions. The parameter values in Ref. [Bruch and Novaco, 2000] are based on the work in Ref. [Bruch et al., 2000].
II.3 Xenon-platinum interaction
The position of the preferred adsorption site, which is over the surface Pt atom, has an important effect on the stability of the various phases of Xe/Pt.Rejto and Andersen (1993); Barker and Rettner (1992); *BarRet94; Weaver et al. (1997); Gottlieb (1990); Gottlieb and Bruch (1991b); Bruch et al. (2007); Seyller et al. (1998) We choose the BR model to capture this aspect of the Xe/Pt system, as well as other important physical characteristics.Barker and Rettner (1992) Furthermore, it is considered to be one of the more successful interaction models for this system, with much to recommend it.Bruch et al. (1997, 2007) It has been used in a successful treatment of the lattice vibrations for this system,Bruch and Novaco (2000); Bruch et al. (2000, 1998) and the region of the potential well that is most important to lattice dynamics calculations has a similar importance here. The details of the implementation of this interaction model, including the parameters used for these calculations, are identical to those used in the lattice dynamics calculations of Ref. [Bruch and Novaco, 2000].
II.4 Molecular dynamics simulations
The simulations presented here are standard molecular dynamics simulations in 2D (fixed particle number, area, and total energy) with the substrate potential energy given by Eq. (2). The simulations are carried out using scaled equations with a length scale of 4.3656 Å, an energy scale of 282.8 K, and a time scale of 3.262 ps. The technical details of these simulations are found in the supplementary material. We have carried out a series of simulations for different sets of these Fourier coefficients, using a range of coefficients which should bracket the most likely values both at low temperatures and at high temperatures. It is our expectation that we have a bracket around the most likely behavior of the system for the range of temperatures of interest. Details and supporting arguments are found in Sec. III.1 and in the supplementary material.
| Case Study | Substrate | Projection | Size | |
|---|---|---|---|---|
| BR:65K111Constrained geometry with 65536 adatoms. | Pt | BR | 65K | |
| BR-H:20K222Unconstrained geometry with 20064 adatoms. | Pt | BR-H | 20K | |
| U25-H:20K222Unconstrained geometry with 20064 adatoms. | Pt | U25-H | 20K |
We refer to the selections of different projections and system sizes as separate case studies, each being tagged using a notation that consists of two strings separated by a colon. The first string specifies the corrugation model for Xe/Pt and the second specifies the size of the system. An example is the case study U25:65K, where the U25 refers to a Fourier expansion with a single independent amplitude ( K) and the 65K refers to the system having particles in the box. A BR for the first string denotes the Barker-Rettner interaction as in cases 1 and 2 of Table 1. Furthermore, if the first string is terminated by a “-H”, as in BR-H, then that infers the case study is for a unconstrained geometry (hexagonal shaped patch). A “-U”, as in BR-U, denotes an initial uniaxial configuration (striped phase) which was either unconstrained (i.e. rectangular patch for the 20K size) or a constrained geometry (i.e. for the 65K size). If there is no such designation, then the simulation is for a constrained geometry with the initial lattice being either hexagonal or centered-rectangular. The number density of the structure, denoted by Å-2, is used to scale the density in various figures and tables.
III Results
The results of our simulations are organized as follows. In Sec. III.1, we report and discuss the calculation of the parameters of the substrate corrugation. In Sec. III.2, we define the different initialization phases that were studied, followed by an analysis of the ground state structure for constrained geometries in Sec. III.2.1 and for unconstrained geometries in Sec. III.2.2. In Sec. III.2.3, we report calculations and analysis of the structure factor of the different case studies, which is the figure of merit for the comparison to experimental results, reported in Sec. IV. Additional explanations, results, comparisons, and discussion is to be found in the supplementary material; such as the details of the calculation of the corrugation that is the basis for the conclusions of Ref. [Novaco et al., 2015].
III.1 Substrate corrugation
| Projection | |||
|---|---|---|---|
| BR111Calculated using the classical perturbation approach. | |||
| UN222N {20, 25, 30, 35}. |
The descriptions and the corresponding Fourier coefficients used for the case studies examined here and in Ref. [Novaco et al., 2015] are given in Tables 1 and 2. The naming and indexing conventions used for the reciprocal lattices are described in Appendix A. The details of these calculations are to be found in the supplementary material. The origin (or zero) of the 2D energy calculation for a given case study is the corresponding value of . These values are given in Table 3 for three temperatures, along with the minimum value of the laterally averaged substrate potential energy and the corresponding values of , the optimum value of .
| Approach | 111Optimized using only the term. | ||
|---|---|---|---|
| Classical | |||
| Quantum222. | |||
| Quantum333. | |||
| Quantum444 K. |
As described in Sec. II.1, the quantum optimization uses SCP averaging, thus minimizing the free energy contribution associated with the -motion.
| Source | |||
|---|---|---|---|
| Theory111This work: for a 2D ideal gas using and K. | |||
| Theory222This work: for a 2D lattice gas of 3D-Osc. with K. | |||
| Kern333Ref. [Kern et al., 1988]: K and coverage . | |||
| Diehl444Ref. [Diehl et al., 2004]: K. |
For comparisons with experiment, we show the binding energy , the isosteric heat , and the optimum -position for the BR model as well as corresponding experimental values. These results are found in Table 4. The relations between and the theoretical are explained in the supplementary material.
The theoretical and experimental values of agree very well, while the corresponding values of differ by about 5 to 15 %. The calculated values of the -wise vibrational amplitude of the xenon motion for the phase at 110 K are in excellent agreement with experiment, theory giving 0.16 ÅBruch and Novaco (2000); Not (b) and experiment giving 0.17 Å.Diehl et al. (2004) In all, the agreement between the BR model results and the experimental results is both respectable and satisfactory.
| Projection | |||
|---|---|---|---|
| Method 1 | |||
| Method 2 | |||
| Method 3 |
A comparison of the results for the calculation of the finite Fourier coefficients, using the classical approach from Sec. II.1 and the supplementary material, is displayed in Table 5. The first method produces a good estimate of , quite compatible with that of the second method. The second method produces values of and that are rather small, but perhaps not completely negligible. The third method has a slightly different set of , but an overall corrugation that is not that different than the other two.
| Projection | |||
|---|---|---|---|
| Method 1111Calculated at 0 K. | |||
| Method 2111Calculated at 0 K. | |||
| Method 1222Calculated at 60 K. | |||
| Method 2222Calculated at 60 K. | |||
| Method 1333Calculated at 110 K. | |||
| Method 2333Calculated at 110 K. |
Comparisons using the corresponding quantum projections are displayed in Table 6. At zero kelvin, there is a small reduction in the magnitude of the classical value of the Fourier coefficient for due to quantum effects. There are corresponding small changes in the (absolute) values of the others. At K, the reduction in is significantly larger but still with small values for the others. Given these results, it would be reasonable to use a range of K to K as the appropriate one for values in the temperature range from zero to a bit over K. However, this assumes that the adatom is able to maintain the optimal distance from the surface, even at the highest temperatures; and also assumes that there are no effects generated by the thermal excitation of the Pt surface itself (see the supplementary material). Without a direct calculation of these effects, we can only guess how important these might be. However, such a calculation would go far beyond the goals of this work. Instead, we have simply used an arbitrary lowering of the corrugation, using a of K as a corrugation lower bound.Novaco et al. (2015) This approaches the smallest corrugation that is reasonable, based upon the results above and an observed phase that is stable in the temperature range from K through over K. Lowering the corrugation too much destabilizes the phase over much of that temperature range. Our lower bound preserves this stability, but it does represent a significant lowering of the corrugation. In a couple of special test cases, a of K was also used, but nothing differed in any interesting way. These calculations and the values found in Tables 5 and 6 were the ones used in Ref. [Novaco et al., 2015].
Finally, calculations were carried out comparing theoretical and experimental root-mean-square (RMS) vibrational amplitudes of the xenon atoms in an attempt to better constrain the corrugation. However, the results were not useful in improving our estimate of this corrugation. These calculations and the corresponding results are described in the supplementary material. Some additional consequences of this smoothing of the corrugation with increasing temperature are to be found in Ref. [Novaco et al., 2015]. As shown in that paper, reductions in the corrugation are important to the understanding of the phase transitions in the Xe/Pt system.
III.2 Molecular dynamics
The implementation of the basic MD simulation is outlined in the supplementary material, and closely follows Refs. [Bruch and Novaco, 2008; Novaco and Bruch, 2014]. Using these simulations along with the free energy analysis as discussed in the supplementary material, we examine the stability, structure, and thermal behavior of the phase, the striped incommensurate (SIC) phase, and the hexagonal incommensurate (HIC) initializations. Both aligned (AIC) and rotated (RIC) HIC structures are examined. In addition, the stability of structures having irregular and apparently pinned domain walls are examined and compared to the others. These “chaotic” structures will be referred to as “chaotic hexagonal” and “chaotic striped”, even though it is not clear if they satisfy the strict definitions of a chaotic state. We examine these structures by initializing the system in these configurations and then following the simulations out to apparent thermal equilibrium. When possible, free energy comparisons are made between the various structures to determine the stable phase (this can not be done for the constrained geometries). Some initializations into these structures produce stable (or meta-stable) disordered (chaotic) domain-wall structures. Comparisons of the details of this work to that of Refs. [Bruch and Novaco, 2008; Novaco and Bruch, 2014] are described in the supplementary material. In addition to the thermodynamic functions calculated in Ref. [Novaco and Bruch, 2014], calculations were carried out for the specific heat at constant area, and the two order parameters: and . The definitions and thermal behavior of these two order parameters are to be found in Refs. [Novaco and Bruch, 2014; Novaco et al., 2015]. Other details of the thermodynamic calculations as well as corresponding results are to be found in that same reference. Further details follow here and in the supplementary material.
III.2.1 Constrained geometry
Our MD simulations indicate that the ground state of the BR model is the state. Furthermore, at finite misfits, the HIC phase is the stable phase. However, for small misfits, the SIC phase will strongly compete with the HIC phase and have nearly the same free energy (see the supplementary material for details). If the low temperature corrugation is smoother than about K (the exact value dependent upon the importance of quantum effects), the IC phase becomes the stable low temperature phase and the ground state of the system. It is not unreasonable to speculate that, depending upon the actual smoothing due to quantum and thermal effects, (and corrections to the BR model) it might be possible for this system to have a ground state with significant competition from a SIC phase, a stable IC phase at higher temperatures (but less than about 60 K), and then a return to a stable phase at roughly that temperature.
If the actual corrugation is well below the values above, but still stronger than about K, the system would evolve from an IC low temperature phase to the phase as the temperature increases. However, the temperature range of stability for the phase is reduced as the corrugation decreases. For corrugations much lower than this K lower limit, the system does not enter the phase before the disordering temperature, but rather remains in the IC phase until melting. Preliminary calculations of quantum corrections do not appear to alter this conclusion in any significant manner (the calculations indicating that the AIC and SIC states have nearly identical free energies at small misfits).Not (b)
III.2.2 Unconstrained geometry
Most simulations for the unconstrained geometry were carried out for a system size of K. The thermodynamic behavior of the unconstrained geometry, in the (average) density range of to times , is not very sensitive to variations in that density (provided the system is an isolated, single patch). Most of the data was taken with an average density of roughly to on this scale, but some simulations at the highest and lowest densities were used so that the sensitivity of the results to changes in the average density could be examined. Nothing of significance was found.
The thermodynamic stability analyses (see supplementary material) of the various meta-stable structures in this system demonstrates that the phase is the stable phase of both the BR-H and U30-H projections at low temperatures, but that the SIC phase has nearly the same energy at low temperatures. Thus, while the phase is the expected low temperature phase of the BR model for Xe/Pt, it will have strong competition from the SIC phase. This may be what drives the system into the observed “chaotic” domain structure that is observed in the simulations. Furthermore, even though simulations using the smaller corrugations in Table 2 show that the stable phase at very low temperature would be an IC phase, the stable phase at higher temperatures, even for these smaller corrugations, is still the phase. Using the corrugation values shown in Table 2, the stable phase at temperatures just below the melting temperature does appear to be the phase. The effects of quantum behavior and the implications for the determination of the stable state will be addressed in a future publication.Not (b) However, preliminary calculations indicate that the basic conclusions of the MD stability analysis shown here are not significantly altered by quantum effects as calculated by a SCP type analysis.Novaco (1992); Not (b) Finally, the transition from ground state to IC ground state occurs at values of between and kelvin, the actual value most likely closer to than kelvin. However, this value is affected by quantum corrections and it needs a more careful examination. This will also be addressed in a future publication.Not (b)
III.2.3 Structure of the monolayer
The complexity of the monolayer structure makes its description somewhat difficult and cumbersome. Nevertheless, there are a number of characteristics of the monolayer that are useful to describe in detail, and this can be done with some confidence. Some of these details are to be found in the supplementary material, others follow.
The structure factor for the phase shows the expected behavior for both constrained and unconstrained geometries. At low temperatures, the widths of the peaks are consistent with the size of the system, and show the expected decrease in peak height and increase in peak width as the temperature is increased and the system becomes more disordered. Total loss of long-range order is obvious at the transition temperature to the disordered state.Novaco et al. (2015)
As for the striped phase, while it is possible to generate many stripes in the constrained geometry, it was not possible to generate more than six to eight stripes using the unconstrained geometry and a system size of 20K. The structure factor peaks for this case, for both constrained and unconstrained geometries, possess strong satellites once there are more than a couple of domain walls in the system. The presentations of the experimental data for in Refs. [Kern et al., 1987; Kern, 1987] do not seem to show the existence of strong satellites as found in these MD simulations. It does appear that the existence of strong satellite peaks is inconsistent with the data since the experimental analysis assumed the main (parent) peaks are the major contributors to the scattering intensity. The lack of strong satellite peaks is an indication that even if the experimental system is a SIC phase, it is not one possessing many stripes. The main peaks for the simulated (MD) striped phase did show shifts from the peak locations, although these shifts might not have a simple relation to the “misfit” and the main satellite peak was similar in intensity to the parent peak. While our comparisons of the MD results with the experimental data is more qualitative then quantitative, these comparisons did take into consideration peak locations, peak shapes, and peak intensities. We believe the conclusion that the experimental diffraction peaks are not consistent with the SIC phase of the BR model are based on sound arguments.
As would be expected, peaks for the apparently chaotic phase show a variety of structures. Many of these are difficult to interpret, but are reflective of the disorder in the system. Some peaks show similarities to the peaks shown in the HAS dataKern et al. (1987) associated with the SIC phase, even though the MD system is not a striped structure.
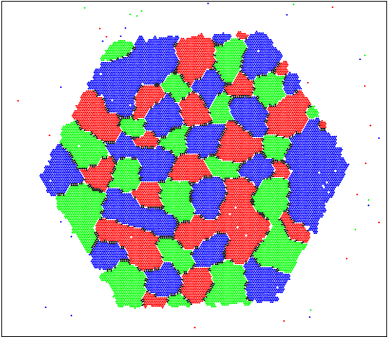
A good example of this is shown in Fig. 1, where the domain structure shown is an example of this chaotic phase. This figure shows the typical pattern of domains and domain walls for these states, where the definition of the three domain sublattices and the domain walls are to be found in Refs. [Bruch and Novaco, 2008; Novaco et al., 2015]. This chaotic structure was generated by initialization in a low temperature patch configuration and then slightly rotating the patch (by about ) before starting the simulation. This system was first cooled and then heated. It is clear that this structure is not a striped phase, but the structure factor, as shown in Fig. 2, shows some similarity to the experimental as shown in Fig. 2 of Ref. [Kern et al., 1987]. However, the peaks in the simulation results are sharper than those found in the experimental results and are also shifted in -space.


.
A contour plot of in the same region of -space is shown in Fig. 3. The largest peak is about two or three times higher than the two smaller peaks, and the peak triplet is roughly centered near the xenon peak of the phase. This can be compared to the that results from a striped phase patch with five domain walls, as seen in Fig. 4. In the experiments, a triplet pattern was explained as an incoherent sum of contributions from three wall orientations rotated from the others, with the peaks being generated from the shifted and unshifted parent peaks whose origins are the peaks equivalent to the xenon peak. Adding together three rotated contributions of the sort found in Fig. 4 would not give a triplet pattern.
IV Comparison to Experiment
Connections with the experimental results were investigated by calculations of the static structure factor Bruch and Novaco (2008); Novaco and Bruch (2014) for a selected subset of runs spaced along an appropriate range of temperatures. These calculations were compared to the experimental results to see if there are other possible interpretations of those experiments. Since the BR projection is the most appropriate one for the very low temperature range, the focus was on that projection using an unconstrained geometry with K atoms in a single patch and having an average density of roughly . Results for the U35-H projection are essentially the same as the BR-H projection. We explored variations in the initialization of the system so as to generate a variety of initial structures. These variations used a series of initial rotations and initial densities (using the unconstrained geometry) to produce initial configurations of the SIC, AIC, and RIC structures. In addition, the response of the system to changes in the corrugation was investigated.
Simulations of the low temperature submonolayer solid show a system with extremely narrow domain walls that tend to zigzag in a rather haphazard and perhaps chaotic fashion.Not (a) The domain walls are often only two or three atoms in width, the width varying along the length of the wall. Some stretches of these walls exhibit wall widths which are effectively zero (that is, domains of different sublattices directly abut each other with a small gap). This is in marked contrast to the walls found in the Xe/Gr system, where the domain walls have a regular structure, are relatively wide, and are essentially of constant width.Bruch and Novaco (2008); Novaco and Bruch (2014) Furthermore, the walls in the Xe/Pt system appear to be more erratic and not as easily categorized as domain wall models typically used in calculations found in the literature.Kern et al. (1987); Specht et al. (1987); Kardar and Berker (1982) In addition, the walls seem to be rather resistant to movement (as evidenced by their propensity to stay near their original position as the system evolves). This happens both as the running time is increased and as the temperature is raised. Furthermore, this occurs even when a thermodynamic analysis clearly indicates that the state in question is not the one with the most thermodynamically stable structure. That is, these domain walls seem to stabilize meta-stable states, behaving as if they are pinned at low temperatures. As the temperature is raised above 60 K, these walls then appear to relax, causing the system to form a proper structure with a couple of large domains (although often surrounded by some disorder as the temperature approaches the transition temperature).
The prediction of the BR model for the structure of the low temperature submonolayer is in stark contrast to both the HAS results and the STM results.Kern (1987); Kern et al. (1987); Diehl et al. (2004); Brunet et al. (2002) The existence of large patches of irregular but roughly hexagonal domains separated by very narrow and irregular domain walls not only generates strong, single peaks at those scattering vectors that are coincident with the reciprocal lattice vectors of the substrate, but produces the triplet pattern shown in Fig. 2 for those not near such . However, the scattering pattern for the BR model, even with thermal smoothing, does look different from that shown in the experimental work of Kern.Kern et al. (1987) Furthermore, these differences exist for both the “chaotic hexagonal” phase and the “chaotic striped” phase.
If one compares the for the “chaotic hexagonal” phase of the BR model to the experimental results, it is possible to see that the peaks in the vicinity of those vectors that are near corresponding reciprocal lattice vectors of the surface (for example, ) are actually not that different from the experimental results. The calculations show a strong, single peak at the location of the appropriate vector (that is at the corresponding phase vector). The Kern data shows a strong peak with (what is described as) a very weak and indistinct doublet. Here, the data is really not that different from the MD simulation. However, for the scattering peaks near the phase vector, the BR model shows a triplet centered about that location while the Kern data shows a triplet displaced significantly outward from this location. Furthermore, the peaks in the BR calculation are more distinct, possessing significantly smaller widths, then those found in the experimental results.Kern (1987); Kern et al. (1987); Diehl et al. (2004); Brunet et al. (2002)
Now, if one would instead examine the “chaotic striped” phase, looking at both the BR model and the Kern data, comparing for the “chaotic striped” phase to the experimental results, what is true of the “chaotic hexagonal” phase with regard to scattering near the vectors is also true for the “chaotic striped” phase. Namely, the only significant intensity is at the corresponding parent peak. However, for scattering near other peaks (like ) the BR “chaotic striped” phase would show the pattern in Fig. 4 added (incoherently) with two others rotated by . This appears to be inconsistent with the Kern experimental results since, given the strong satellites shown in Fig. 4, the calculated peaks would not form a simple triplet pattern.

Since the predictions of the BR model, even with appropriate thermal smoothing, appear to be at odds with the experimental results, questions about just how the BR model could be deficient are relevant. In Ref. [Novaco et al., 2015], a similar problem arose when comparing the experimental melting temperature and the prediction for the BR model. This same problem arose in the determination of the mobility of a xenon atom on the Pt surface by quasi-elastic helium atom scattering.Ellis et al. (1999) It does appear that there is a need for further smoothing of the corrugation beyond the thermal smoothing presented here. It can be suggested that this additional smoothing might be due to thermal motion of the Pt surface (see the supplementary material). But there also exists the possibility that the model corrugation is simply too strong and (or) the well width in the surface-normal direction is too narrow. Perhaps even at the very lowest temperatures, the basic BR model parameters need tweaking. With this in mind, we can examine the effects of lowering the corrugation along the same lines as done in Ref. [Novaco et al., 2015].
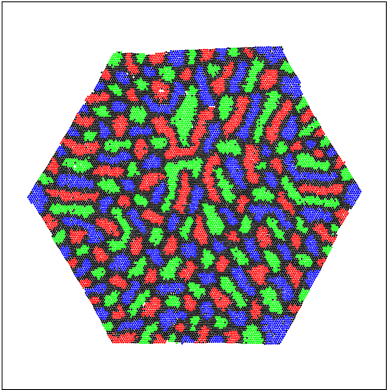
For temperatures around 60 K, the BR value for is reduced (in magnitude) by thermal (and quantum) smoothing to about 28 or 29 K as can be seen in Table 6. This reduction is not sufficient to alter the scattering pattern in any significant way. However, if the value of were in the range from about to K, there is a significant shift in the position of the triplet surrounding the peak. In particular, while there is still a triplet form to the pattern, the center of that pattern moves “outward” and beyond the phase position. The spacial domain pattern is similar to that shown in Fig. 1, but the domains are smaller and rather more irregular as can be seen directly in Fig. 5 (which is for the K corrugation).
The for this state (at K) is shown in Fig. 6. The peaks in are lower and less distinct then in the BR case discussed above. Furthermore, the triplet is moved outward in space, shifted relative to the xenon peak instead of being centered on that peak location, as it is in the BR case. In fact, these peaks are quite similar to those in experimental data.Kern et al. (1987) It must be noted that there are many cases where the scattering pattern is different from those shown here, often being more disorganized and without sharp peaks as would be expected for a system with significant disorder. In particular, the state of the system appears to be sensitive to the history of state formation. This would be expected if the system is chaotic in nature, but the existence of this sensitivity in a MD simulation is not proof that the system is truly chaotic.
While structure factor calculations were not carried out for the “chaotic striped” phase with K, an analysis using a different techniqueNovaco (1979, 1980); Novaco and Bruch (2014) suggests that for such states would still produce noticeable satellites. This would likely conflict with the patterns observed in the Kern experiments as discussed above. It should be noted that reducing the corrugation so that K does not eliminate the meta-stability and “chaotic” behavior. However, doing so both increases the domain wall width and decreases the temperature range of stability for the phase.
V Summary and conclusions
Our molecular dynamics simulations of submonolayer Xe on Pt, using the Barker-Rettner model combined with the HFD-B2 Xe-Xe interaction as modified by the McLachlan interaction, shows that the ground state of this model is the structure. Furthermore, these BR model simulations clearly show that the equilibrium low temperature, low pressure phase is this same phase. However, below approximately K, this phase is susceptible to meta-stable chaotic disorder, creating domains of various irregular shapes and producing structure factors similar in nature to that of the HAS experiments.Kern et al. (1987) The interpretation of the the HAS scattering as confirming the existence of a striped phase as the low temperature structure may be a misinterpretation of the actual situation. Finally, these simulations show that this disorder anneals out as the temperature is raised above the K mark, driving the chaotic system back into the structure. It is from this higher temperature phase that the system melts (disorders).Novaco et al. (2015)
The susceptibility to chaotic behavior is exhibited by a mix of disorganized hexagonal and striped domains in the same sample. The resulting near the xenon and peaks shows a triplet pattern that is similar in structure to that seen in HAS experiments.Kern et al. (1986a); Kern (1987); Kern et al. (1987) On the other hand, for near the xenon peaks, the MD analysis shows essentially no difference between reflections from any of the examined phases (the , the HIC, the SIC , and the chaotic structures). All phases show a strong peak at the platinum reflections, namely just those found in the phase. This is understandable since all these structures have the vast majority of the xenon atoms at or close to adsorption sites with, at most, only a few percent of these atoms in very narrow and irregular placed domain walls. Given that the xenon peak set is coincident with the platinum peak set, all the xenon atoms at adsorption sites reflect in phase with each other at these values of . These results contradict statements in Ref. [Kern et al., 1987] about the analysis of the scattering from the xenon peaks of the SIC structure, at least as it could be interpreted for the submonolayer case. Furthermore, the simulations of the model SIC phase show strong satellites in , which contradicts that same experimental analysis for the and peaks.
There are, however, some problematic issues associated with the BR model, especially at higher temperatures. In particular, comparing simulation results to experimental results, there seems to be more smoothing of the corrugation with increasing temperature than can be accounted for within this model. The effect of this reduced corrugation on the thermodynamic behavior is examined in detail in Ref. [Novaco et al., 2015], but this behavior is also found in quasi-elastic helium atom scattering (QHAS) experiments which can examine the diffusion of a Xe adatom on the Pt(111) surface.Ellis et al. (1999) The quasi-two-dimensional approach we used, combining a classical treatment of the monolayer dynamics parallel to the surface with a quantum treatment of the dynamics perpendicular to the surface, does help mitigate these problems, but it does not fully resolve all the issues. Our investigation of the thermodynamic and structural properties, comparing our calculations to previous simulations and known experimental results of this and other systems, indicate that there is more thermal smoothing near the melting temperature than can be accounted for by current models. This is in stark contrast to other systems, such as Xe/Gr, where the same approach does an excellent job of explaining the experimental results.Novaco and Bruch (2014)
Further experimental studies are important for progress in the understanding of this system. In particular, work that can better examine the very low temperature corrugation of this system and probe the Xe/Pt potential energy surface is needed. For example, a careful experimental study of single-particle diffusion from very low temperatures up through melting, combined with corresponding simulations which include quantum corrections at low temperatures, could go a long way to the determination of the corrugation and its dependence on temperature. Improved ab initio studies of the xenon-platinum potential energy surface would be very useful, although the precision needed may be beyond the limits of current theoretical analysis.Betancourt and Bird (2000) Calculations of the effects of the thermal motion of the Pt surface on the behavior of the xenon monolayer could be critical to the understanding of this problem. It is also important to do an experimental study of the effects of surface dynamics on the surface corrugation as the temperature is raised. It is possible that the dynamics of the platinum surface significantly influences the dynamics of the xenon monolayer at high temperatures by significantly smoothing the surface corrugation. Also important is the study of similar systems, namely heavy noble gases adsorbed on strongly corrugated substrates having dilated adsorbate lattices. One such example could be submonolayer xenon adsorbed on Ru.Narloch and Menzel (1998) Furthermore, the structural analysis of the scattering from these systems must include an examination of possible chaotic states of the sort observed in these simulations.
The BR model does a good job of explaining the low temperature behavior of the xenon monolayer on the Pt surface. However, while it is able to reproduce a significant collection of data, it is clear that getting the transition temperature for melting right and explaining the scattering data, the STM data, and the QHAS data requires alterations in or enhancements to the BR model at high temperatures. While reducing the corrugation does effect the phonon spectrum,Bruch and Novaco (2000) a simple SCP calculation shows that reducing the corrugation from the BR value to K, reduces the in-plane zone-center phonon gap by about 25 % and produces a small increase in the maximum in-plane phonon energy.Not (b) However, these shifts look to be borderline tolerable as to the maintaining of the agreement with the previously calculated phonon energies and the experimental data.Bruch and Novaco (2000); Bruch et al. (2000) For all its successes, and there are many, the BR model seems to need improvements of the sort discussed here.
VI Supplementary Material
See the supplementary material for additional justifications, explanations, calculations, figures, and tables. This material includes discussions of 1: Additional background information about this system; 2: Details of the simulation methodology; 3: Details of the free energy analysis; 4: Details on the calculations of the Q2D Fourier coefficients; 5: Calculations of the binding energies and heats of adsorption; 6: RMS vibrational analysis of the xenon monolayer; 7: Estimates of the effects of the platinum surface dynamics; 8: Additional results from and discussions of the simulations.
Acknowledgements.
We would like to thank L.W. Bruch for probing discussions, insightful questions, and useful suggestions. We would like to acknowledge and thank C. Chen and S. Kapita for the work they did on the preliminary studies that preceded and motivated this work. We thank Lafayette College for its generous support and the Computer Science Department of Lafayette College for use of their research computer cluster. JB’s exchange visit to Lafayette College during the calendar year was sponsored by the Brazilian government agency Coordenação de Aperfeiçoamento de Pessoal de Nível Superior (CAPES) as part of the Science Without Borders program. JB acknowledges funding from the Austrian Science Fund (FWF) through the START project Y879-N27.Appendix A Diffraction Peak Index Mappings
| Lattice Type | Kern111As described in Ref. [Kern et al., 1986b]. | Maps Into | This Work |
|---|---|---|---|
| Platinum | |||
| Xenon | |||
| Xenon | |||
| Xenon |
We are using the convention that the primitive translation vectors for both the xenon lattice and the Pt lattice are placed apart. Thus, the primitive reciprocal lattice vectors for both lattices ( for the xenon and vectors for the platinum) are apart. As a result, the magnitude of is times the magnitude of , and the same is true for the vectors. This is in contrast with some of the referenced experimental work, where the opposite convention is used. Furthermore, there is a rotation and sometimes an inversion between the reciprocal lattices used here and some of the experimental references. In addition, the SIC experimental data are an incoherent sum of peaks from three different orientations of the SIC walls, while the peaks presented here are those of a system with a single orientation. Therefore, some care must be exercised when comparing the simulation results to the experimental ones. In particular, the convention used here for the reciprocal lattice vector indexing differs from that used in the experimental work of Kern and co-workers.Kern et al. (1986b) This work uses an angle of between the primitive reciprocal lattice vectors and the experimental work uses an angle of . Table 7 shows the mapping between the indices used in this work and that used in Ref. [Kern et al., 1986b].
References
- Bruch et al. (1997) L. W. Bruch, M. W. Cole, and E. Zaremba, Physical Adsorption, International Series Of Monographs On Chemistry; No. 33 (Oxford University Press, New York, 1997).
- Bruch et al. (2007) L. W. Bruch, R. D. Diehl, and J. A. Venables, Rev. Mod. Phys. 79, 1381 (2007).
- Corboz et al. (2008) P. Corboz, M. Boninsegni, L. Pollet, and M. Troyer, Phys. Rev. B 78, 245414 (2008).
- Ahn et al. (2016) J. Ahn, H. Lee, and Y. Kwon, Phys. Rev. B 93, 064511 (2016).
- Morishita (2017) M. Morishita, J. Low Temp. Phys. 187, 453 (2017).
- Madeira and Vitiello (2017) L. Madeira and S. A. Vitiello, Surf. Sci. 655, 39 (2017).
- Aziz (2011) R. A. Aziz, in Inert Gases: Potentials, Dynamics, And Energy Transfer in Doped Crystals, edited by M. L. Klein (Springer, New York, 2011), vol. 34 of Springer Series in Chemical Physics), p. 5.
- Bruch (1983) L. W. Bruch, Surf. Sci. 125, 194 (1983).
- Steele (1974) W. A. Steele, The Interaction Of Gases With Solid Surfaces, vol. 3 of The International Encyclopedia Of Physical Chemistry And Chemical Physics. Topic 14: Properties Of Interfaces, (Pergamon Press, Oxford, New York, 1974).
- Vidali et al. (1991) G. Vidali, G. Ihm, H.-Y. Kim, and M. W. Cole, Surf. Sci. Rep. 12, 133 (1991).
- Jardine et al. (2004) A. P. Jardine, S. Dworski, P. Fouquet, G. Alexandrowicz, D. J. Riley, G. Y. H. Lee, J. Ellis, and W. Allison, Science 304, 1790 (2004).
- Hayes and Manson (2012) W. W. Hayes and J. R. Manson, Phys. Rev. Lett. 109, 063203 (2012).
- Farias and Rieder (1998) D. Farias and K.-H. Rieder, Rep. Prog. Phys. 61, 1575 (1998).
- Gellman et al. (2016) A. J. Gellman, L. Baker, and B. S. Holsclaw, Surf. Sci. 646, 83 (2016).
- Chen et al. (2012) D.-L. Chen, W. A. Al-Saidi, and J. K. Johnson, J. Phys.: Condens. Matter 24, 424211 (2012).
- Diehl et al. (2004) R. D. Diehl, T. Seyller, M. Caragiu, G. S. Leatherman, N. Ferralis, K. Pussi, P. Kaukasoina, and M. Lindroos, J. Phys.: Condens. Matter 16, S2839 (2004).
- Seyller et al. (1999) T. Seyller, M. Caragiu, R. D. Diehl, P. Kaukasoina, and M. Lindroos, Phys. Rev. B 60, 11084 (1999).
- Barker and Rettner (1992) J. A. Barker and C. T. Rettner, J. Chem. Phys. 97, 5844 (1992).
- Barker and Rettner (1994) J. A. Barker and C. T. Rettner, J. Chem. Phys. 101, 9202 (1994).
- Betancourt and Bird (2000) A. Betancourt and D. Bird, J. Phys.: Condens. Matter 12, 7077 (2000).
- Liang et al. (1990) K. S. Liang, K. L. D’Amico, C. H. Lee, and E. Y. Sheu, Phys. Rev. Lett. 65, 3025 (1990).
- Jensen and Bak (1983) M. H. Jensen and P. Bak, Phys. Rev. B 27, 6853 (1983).
- Bak (1982) P. Bak, Rep. Prog. Phys. 45, 587 (1982).
- Hobart (1965a) R. Hobart, J. Appl. Phys. 36, 1948 (1965a).
- Hobart (1965b) R. Hobart, J. Appl. Phys. 36, 1944 (1965b).
- Ziman (1972) J. M. Ziman, Electrons And Phonons;The Theory Of Transport Phenomena In Solids (University Press, Oxford, 1972).
- Joos (1990) B. Joos, Solid State Commun. 42, 709 (1990).
- Boutchko and Bruch (2004) R. D. Boutchko and L. W. Bruch, Phys. Rev. B 70, 195422 (2004).
- Varini et al. (2015) N. Varini, A. Vanossi, R. Guerra, D. Mandelli, R. Capozza, and E. Tosatti, Nanoscale 7, 2093 (2015).
- Mandelli et al. (2017) D. Mandelli, A. Vanossi, N. Manini, and E. Tosatti, Phys. Rev. B 95, 245403 (2017).
- Guerra et al. (2017) R. Guerra, M. van Wijk, A. Vanossi, A. Fasolino, and E. Tosatti, Nanoscale 9, 8799 (2017).
- Mclachlan (1964) A. D. Mclachlan, Mol. Phys. 7, 381 (1964).
- Kern et al. (1986a) K. Kern, R. David, R. L. Palmer, and G. Comsa, Appl. Phys. A 41, 91 (1986a).
- Kern (1994) K. Kern, in Phase transitions and Adsorbate Restructuring at Metal Surfaces, edited by D. A. King and D. P. Woodruff (Elsevier Science, New York, 1994), vol. 7 of The Chemical Physics of Solid Surfaces, p. 299.
- Not (a) A. D. Novaco, C. Chen, and S. Kapita (unpublished).
- Novaco et al. (2015) A. D. Novaco, L. W. Bruch, and J. Bavaresco, Phys. Rev. B 91, 161412 (2015).
- Novaco and Bruch (2014) A. D. Novaco and L. W. Bruch, Phys. Rev. B 89, 125431 (2014).
- Kern et al. (1988) K. Kern, R. David, P. Zeppenfeld, and G. Comsa, Surf. Sci. 195, 353 (1988).
- Comsa et al. (1992) G. Comsa, K. Kern, and B. Poelsema, in Helium atom scattering from surfaces, edited by E. Hulpke (Springer-Verlag,, New York, 1992), vol. 27 of Springer series in surface sciences, p. 24.
- Kern et al. (1986b) K. Kern, R. David, R. L. Palmer, and G. Comsa, Phys. Rev. Lett. 56, 620 (1986b).
- Kern et al. (1987) K. Kern, R. David, P. Zeppenfeld, R. Palmer, and G. Comsa, Solid State Commun. 62, 391 (1987).
- Kern (1987) K. Kern, Phys. Rev. B 35, 8265 (1987).
- Bruch and Novaco (2000) L. W. Bruch and A. D. Novaco, Phys. Rev. B: Condens. Matter And Matt. Phys. 61, 5786 (2000).
- Bruch and Novaco (2008) L. W. Bruch and A. D. Novaco, Phys. Rev. B 77, 125435 (2008).
- Black and Bopp (1987) J. E. Black and P. Bopp, Surf. Sci. 182, 98 (1987).
- Black and Bopp (1986) J. E. Black and P. Bopp, Phys. Rev. B 34, 7410 (1986).
- Black and Janzen (1989a) J. E. Black and A. Janzen, Langmuir 5, 558 (1989a).
- Black and Janzen (1989b) J. E. Black and A. Janzen, Phys. Rev. B 39, 6238 (1989b).
- Brunet et al. (2002) F. Brunet, R. Schaub, S. Fedrigo, R. Monot, J. Buttet, and W. Harbich, Surf. Sci. 512, 201 (2002).
- Gottlieb (1990) J. M. Gottlieb, Phys. Rev. B 42, 5377 (1990).
- Gottlieb and Bruch (1991a) J. M. Gottlieb and L. W. Bruch, Phys. Rev. B: Condens. Matter 44, 5759 (1991a).
- Gottlieb and Bruch (1991b) J. M. Gottlieb and L. W. Bruch, Phys. Rev. B 44, 5750 (1991b).
- Flenner and Etters (2002) E. Flenner and R. D. Etters, Phys. Rev. Lett. 88, 106101 (2002).
- Flenner and Etters (2006) E. Flenner and R. D. Etters, Phys. Rev. B 73, 125419 (2006).
- Ustinov and Do (2014) E. A. Ustinov and D. D. Do, Adsorption 20, 439 (2014).
- Ustinov (2014) E. A. Ustinov, J. Chem. Phys. 140, 074706 (2014).
- Novaco (1992) A. D. Novaco, Phys. Rev. B: Condens. Matter 46, 8178 (1992).
- Novaco (1988) A. D. Novaco, Phys. Rev. Lett. 60, 2058 (1988).
- Steele (1973) W. A. Steele, Surf. Sci. 36, 317 (1973).
- Novaco (1979) A. D. Novaco, Phys. Rev. B: Condens. Matter 19, 6493 (1979).
- Dham et al. (1990) A. K. Dham, W. J. Meath, A. R. Allnatt, R. A. Aziz, and M. J. Slaman, Chem. Phys. 142, 173 (1990).
- Bruch et al. (2000) L. W. Bruch, A. P. Graham, and J. P. Toennies, J. Chem. Phys. 112, 3314 (2000).
- Rejto and Andersen (1993) P. Rejto and H. C. Andersen, J. Chem. Phys. 98, 7636 (1993).
- Weaver et al. (1997) J. F. Weaver, J. A. Stinnett, and R. J. Madix, Surf. Sci. 391, 150 (1997).
- Seyller et al. (1998) T. Seyller, M. Caragiu, R. D. Diehl, P. Kaukasoina, and M. Lindroos, Chem. Phys. Lett. 291, 567 (1998).
- Bruch et al. (1998) L. W. Bruch, A. P. Graham, and J. P. Toennies, Mol. Phys. 95, 579 (1998).
- Not (b) A. D. Novaco (unpublished).
- Specht et al. (1987) E. D. Specht, A. Mak, C. Peters, M. Sutton, R. J. Birgeneau, K. L. D’Amico, D. E. Moncton, S. E. Nagler, and P. M. Horn, Z. Phys. B 69, 347 (1987).
- Kardar and Berker (1982) M. Kardar and A. N. Berker, Phys. Rev. Lett. 48, 1552 (1982).
- Ellis et al. (1999) J. Ellis, A. P. Graham, and J. P. Toennies, Phys. Rev. Lett. 82, 5072 (1999).
- Novaco (1980) A. D. Novaco, Phys. Rev. B: Condens. Matter 22, 1645 (1980).
- Narloch and Menzel (1998) B. Narloch and D. Menzel, Surf. Sci. 412-13, 562 (1998), ISSN 0039-6028.