Stacking Characteristics of Close Packed Materials
Abstract
It is shown that the enthalpy of any close packed structure for a given element can be characterised as a linear expansion in a set of continuous variables which describe the stacking configuration. This enables us to represent the infinite, discrete set of stacking sequences within a finite, continuous space of the expansion parameters . These determine the stable structure and vary continuously in the thermodynamic space of pressure, temperature or composition. The continuity of both spaces means that only transformations between stable structures adjacent in the space are possible, giving the model predictive and well as descriptive ability. We calculate the using density functional theory and interatomic potentials for a range of materials. Some striking results are found: e.g. the Lennard-Jones potential model has 11 possible stable structures and over 50 phase transitions as a function of cutoff range. The very different phase diagrams of Sc, Tl, Y and the lanthanides are undrstood within a single theory. We find that the widely-reported 9R-fcc transition is not allowed in equilibrium thermodynamics, and in cases where it has been reported in experiments (Li, Na), we show that DFT theory is also unable to predict it.
In 1611, Kepler suggested that stackings of triangular layers was the most efficient way to pack hard spheres Kepleri (1611). This conjecture was only recently provedHales and Ferguson (2011).
Many elements crystallise in close-packed crystal structures, but the concept of “close-packed” is not part of crystallographic categorization. This is because there are an infinite number of stacking arrangements with equal packing density, spanning a wide range of space group symmetries. Most observed structures have short repeat sequences such as face-centered cubic (fcc) or hexagonal close packed (hcp), but there is no general theory to explain why these should have the lowest energy.
Predicting the stable crystal structure for a material is a longstanding challenge in condensed matter physics. One underlying reason is that crystal structures are defined by discrete symmetry groups and integer numbers of atoms per unit cell. Aside from the atomic positions themselves, there are no continuous variables which cover the entire space of possibilities, thus we are searching for a minimum in a discontinuous space.
Among close-packed structures, only fcc has close packing enforced by symmetry. For all other stackings, there is an “ideal” ratio between interlayer spacing and interatomic separation () which gives close-packing. Generally, materials adopting structures within a few percent of “ideal” are regarded as close-packed.
Stacking sequences are typically defined as a series of layers labelled , , and with atoms positioned at ; ; and respectively, where and are the in-plane lattice vectors. This notation is not unique: a more compact notation Christian and Vitek (1970) uses for layers with identical neighbours (), for those with different (). For examples see table 1.
The most widely-used model for atomistic modelling is the Lennard-Jones potential, which describes the van der Waals bonding of inert gases. It has hcp as the most stable structure at low temperature, transforming to fcc at high temperatureJackson et al. (2002). More sophisticated modelling of electronic structure using density functional theory can be applied across the periodic table, and gives quantitative agreement with experimentJain et al. (2013) although it is impossible to check all possible stacking sequences.
In this paper we show that the energies of the infinity of stacking sequences can be represented by a convergent series, and that phase boundaries between some pairs of crystal structures cannot occur. We demonstrate the extraordinary complexity of the Lennard-Jones phase diagram. We show that deviations from “ideal” c/a ratios are correlated with stability. We also investigate the role of pressure and uncover some deep-seated inadequacies in interatomic potentials.
To define the stacking sequence with periodicity M, we introduce a set of parameters
| (1) |
where is 1 when the and layers have the same ABC symbol, and 0 otherwise. Physically can be thought of as “The fraction of the atomic positions for which there is another atom at ”, where is the interlayer separation. As , or for an arbitrary density of stacking faults, the s become continuous variables,
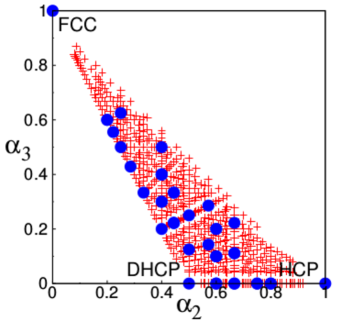
The set of ’s up to univocally describes any possible stacking with an fold or fewer periodicity. All translationally, rotationally or reflectionally equivalent stackings have the same unique set of , unlike the ABC and hf notations which have considerable redundancy. Trivially, and for all close-packed structures. Only certain ranges of s correspond to physically-realizable structures (see Fig.1).
| Name | ABC | hf | Minimal | ||
|---|---|---|---|---|---|
| hcp | 1 | 0 | |||
| fcc | 0 | 1 | |||
| fcc | 0 | 1 | |||
| dhcp | 1/2 | 0 | |||
| 2/5 | 2/5 | ||||
| 9R | 2/3 | 0 |
Specifically
Utilizing the CASTEP simulation package Clark et al. (2005), well-converged energies for various stackings were determined in the framework of density functional theory using the PBE exchange-correlation functionalPerdew et al. (1996) for a selection of elements known to adopt close packed structures at a range of pressures. In addition to the DFT calculations, we calculate energies of the same structure set using a number of interatomic potentials, both pairwise and many-body, which were fitted to represent the same materials. Our structure set consists of all 43 possible stacking sequences for up to 10 atomic layer repeats in the notation (c/f Table 1) excluding redundant strings (i.e. those with identical ). Calculations are performed starting from hexagonal style unit cells with cell angles 90°, 90°, 60°; Internal coordinates and lattice parameters were fully relaxed, and double-checked to ensure that each structure remained in its initial metastable state, with each atom in the structure retaining 12-fold coordination and undergoing only small distortion from close-packing.
Each material is characterized by parameters which are obtained by a least squares fit to the 43 calculated enthalpies assuming a linear dependence on ,
| (2) |
Every material is therefore represented as a point in an N-dimensional Hn-space, and every point in the Hn-space has an associated most-stable stacking structure calculated by minimizing Eq.2 with respect to . e.g. consider the summation in Eq.2 up to only , the enthalpy varies linearly with and , and it follows that the most stable structure must be located at a corner of the triangle of physically-possible states shown in figure 1(a), allowing only fcc, hcp, or dhcp. More complex structures may be stable if considering and higher terms.
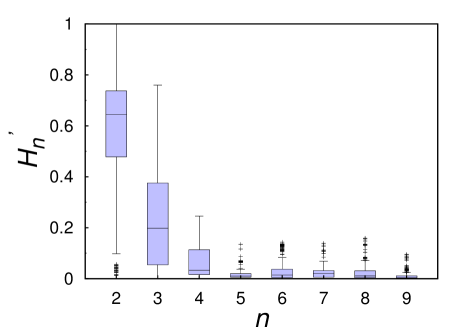
The and values for a range of materials and pressures are shown in Fig. 2(a). The residuals in the fit to DFT data are of order tenths of meV per atom, about 1% of the enthalpy differences between structures. For Eq.2 to be useful it must be rapidly convergent, and in Fig 1(b) we show that the terms do indeed decay rapidly with . Typically, the and contributions are dominant.
(a) (b)
(b)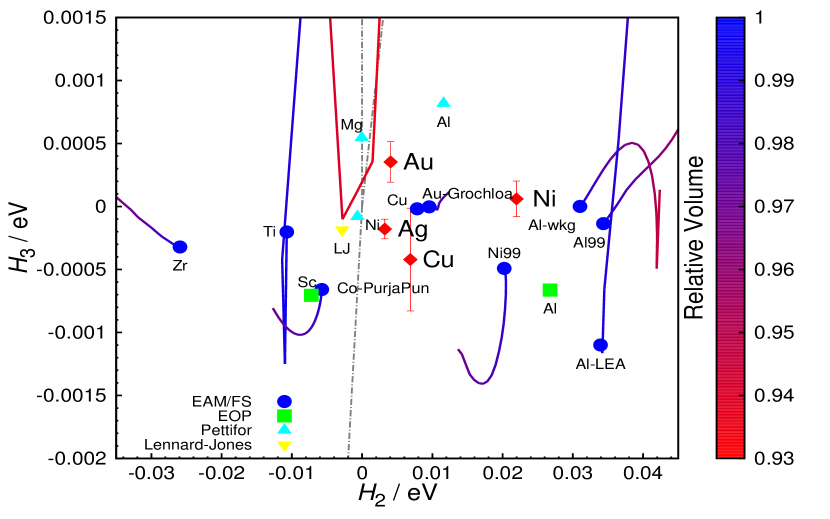
The key to the usefulness of this result is that we have transformed the discrete representation ( or ) of the crystal structure to a continuous space one (). This enables us to anticipate phase transitions arising from continuously changing thermodynamic variables such as temperature, pressure or composition. To do this, consider the N-dimensional space. Any stacking will have some region of stability if is large enoughFisher and Selke (1980). Geometrically, these regions are hyperpyramids which meet at the origin where enthalpy is independent of stacking. If we change the pressure continuously, the also change continuously, tracing a path through the -space which can be evaluated based on DFT calculations at different pressures a given material. When this path crosses from the stability region of one phase to another, this corresponds to a phase transition. A dramatic physical consequence is that transformations between phases whose stability regions are non-adjacent in space (Fig 3), such as fcc and 9R, are not thermodynamically possible in any system for which the representation converges. If the are fitted to free energy calculations, temperature-driven transitions can also be intimated.
There are similarities with the long-ranged 1D Ising modelBak and Von Boehm (1980); Fisher and Selke (1980); Yeomans (1988), in which possible stackings (here and ) are represented by spins Cheng et al. (1988, 1987); Denteneer and Van Haeringen (1987); Plumer et al. (1988); Vitos et al. (2006). In that case maps to the field, while the Ising interaction terms are linear combinations of our . The Ising representation turns out to be less useful because it converges slowly. To understand why, consider the strings ABACB and ABABC, which give .hff. and .hhf. for the Ising representation. In the first case the next neighbour hf interaction is between unlike (BC) layers, in the second between like (BB) layers. In the physical system, the set of separations between atoms in B-C is different from B-B, and the associated enthalpy differences are well represented by . In the Ising picture, this difference emerges from correlations between longer range interactions, which have an unintuitive mathematical origin.
For a given material, the vary continuously with pressure, temperature or, for alloys, with composition. Fig.2(a) shows trajectories projected into (, ) space for pressures up to 20 GPa. The clustering of elements’ and values and the similarities of their pressure dependence corresponds to periodic table groupings, indicating an electronic origin of the observed properties.
Many further inferences can be drawn from thr space, for example Group 11 metals lie close to the origin, and low values of suggest changes in are not energetically costly. As a consequence, stacking faults (incremental change in ) have low energy, meaning that dislocations can glide easily and Group 11 materials are soft and malleable.
The set of describe the relationship between close-packed layers, so non-close-packed phases such as bcc or the phase of titanium are not accounted for.
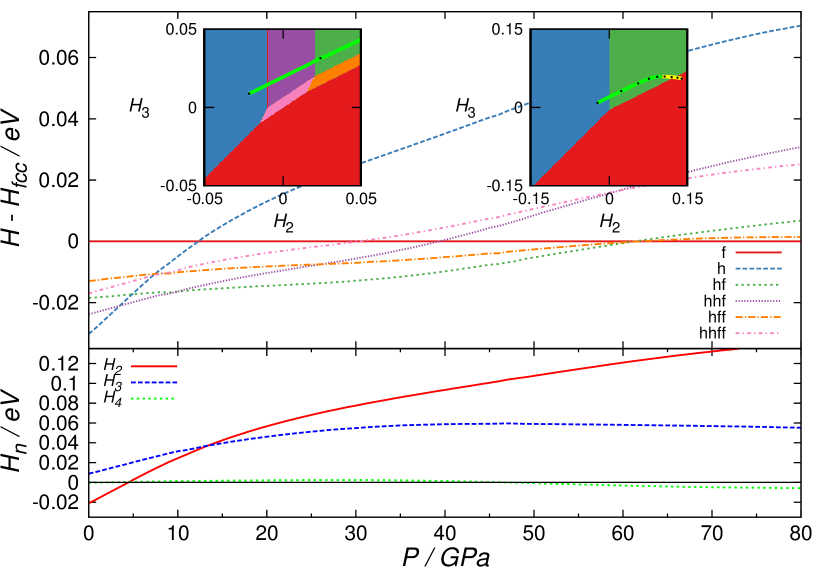
Yttrium is a particularly interesting case. Projection of its pressure trajectory onto the (, ) plane moves it from hcp stability into the dhcp phase (see Fig.2). ExperimentallyVohra et al. (1981); Grosshans et al. (1982), yttrium does this via and intermediate Sm-type phase, also called 9R, which consists of 9 layers: and can be described in the hf notation as (Table 1). However hcp, 9R, and dhcp all have values of zero, and are hence degenerate in situations where . Consequently 9R lies on the boundary of the hcp phase with the dhcp phase in figure 1. Once terms are included in equation (2), there is a wedge of 9R stability for . This must be traversed as an intermediate phase between hcp and dhcp, as observed.
Qualitatively, we find that yttrium transforms from hcp to 9R at 4 GPa, then to dhcp at around 10 GPa (Fig.3). These numbers agree with other DFT calculationsChen et al. (2011, 2012) but are lower than observed experimental pressures, which might be due to hysteresis since the experiments were done with increasing pressure only.
Scandium and thallium appear to behave similarly to yttrium (see Supplemental materials), but Sc is known to transform to a complex non-close-packed structure at a lower pressure than where its trajectory would cross the hcp-dhcp boundary in figure 2(a). The trajectory for thallium goes towards the transition line with pressure, but so it passes below the origin and hcp-fcc is the only observed transition.
The 9R and fcc structures are not adjacent in Fig 1. Therefore, no thermodynamic phase boundary can exist between 9R and fcc. This prohibition of pressure-driven transitions in any system is curious because such transitions have been reported in lithium and sodium. However, Li 9R was very recently proved not to be stableAckland et al. (2017), and we find both Li and Na to be more stable in fcc than 9R at all pressures. By contrast, the 9R phase is adjacent to hcp and dhcp, (Fig. 1), so its presence in the samarium phase diagram is expected. Interestingly, the lanthanide sequence of structures dhcp/9R/hcp/fccGschneidner and Valletta (1968); Holzapfel (1995) is also consistent with the model.
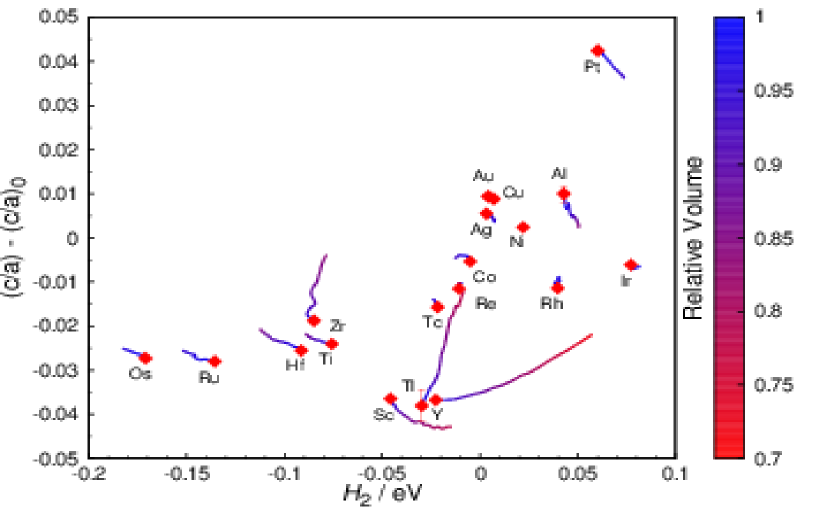
Figure 4 shows that the ratio is strongly correlated with a material’s preference for the hcp or fcc phase (). Typically, materials have , whereas metastable structures of fcc materials have larger than ideal . Curiously, the primary effect of pressure is to move towards ideal, irrespective of the change in (Sc being an exception).
The and values for a selection of interatomic potentials are displayed alongside the first principles data (Fig 2). We used the Lennard Jones potential, a set of embedded atom and Finnis-Sinclair potentials Grochola et al. (2005); Ackland (1992); Fortini et al. (2008); Winey et al. (2010); Mishin et al. (1999); Liu et al. (2004); Mendelev et al. (2008); Pun and Mishin (2012), the Empirical Oscillating PotentialMihalkovič and Henley (2012), and Pettifor’s three term oscillating potential for Al, Na, and MgPettifor and Ward (1984); Pettifor (1995) as implemented in the LAMMPS codePlimpton (1995). Remarkably, these potentials almost all fall into a narrow region of Fig.2(a), shown expanded in Fig.2(b), the spread on being some two orders of magnitude smaller than for the DFT calculations.
This weak dependence of enthalpy on stacking sequence implies low basal-plane stacking faults, which leads to systematic erroneously low barriers to basal slip. Furthermore, the phase stability is highly sensitive to pressure and to the details of the empirical potentials.
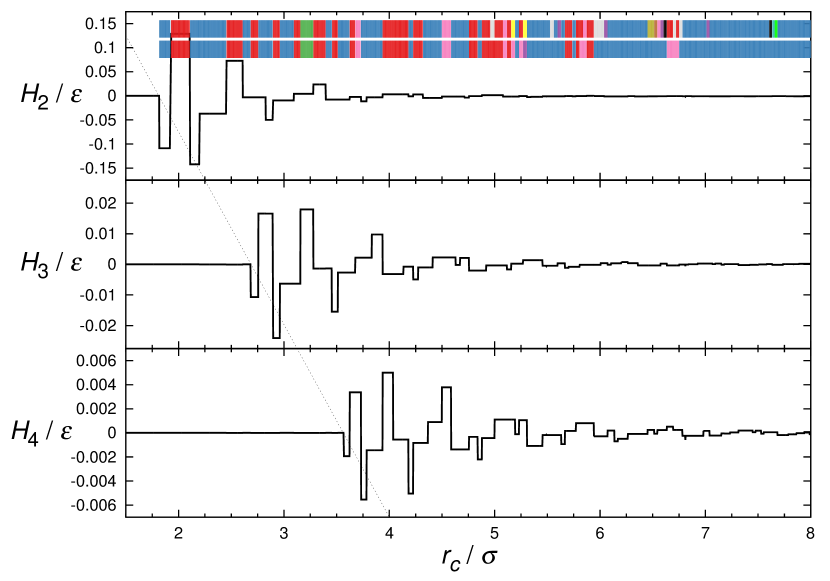
We find truly remarkable results for the Lennard Jones 6-12 forcefield (Fig 5). This most widely-used of potentials is in practice invariably applied with truncationPlimpton (1995), at some range . i.e.
| (3) |
with H the Heaviside function and and defining length and energy units. As , converges to a value of around , which accounts for most of the difference in energy between the fcc and hcp phases, while converges to a value two orders of magnitude smaller, indicating a stable hcp ground state. The dependence of the values on is erratic; discontinuities occur as new coordination shells come within range, with even changing five times. This means that a large number of minimum enthalpy phases are observed as a function of the cutoff, as indicated in figure 5. Calculation using an alternative truncation with the energy and force shifted to remove the discontinuities at the cutoff distance, is better behaved, but still undergoes five transformations with increasing cutoff, with regions of fcc, hcp and dhcp phases (see Supplemental Materials).
The interatomic potentials exhibit more pressure induced phase transitions than the DFT calculations. We propose that this is because they have a fixed characteristic lengthscale associated with the zero pressure fitting data. In reality, the characteristic length for metallic interactions might be the Fermi wavelength, which reduces with pressure. The long ranged oscillations of Pettifor potentials scale with the Fermi vector, meaning that the position of shells of neighbouring atoms is unchanged relative to the maxima and minima of the potentialPettifor (1995). Consequently, Pettifor potentials show fewer pressure-induced transitions than other models.
In summary, we showed that different stackings of monatomic close packed metals can be uniquely described by a set of structure-specific continuous variables , and that an enthalpy expansion in these quantities leads to a multidimensional space containing regions of stability for all stackings. The material-specific fitted expansion coefficients converge quickly with , and allow the stablest structure to be determined. Changes in with pressure allow us to identify phase transformations.
Using the model, we predict that a boundary between fcc and 9R (Sm-type) phases cannot exist in any phase diagram, requiring a reassessment of stability of the reported 9R in Na and Li, but not in the Sm prototype. We reproduce and interpret the phase transformation sequence in Y, Sc, and Tl. We identify excess polytypism as problematic for simple interatomic potentials in general, and demonstrate an unprecedented amount of polytypism in the Lennard-Jones system.
Acknowledgements.
GJA acknowledges support from a Royal Society Wolfson award, and the ERC grant Hecate. CHL thanks EPSRC CM-CDT grant EP/L015110/1 for a studentship, computing resource was provided by EPSRC via UKCP grant EP/P022790/1. Data from the calculation is available in Edinburgh datastoreReferences
- Kepleri (1611) J. Kepleri, 1966 translation by Colin Hardie, Clarendon Press, Oxford (1611).
- Hales and Ferguson (2011) T. C. Hales and S. P. Ferguson, The Kepler Conjecture: The Hales-Ferguson Proof (Springer, New York, 2011), ISBN 978-1-4614-1128-4.
- Jackson et al. (2002) A. N. Jackson, A. D. Bruce, and G. J. Ackland, Physical Review E 65, 036710 (2002).
- Jain et al. (2013) A. Jain, S. P. Ong, G. Hautier, W. Chen, W. D. Richards, S. Dacek, S. Cholia, D. Gunter, D. Skinner, G. Ceder, et al., APL Materials 1, 011002 (2013), ISSN 2166532X, URL http://link.aip.org/link/AMPADS/v1/i1/p011002/s1&Agg=doi.
- Christian and Vitek (1970) J. Christian and V. Vitek, Reports on Progress in Physics 307 (1970), URL http://iopscience.iop.org/0034-4885/33/1/307.
- Clark et al. (2005) S. J. Clark, M. D. Segall, C. J. Pickard, P. J. Hasnip, M. I. J. Probert, K. Refson, and M. C. Payne, Z. Kristallogr. 220, 567 (2005), ISSN 0044-2968, URL http://www.oldenbourg-link.com/doi/abs/10.1524/zkri.220.5.567.65075.
- Perdew et al. (1996) J. P. Perdew, K. Burke, and M. Ernzerhof, Phys.Rev.Letters 77, 3865 (1996).
- Fortini et al. (2008) A. Fortini, M. I. Mendelev, S. Buldyrev, and D. Srolovitz, Journal of Applied Physics 104 (2008), URL http://scitation.aip.org/content/aip/journal/jap/104/7/10.1063/1.2991301.
- Fisher and Selke (1980) M. E. Fisher and W. Selke, Physical Review Letters 44, 1502 (1980).
- Bak and Von Boehm (1980) P. Bak and J. Von Boehm, Physical Review B 21, 5297 (1980).
- Yeomans (1988) J. Yeomans, Solid State Physics 41, 151 (1988).
- Cheng et al. (1988) C. Cheng, R. Needs, and V. Heine, Journal of Physics C: Solid State Physics 21, 1049 (1988).
- Cheng et al. (1987) C. Cheng, R. Needs, V. Heine, and N. Churcher, Europhysics Letters 3, 475 (1987).
- Denteneer and Van Haeringen (1987) P. Denteneer and W. Van Haeringen, Journal of Physics C: Solid State Physics 20, L883 (1987).
- Plumer et al. (1988) M. Plumer, K. Hood, and A. Caillé, Journal of Physics C: Solid State Physics 21, 4189 (1988).
- Vitos et al. (2006) L. Vitos, P. A. Korzhavyi, and B. Johansson, Physical Review Letters 96, 117210 (2006).
- Vohra et al. (1981) Y. Vohra, H. Olijnik, W. Grosshans, and W. Holzapfel, Physical Review Letters 47, 1065 (1981).
- Grosshans et al. (1982) W. Grosshans, Y. Vohra, and W. Holzapfel, Journal of Magnetism and Magnetic Materials 29, 282 (1982).
- Chen et al. (2011) Y. Chen, Q.-M. Hu, R. Yang, et al., Physical Review B 84, 132101 (2011).
- Chen et al. (2012) Y. Chen, Q.-M. Hu, R. Yang, et al., Physical Review Letters 109, 157004 (2012).
- Ackland et al. (2017) G. J. Ackland, M. Dunuwille, M. Martinez-Canales, I. Loa, R. Zhang, S. Sinogeikin, W. Cai, and S. Deemyad, Science 356, 1254 (2017).
- Gschneidner and Valletta (1968) K. Gschneidner and R. Valletta, Acta metallurgica 16, 477 (1968).
- Holzapfel (1995) W. Holzapfel, Journal of alloys and compounds 223, 170 (1995).
- Grochola et al. (2005) G. Grochola, S. P. Russo, and I. K. Snook, The Journal of Chemical Physics 123 (2005), URL http://scitation.aip.org/content/aip/journal/jcp/123/20/10.1063/1.2124667.
- Ackland (1992) G. J. Ackland, Philosophical Magazine A 66, 917 (1992), URL http://dx.doi.org/10.1080/01418619208247999.
- Winey et al. (2010) J. M. Winey, A. Kubota, and Y. M. Gupta, Modelling and Simulation in Materials Science and Engineering 18, 29801 (2010), URL http://stacks.iop.org/0965-0393/18/i=2/a=029801.
- Mishin et al. (1999) Y. Mishin, D. Farkas, M. J. Mehl, and D. A. Papaconstantopoulos, Phys. Rev. B 59, 3393 (1999), URL http://link.aps.org/doi/10.1103/PhysRevB.59.3393.
- Liu et al. (2004) X.-Y. Liu, F. Ercolessi, and J. B. Adams, Modelling and Simulation in Materials Science and Engineering 12, 665 (2004), URL http://stacks.iop.org/0965-0393/12/i=4/a=007.
- Mendelev et al. (2008) M. I. Mendelev, M. J. Kramer, C. A. Becker, and M. Asta, Philosophical Magazine 88, 1723 (2008), URL http://dx.doi.org/10.1080/14786430802206482.
- Pun and Mishin (2012) G. P. P. Pun and Y. Mishin, Phys. Rev. B 86, 134116 (2012), URL http://link.aps.org/doi/10.1103/PhysRevB.86.134116.
- Mihalkovič and Henley (2012) M. Mihalkovič and C. L. Henley, Phys. Rev. B 85, 092102 (2012), URL http://link.aps.org/doi/10.1103/PhysRevB.85.092102.
- Pettifor and Ward (1984) D. G. Pettifor and M. A. Ward, Solid state communications 49, 291 (1984).
- Pettifor (1995) D. Pettifor, Bonding and Structure of Molecules and Solids, Oxford science publications (Clarendon Press, 1995), ISBN 9780198517863, URL https://books.google.co.uk/books?id=r7XGPHD24fgC.
- Plimpton (1995) S. Plimpton, J.Comp.Phys 117, 1 (1995).