Sensitivity analysis of grain surface chemistry to binding energies of ice species
Abstract
Advanced telescopes, such as ALMA and JWST, are likely to show that the chemical universe may be even more complex than currently observed, requiring astrochemical modelers to improve their models to account for the impact of new data. However, essential input information for gas-grain models, such as binding energies of molecules to the surface, have been derived experimentally only for a handful of species, leaving hundreds of species with highly uncertain estimates. We present in this paper a systematic study of the effect of uncertainties in the binding energies on an astrochemical two-phase model of a dark molecular cloud, using the rate equations approach. A list of recommended binding energy values based on a literature search of published data is presented. Thousands of simulations of dark cloud models were run, and in each simulation a value for the binding energy of hundreds of species was randomly chosen from a normal distribution. Our results show that the binding energy of H2 is critical for the surface chemistry. For high binding energy, H2 freezes out on the grain forming an H2 ice. This is not physically realistic and we suggest a change in the rate equations. The abundance ranges found are in reasonable agreement with astronomical ice observations. Pearson correlation coefficients revealed that the binding energy of HCO, HNO, CH2, and C correlate most strongly with the abundance of dominant ice species. Finally, the formation route of complex organic molecules was found to be sensitive to the branching ratios of H2CO hydrogenation.
1 Introduction
The new generation of telescopes, e.g., ALMA and JWST, will provide us with an unprecedented wealth of molecular information. For ALMA this is at very high spatial resolution, which depends on both the observing frequency and the maximum baseline. Despite the fact that ALMA observes these molecules in the gas phase through rotational emission, many of the more complex saturated organic molecules are thought to originate from the mantles of dust grains, since either they or their precursor are formed through grain surface chemistry.
To interpret all this information it becomes more and more pressing to have reliable gas-grain chemical models. Astrochemical models have developed over the decades to understand the molecular processes in the interstellar medium (ISM). Although different approaches have been applied, most studies use the rate equation method because of its simplicity and its advantageous computational time. The gas phase part of these models have been extensively reviewed and the error propagation of the input parameters in the form of rate constants for gas phase reactions has been considered in the calculation of final abundances (Wakelam et al., 2010).
Here we extend this effort to the grain surface part of gas-grain codes by looking at the effect of uncertainties in the binding energy () of species to the grain, by applying the same methodology used for the gas phase reaction rates as Wakelam et al. (2006) and Wakelam et al. (2010). This parameter determines the upper value of the temperature range at which species are available for reactions on the grain surface. Moreover, since in most models the diffusion barrier is obtained from the binding energy, it also, indirectly, determines the onset temperature for surface reactions through the diffusive Langmuir-Hinshelwood mechanism.
Binding energies can be determined experimentally by the Temperature Programmed Desorption (TPD) technique, which will be briefly explained in the next section. But it is not straightforward to provide binding energy information for radical species using TPD, since these species are very short-lived under laboratory conditions. In some cases computational studies can provide valuable information. However, the first gas-grain chemical models (Tielens & Hagen, 1982; Hasegawa & Herbst, 1993b; Charnley, 1997) predate TPD experiments. The binding energies in these early works were estimated from the polarisability of the molecule or atom which provides an estimate of the strength of the van der Waals interaction with the bare grain surface.
In the present paper, we present an extensive literature search in which we arrive at recommended values for the binding energies and their uncertainties. Next, thousands of simulations are performed, where each simulation uses a set of binding energies that is randomly picked from a Gaussian distribution considering the recommended binding energies and their uncertainties. The species that provide the strongest effect on the abundance of key ice components, such as H2O, CO and CH3OH, will be discussed and compared against ice observations.
2 Binding energies
The chemical network used in the present work (Drozdovskaya et al., 2014, 2015; Garrod et al., 2008; Walsh et al., 2015, and references therein) contains 190 surface species for which we need to provide a binding energy. As mentioned before, binding energies are typically obtained by experiments that use the Temperature Programmed Desorption (TPD) technique. This well-established technique consists of two stages: first, the temperature of the substrate is kept constant while the species of interest is deposited; secondly, the temperature is linearly increased until the species are desorbed from the substrate while the desorbing species are recorded using a mass spectrometer. Next, the Polanyi-Wigner equation
| (1) |
where and are respectively the total number of absorbed species and the surface temperature both at a certain time , is fitted to the measured desorption spectra of a species to obtain , a prefactor, and in some cases also the desorption order . Since the prefactor and binding energy are highly correlated, several experiments need to be performed with different amounts of predeposited species. The final results depend on the nature of the substrate from which the species desorbs. As an example we would like to mention the reported experimental values of for water, which may range from 4800 K, as reported by Dulieu et al. (2013) from studies of formation of water on amorphous silicate surfaces, to 5930240 K, as reported by Collings et al. (2015), based on experiments of desorption from amorphous silica. Whether experiments are performed in the monolayer or multilayer regime and whether the deposited ice is pure, mixed, or layered also has an effect. In the multilayer regime, desorption occurs from the species itself and the effect of the underlying substrate becomes negligible as pointed out by Green et al. (2009). Most experiments concentrate their attention on a few important species, such as H2O, CO, CO2, and CH3OH. Data on more complex species is far more sparse. Our collected data is presented in Table 1. Here we take the binding energies from experiments with an amorphous water ice substrate where possible, as an attempt to use homogeneous data, since the differences between different substrates can be large, although smaller in the multilayer regime (Green et al., 2009). The quoted uncertainties in the table are a combination of experimental errors, fitting errors and intrinsic variety of the binding energies due to the inhomogeneity of the substrate. The latter is especially important in the case of amorphous substrates.
In some cases, computational studies can help to derive binding energies. For instance, Al-Halabi & van Dishoeck (2007) simulated adsorption of H atoms to amorphous solid water using classical trajectory calculations. The off-lattice kinetic Monte Carlo approach was used by Karssemeijer & Cuppen (2014) to estimate binding energies of CO and CO2. For the majority of species, however, there are still no laboratory data available nor computational estimates.
| Species | (K) | Order | Prefactora | Substrate | Technique | Ref. | |
|---|---|---|---|---|---|---|---|
| H2 | 480 | 10 | 1 | Submonolayer on amorphous silicate | TPD | 1 | |
| O2 | 914–1161 | 1 | Submonolayer on non-porous ASW | TPD | 2 | ||
| 1100 | 1 | Submonolayer on non-porous ASW | TPD | 3 | |||
| N2 | 1200 | 1 | Submonolayer on non-porous ASW | TPD | 3 | ||
| CO | 863–1307 | 1 | Submonolayer on non-porous ASW | TPD | 2 | ||
| 1420 | 1 | Submonolayer on non-porous ASW | TPD | 3 | |||
| CH4 | 1370 | 1 | Submonolayer on non-porous ASW | TPD | 3 | ||
| O | 1764 | 232 | 1 | Submonolayer on amorphous silicate | TPD | 3a | |
| O3 | 2100 | 1 | Submonolayer on amorphous silicate | TPD | 5 | ||
| OH | 1656–4760 | 1 | Formed on amorphous silicate | TPD | 6 | ||
| CO2 | 2236–2346 | 1 | Submonolayer on non-porous ASW | TPD | 2 | ||
| C2H6 | 2490 | 1 | Submonolayer on non-porous ASW | TPD | 3 | ||
| H2CO | 3260 | 60 | 0 | Submonolayer on non-porous ASW | TPD | 7 | |
| H2O | 4815 | 15 | 1 | Annealed multilayer on CsI | IR spec | 8 | |
| 5070 | 50 | 1 | Unannealed multilayer on CsI | IR spec | 8 | ||
| 5600 | 0 | Amorphous multilayer on gold | TPD | 9 | |||
| 4799 | 96 | 0.26 0.02 | Crystalline multilayer on HOPG | TPD | 10 | ||
| 5930 | 240 | 0 | Multilayer on amorphous silica | TPD | 11 | ||
| 4800 | 1 | Submonolayer on amorphous silicate | TPD | 5 | |||
| H2O2 | 6000 | 1 | Submonolayer on amorphous silicate | TPD | 5 | ||
References:
a In units s-1 for first-order desorption and molec cm-2 s-1 for zeroth-order desorption. Fractional orders are converted to nearest integer value desorption.
1 – Acharyya (2014)
2 – Noble et al. (2012a)
3 – He et al. (2014)
3 – Smith et al. (2016)
5 – Dulieu et al. (2013)
6 – He & Vidali (2014)
7 – Noble et al. (2012b)
8 – Sandford & Allamandola (1988)
9 – Fraser et al. (2001)
10 – Brown & Bolina (2007)
11 – Collings et al. (2015)
| Species | (K) | (K) | |
|---|---|---|---|
| O2 | 29 | 865 | 55a |
| 45 | 1342 | 65b | |
| N2 | 30 | 895 | 55a |
| 46 | 1305 | 70b | |
| C2H2 | 70 | 2090 | 85 |
| H2S | 77 | 2296 | 90 |
| CO2 | 78 | 2325 | 95 |
| OCS | 78 | 2325 | 95 |
| NH3 | 91 | 2715 | 105 |
| CS2 | 95 | 2832 | 105 |
| SO2 | 101 | 3010 | 110 |
| CH3CN | 127 | 3790 | 130 |
| CH3OH | 128 | 3820 | 135 |
| HCOOH | 152 | 4532 | 150 |
aFirst desorption peak.
bSecond desorption peak.
In a few experimental studies, TPD spectra are presented in figures, but no binding energy data is provided by the authors. An example is the paper by Collings et al. (2004). They present an extensive experimental study of a collection of astrophysically relevant molecular species using the TPD technique. Three kinds of experiments were performed, differentiated according to the substrate used: 1) deposition of each species on a pure gold substrate; 2) deposition on a H2O substrate; and 3) co-deposition of each species with water forming a mixture as a substrate. Collings et al. (2004) classified the studied species into three categories based on their desorption behavior. One of these categories is the defined CO-like species, composed of N2, O2, CH4. These very volatile species desorb similarly to CO, presenting two desorption peaks. This is especially evident for N2 and O2. Molecules in the second category are H2O-like, showing a desorption behavior similar to H2O. Included in this category are NH3, CH3OH, and HCOOH. Different from the most volatile species, these H2O-like species are unable to diffuse easily, and it is likely that these species bind strongly to the H2O molecules. Finally, we have the intermediate species category. In this category we can find H2S, OCS, CO2, C2H2, SO2, CS2, and CH3CN. When desorbing from a water ice, these species present a volcano desorption and co-desorption peak, indicating that they are trapped in the water ice. Here, we have estimated the binding energies based on the results presented in Collings et al. (2004) for the deposition of each of those species on a H2O substrate. Our estimation is very simple and was done as follows:
| (2) |
where is the desorption temperature of species X deposited on a H2O film, is the desorption temperature of H2O, and is the binding energy of H2O. The binding energy of water has been determined for a range of different substrates and preparation methods for the water ice. Here we chose = 4800 K, which is the result of a compilation of the amorphous water results (Sandford & Allamandola, 1988; Fraser et al., 2001; Brown & Bolina, 2007; Collings et al., 2015) taking into account the prefactor used in the gas-grain model. It agrees closely with the water binding energy to amorphous silicate (Dulieu et al., 2013). The values of and were obtained by visual inspection of Figure 2 of Collings et al. (2004), from where was estimated as 161 K, and varies according to the species. Since our approach results in an inherent error in the estimated binding energy, we applied an uncertainty of 3.5 % to values in Table 2. As can be seen from Table 1, experimental binding energies for stable species typically have an error around 1 %.
The values we estimated for , and are in close agreement with those found by Noble et al. (2012a) for different substrates. Our estimations for , based on Collings et al. (2004) using the first peak, are similar to those found in other studies (Fuchs et al., 2006; Öberg et al., 2005; Collings et al., 2015). The value found by Smith et al. (2016) is much larger, but this can be explained by the much larger pre-exponential factor that they obtained in their fit. If this is accounted for by assuming the same desorption rate at the peak temperature ( K), the binding energy corresponds to 990 K which is in closer agreement with our estimation from Collings et al. (2004). The reported binding energies for carbon monoxide, on the other hand, show a large deviation. Öberg et al. (2005), for instance, found = 855 K based on experiments of multilayers of pure CO ice, while computational binding energies of Karssemeijer & Cuppen (2014) of CO on various different water substrate ranged between 1555 K and 1700 K. Other experimental studies (Sandford et al., 1988; Acharyya et al., 2007; Collings et al., 2003, 2015; Fuchs et al., 2006; Noble et al., 2012a; Smith et al., 2016) obtained values within these extremes. Our recommended value is based on Noble et al. (2012a), which is representative of CO on water ice surface in the submonolayer regime. Additionally, we use a relatively high value of 250 K for the uncertainty to account for the large distribution of binding sites found in this study.
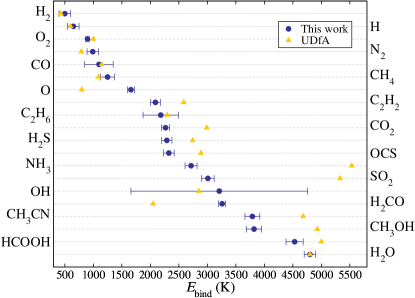
The binding energies and the correspondent uncertainties used here are summarized in Table LABEL:energies. Experimental binding energy values are used for the following species: C2H2, CH3CN, CH3OH, CH4, CO, CO2, H2, H2CO, H2O, H2S, HCOOH, N2, NH3, O, O2, OCS, OH, and SO2. He & Vidali (2014) could only constrain the binding energy of OH to fall between 1656 K and 4760 K. We used here the average with an uncertainty to cover this range. For H2, experiments deliver a large spread in the results. We chose to use here the intermediate value = 500 K, which is very similar to the value found by Acharyya (2014) using TPD experiments. The value for CH4 is based on Smith et al. (2016) who found a value of 1370 K with a high prefactor. Applying a prefactor of s-1 which is more representative of the prefactor typically used in gas-grain codes, an assuming the same desorption rate at the peak intensity (35 K), a binding energy of 1130 K is obtained. We use an intermediate value of 1250 K with an uncertainty of 120 K. The same approach is applied for C2H4. Table LABEL:energies also shows the binding energies recommended by the UMIST111http://www.udfa.net Database for Astrochemistry UDfA (McElroy et al., 2013), which is commonly used. It is clear that for most of the species the values of binding energies recommended by the present work and by the UDfA present large differences. These differences are better visualized in Figure 1, where the values of binding energies recommended by this work and by the UDfA database are plotted in a common diagram for a selection of species. For some species these differences reflect a different choice in substrate. For other cases the UDfA list simply predates the experimental work on which our value is based.
For all other species, we adopt the initial list from Hasegawa & Herbst (1993a), which in turn is based on previous work (Allen & Robinson, 1977; Tielens & Allamandola, 1987), Aikawa et al. (1996), and from Garrod & Herbst (2006). For these cases an uncertainty of 500 K has been used when the value is higher than 1000 K, otherwise the uncertainty is set to half of the binding energy.
| (K) | (K) | (K) | |||||||||
|---|---|---|---|---|---|---|---|---|---|---|---|
| Species | this work | UMIST | Species | this work | UMIST | Species | this work | UMIST | |||
| C | 715 | 360f | 800 | CH2OHCHO | 6680 | 500 | HNO | 1510 | 500d | 2050 | |
| C2 | 1085 | 500f | 1600 | CH2OHCO | 6230 | 500 | HNOH | 5230 | 500 | ||
| C2H | 1330 | 500f | 2137 | CH2PH | 1200 | 500 | HNSi | 1100 | 500 | 1100 | |
| C2H2 | 2090 | 85a | 2587 | CH3 | 1040 | 500f | 1175 | HOCN | 2850 | 500 | |
| C2H3 | 1760 | 500d | 3037 | CH3C3N | 3880 | 500d | 6480 | HONC | 2850 | 500 | |
| C2H4 | 2010 | 500d | 3487 | CH3C4H | 3830 | 500d | 5887 | HPO | 1200 | 500 | |
| C2H4CN | 5930 | 500 | CH3C5N | 5080 | 500d | 7880 | HS | 1350 | 500f | 1500 | |
| C2H5 | 2110 | 500d | 3937 | CH3C6H | 5030 | 500d | 7487 | HS2 | 2300 | 500d | 2650 |
| C2H5CN | 6380 | 500 | CH3C7N | 6290 | 500d | 9480 | HCl | 900 | 450 | 900 | |
| C2H5OH | 3470 | 500d | 5200 | CH3CCH | 4290 | 500 | 2470 | F | 450 | 225 | |
| C2H6 | 2183 | 310b | 2300 | CH3CHCH2 | 5190 | 500 | Fe | 3750 | 500f | 4200 | |
| C2N | 2010 | 500d | 2400 | CH3CHO | 2870 | 500d | 3800 | Mg | 4750 | 500f | 5300 |
| C2O | 2010 | 500d | 1950 | CH3CN | 3790 | 130a | 4680 | N | 715 | 358f | 800 |
| C2S | 2500 | 500d | CH3CO | 2320 | 500 | N2 | 990 | 100b | 790 | ||
| C3 | 2010 | 500d | 2400 | CH3COCH3 | 3300 | 500 | N2O | 2400 | 500 | 2400 | |
| C3H | 2270 | 500d | 2937 | CH3COOH | 6300 | 500 | NCCN | 1300 | 500 | 1300 | |
| C3H2 | 2110 | 500d | 3387 | CH3NH | 1760 | 500d | 3553 | NH | 542 | 270f | 2378 |
| C3N | 2720 | 500d | 3200 | CH3NH2 | 5130 | 500 | NH2 | 770 | 385f | 3956 | |
| C3O | 2520 | 500d | 2750 | CH3O | 2655 | 500 | 5080 | NH2CHO | 5560 | 500 | 5556 |
| C3P | 1650 | 500 | CH3OCH3 | 2820 | 500d | 3300 | NH2CN | 1200 | 500 | 1200 | |
| C3S | 3000 | 500d | 3500 | CH3OH | 3820 | 135a | 4930 | NH2CO | 5110 | 500 | |
| C4 | 2420 | 500d | 3200 | CH4 | 1250 | 120b | 1090 | NH2OH | 2770 | 500d | 6806 |
| C4H | 2670 | 500d | 3737 | CN | 1355 | 500f | 1600 | NH3 | 2715 | 105a | 5534 |
| C4H2 | 2920 | 500d | 4187 | CNO | 2400 | 500 | NO | 1085 | 500f | 1600 | |
| C4H3 | 2970 | 500d | 4637 | CO | 1100 | 250j | 1150 | NO2 | 2400 | 500 | 2400 |
| C4H6 | 5990 | 500 | 5987 | CO2 | 2267 | 70j | 2990 | NS | 1800 | 500f | 1900 |
| C4N | 3220 | 500d | 4000 | COOCH3 | 3650 | 500 | Na | 10600 | 500f | 11800 | |
| C4P | 1950 | 500 | COOH | 5120 | 500 | O | 1660 | 60i | 800 | ||
| C4S | 3500 | 500d | 4300 | CP | 1050 | 500 | O2 | 898 | 30j | 1000 | |
| C5 | 3220 | 500d | 4000 | CS | 1800 | 500f | 1900 | O2H | 1510 | 500d | 3650 |
| C5H | 3470 | 500d | 4537 | Cl | 850 | 425 | 850 | O3 | 2100 | 100c | 1800 |
| C5H2 | 3730 | 500d | 4987 | ClO | 1250 | 500 | 1250 | OCN | 1805 | 500f | 2400 |
| C5N | 3930 | 500d | 4800 | H | 650 | 100k | 600 | OCS | 2325 | 95a | 2888 |
| C6 | 3620 | 500d | 4800 | H2 | 500 | 100e | 430 | OH | 3210 | 1550i | 2850 |
| C6H | 3880 | 500d | 5337 | H2CCC | 2110 | 500 | 2110 | P | 750 | 375 | |
| C6H2 | 4130 | 500d | 5787 | H2CN | 2400 | 500 | 2400 | PH | 800 | 400 | |
| C6H6 | 7590 | 500 | 7587 | H2CO | 3260 | 60j | 2050 | PH2 | 850 | 425 | |
| C7 | 4430 | 500d | 5600 | H2CS | 2025 | 500f | 2700 | PN | 1100 | 500 | |
| C7H | 4680 | 500d | 6137 | H2O | 4800 | 100 | 4800 | PO | 1150 | 500 | |
| C7H2 | 4930 | 500d | 6587 | H2O2 | 6000 | 100c | 5700 | S | 985 | 495f | 1100 |
| C7N | 5130 | 500d | 6400 | H2S | 2290 | 90a | 2743 | S2 | 2000 | 500d | 2200 |
| C8 | 4830 | 500d | 6400 | H2S2 | 2600 | 500d | 3100 | Si | 2400 | 500f | 2700 |
| C8H | 5080 | 500d | 6937 | H2SiO | 1200 | 500 | 1200 | SiC | 3150 | 500f | 3500 |
| C8H2 | 5340 | 500d | 7387 | HC2O | 2010 | 500d | 2400 | SiC2 | 1300 | 500 | 1300 |
| C9 | 5640 | 500d | 7200 | HC2P | 1400 | 500 | SiC2H | 1350 | 500 | 1350 | |
| C9H | 5890 | 500d | 7737 | HC3N | 2685 | 500f | 4580 | SiC2H2 | 1400 | 500 | 1400 |
| C9H2 | 6140 | 500d | 8187 | HC5N | 4180 | 500d | 6180 | SiC3 | 1600 | 500 | |
| C9N | 6340 | 500d | 8000 | HC7N | 5390 | 500d | 7780 | SiC3H | 1650 | 500 | 1650 |
| C10 | 8000 | 500 | 8000 | HC9N | 6590 | 500d | 9380 | SiC4 | 1900 | 500 | 1900 |
| C10H | 8540 | 500 | HCCN | 2270 | 500d | 3780 | SiCH2 | 1100 | 500 | 1100 | |
| C10H2 | 8990 | 500 | HCN | 1580 | 500f | 2050 | SiCH3 | 1150 | 500 | 1150 | |
| C11 | 8800 | 500 | HCNO | 2850 | 500 | SiH | 2620 | 500f | 3150 | ||
| CCP | 1350 | 500 | HCO | 1355 | 500f | 1600 | SiH2 | 3190 | 500d | 3600 | |
| CCl | 1150 | 500 | 1150 | HCOOCH3 | 4000 | 500 | 4000 | SiH3 | 3440 | 500d | 4050 |
| CH | 590 | 295f | 925 | HCOOH | 4532 | 150a | 5000 | SiH4 | 3690 | 500d | 4500 |
| CH2 | 860 | 430f | 1050 | HCP | 1100 | 500 | SiN | 3500 | 500 | 3500 | |
| CH2CCH | 3840 | 500 | HCS | 2000 | 500d | 2350 | SiNC | 1350 | 500 | 1350 | |
| CH2CCH2 | 4290 | 500 | HCSi | 1050 | 500 | 1050 | SiO | 3150 | 500f | 3500 | |
| CH2CHCCH | 5090 | 500 | He | 100 | 50d | 100 | SiO2 | 4300 | 500 | 4300 | |
| CH2CHCN | 5480 | 500 | 5480 | HF | 500 | 250 | SiS | 3400 | 500f | 3800 | |
| CH2CN | 2470 | 500d | 4230 | HNC | 1510 | 500d | 2050 | SO | 1800 | 500f | 2600 |
| CH2CO | 2520 | 500d | 2200 | HNC3 | 4580 | 500 | 4580 | SO2 | 3010 | 110a | 5330 |
| CH2NH | 1560 | 500 | 3428 | HNCHO | 3980 | 500 | |||||
| CH2OH | 2170 | 500d | 5084 | HNCO | 2270 | 500d | 2850 | ||||
| References: aEstimated from Collings et al. (2004); bSmith et al. (2016) with change in pre-factor; cDulieu et al. (2013); dHasegawa & Herbst (1993a); eSimilar to Acharyya (2014); fAverage between Hasegawa & Herbst (1993a) and Aikawa et al. (1996) values; hAverage between Tielens & Allamandola (1987) and Aikawa et al. (1996) values; iHe et al. (2014); He & Vidali (2014); jNoble et al. (2012a); kAl-Halabi & van Dishoeck (2007) | |||||||||||
3 Chemical model
We have simulated the time-dependent gas-grain chemistry of an homogeneous dark cloud with constant physical conditions. This is a two-phase chemistry model, since it treats the gas and solid phase; however, without using location information of ice species within the ice mantle. The model, therefore, does not differentiate between reactions between species located on the ice surface and in the bulk mantle; however, grain-surface reactions are limited to occur within two monolayers worth of material in the ice mantle only. Here we give a brief explanation of the model. For more details we refer to Walsh et al. (2015) and references therein.
3.1 Gas-grain network and physical conditions
The gas-phase network is the UDfA Database for Astrochemistry (McElroy et al., 2013), known as Rate12. This network does not account for three-body reactions, since these are not important at the density used here. Photoreactions and direct cosmic ray ionization are included. The cosmic ray ionization rate () used is 1.3 10-17 s-1 (Indriolo et al., 2015).
The solid phase chemistry is based on the Ohio State University (OSU) network222http://faculty.virginia.edu/ericherb/ (Garrod et al., 2008), which includes gas-grain interactions such as desorption and adsorption processes, and grain surface chemistry. We neglect cosmic-ray-induced thermal desorption and reactive desorption because the rates for these processes remain very uncertain compared with thermal desorption and photodesorption. The model also includes grain-cation recombination. We assume a spherical and compact grain with radius of 0.1 m for simplicity. The grain abundance is fixed to 1.3 10-12 with respect to H nuclei, and the density of grain surface sites is 1.5 1015 cm-2. The ratio between the diffusion barrier () and the molecular binding energy is assumed to be = 0.3 . The value of / is still under debate, and most modelers (Hasegawa et al., 1992; Ruffle & Herbst, 2000; Garrod & Herbst, 2006; Cuppen et al., 2009) have used values ranging from 0.3 to 0.8, although the consensus is that for stable species this ratio should be between 0.3 and 0.4 (Karssemeijer & Cuppen, 2014). Here we chose 0.3, which is an optimistic value that allows the radicals in the grain mantle to diffuse with some efficiency at low temperatures.
In the subsequent sections, we present results for many thousands of simulations for a fixed set of physical conditions and input parameters, except for the set of molecular binding energies. The physical conditions used here are those typical for a dark cloud. The initial abundances are taken from McElroy et al. (2013), which are identical to those used in Garrod et al. (2009). These initial abundances follow the lower metallicity set from Graedel et al. (1982). The total H nuclei density is 2 104 cm-3, and the visual extinction () is 10 mag. Both gas and dust temperatures are 10 K. All simulations were performed over a timescale of 108 years, at which time steady state is expected to be reached. Table 4 summarizes the initial elemental abundances, while Table 5 summarizes the assumed physical parameters. This is a 0D model, which means that all physical parameters are kept constant during the simulations.
In each simulation, a value of the binding energy for each grain-surface species is chosen at random from a normal probability distribution. The mean value of the normal distribution is the binding energy and the uncertainties correspond to a 3 error. The diffusion rates for each species are than calculated using
| (3) |
and
| (4) |
by assuming thermal or quantum processes. Quantum diffusion is only allowed for light species such as H and H2. In the equations above, , , and are the frequency, the barrier width, and the reduced mass, respectively. These equations show that the binding energies have strong influence on the diffusion rates. Typical values for are 1012 s-1 and we adopt a barrier width between surface sites of 1.5 Å.
| Species | Abundances |
|---|---|
| H | 5.00(-05) |
| H2 | 5.00(-01) |
| He | 9.75(-02) |
| C | 1.40(-04) |
| N | 7.50(-05) |
| O | 3.20(-04) |
| F | 2.00(-08) |
| Na | 2.00(-09) |
| Mg | 7.00(-09) |
| Si | 8.00(-09) |
| P | 3.00(-09) |
| S | 8.00(-08) |
| Cl | 4.00(-09) |
| Fe | 3.00(-09) |
| Grain density | 1.30(-12) |
| NOTE. - The notation () stands for 10β | |
| 2104 cm-3 | |
| 10 K | |
| 10 K | |
| 10 mag | |
| 1.3 10-17 s-1 |
4 Results
4.1 Updating the network
The first set of models used the standard network from Drozdovskaya et al. (2014, 2015), and Walsh et al. (2015), which adopt the surface network from Garrod et al. (2008) and mainly focussed on O-bearing complex organic molecules. We ran a thousand simulations using the standard network. For the key ice species, CO, HCO, H2CO, CH3OH, HCOOH, H2O, CO2, CH4, and NH3, we then calculated the Pearson correlation coefficient between the logarithm of the abundance at different times and the binding energy of each of the species listed in Table LABEL:energies
| (5) |
where cov stands for the covariance and is the standard deviation. This coefficient gives a measure of linear correlation or anti-correlation between the logarithm of the ice abundance and the binding energy, and lies between -1 and 1. We selected those species that have an absolute correlation coefficient equal to or larger than 0.3, i.e. 0.3. The binding energy of HNO was found to correlate with the log of the abundance of several species, which is rather unexpected since HNO is not a direct precursor to any of these species. HNO acts, however, as an efficient producer of OH radicals via the reaction
| (6) |
HNO is formed through hydrogenation of NO. A dominant destruction reaction for HNO in our standard network is the reaction with H leading to NO and H2. NO catalyzes in this way the production of OH from O and H by making H temporarily unavailable for other reactions. However, laboratory experiments (Congiu et al., 2012; Fedoseev et al., 2012) show that hydrogenation of HNO leads predominantly to the formation of NH2OH through
| (7) |
followed by
| (8) |
These reactions will take HNO out of the loop and block the formation of new OH radicals that can lead to the formation of CH3OH, HCOOH, CO2, and H2O. We have therefore updated the network by adding the chemistry for NH2OH, which includes the gas phase chemistry of the neutrals and all intermediate ions. We have also included the chemistry for NH2CHO (formamide), and CH3NH2 (methylamine), both gas and surface reactions and also extracted from the OSU network (Garrod et al., 2008). This first set of simulations shows clearly the importance of new laboratory experiments to investigate chemical pathways that are not yet considered in most of astrochemical models but are fundamental to obtain more reliable results. The final network contains 8971 reactions connected by 689 species.
4.2 Varying binding energies
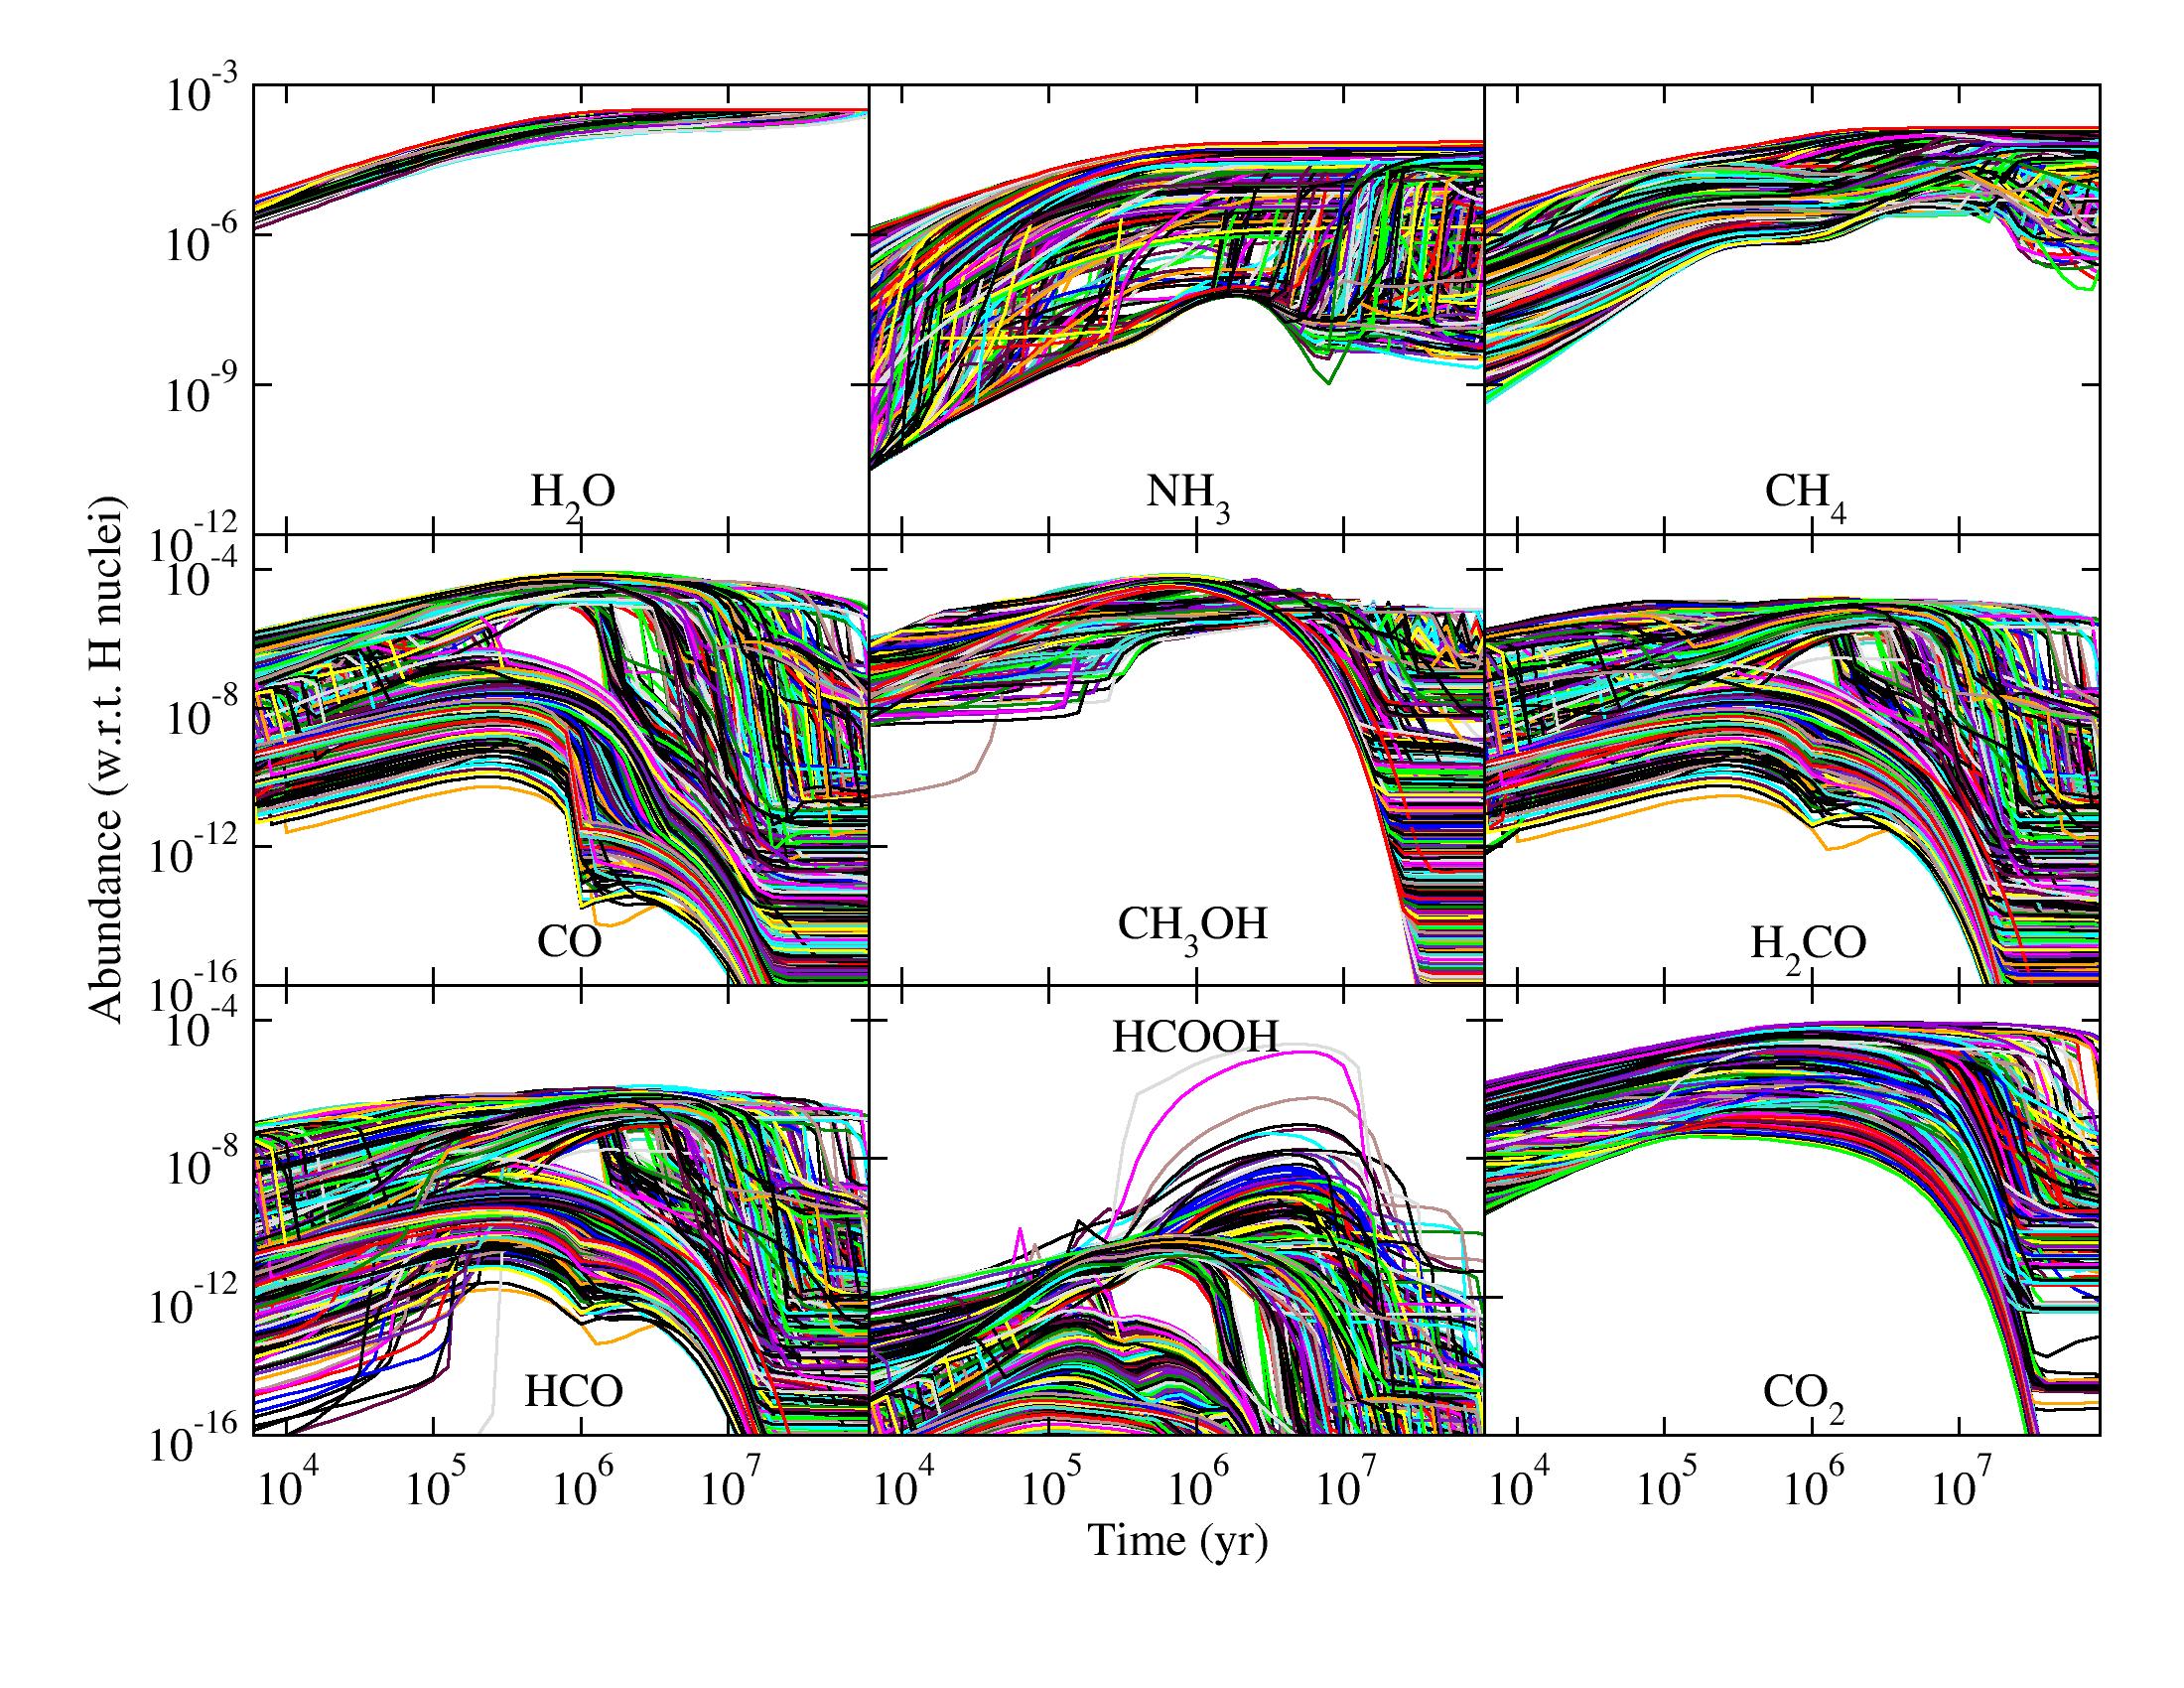
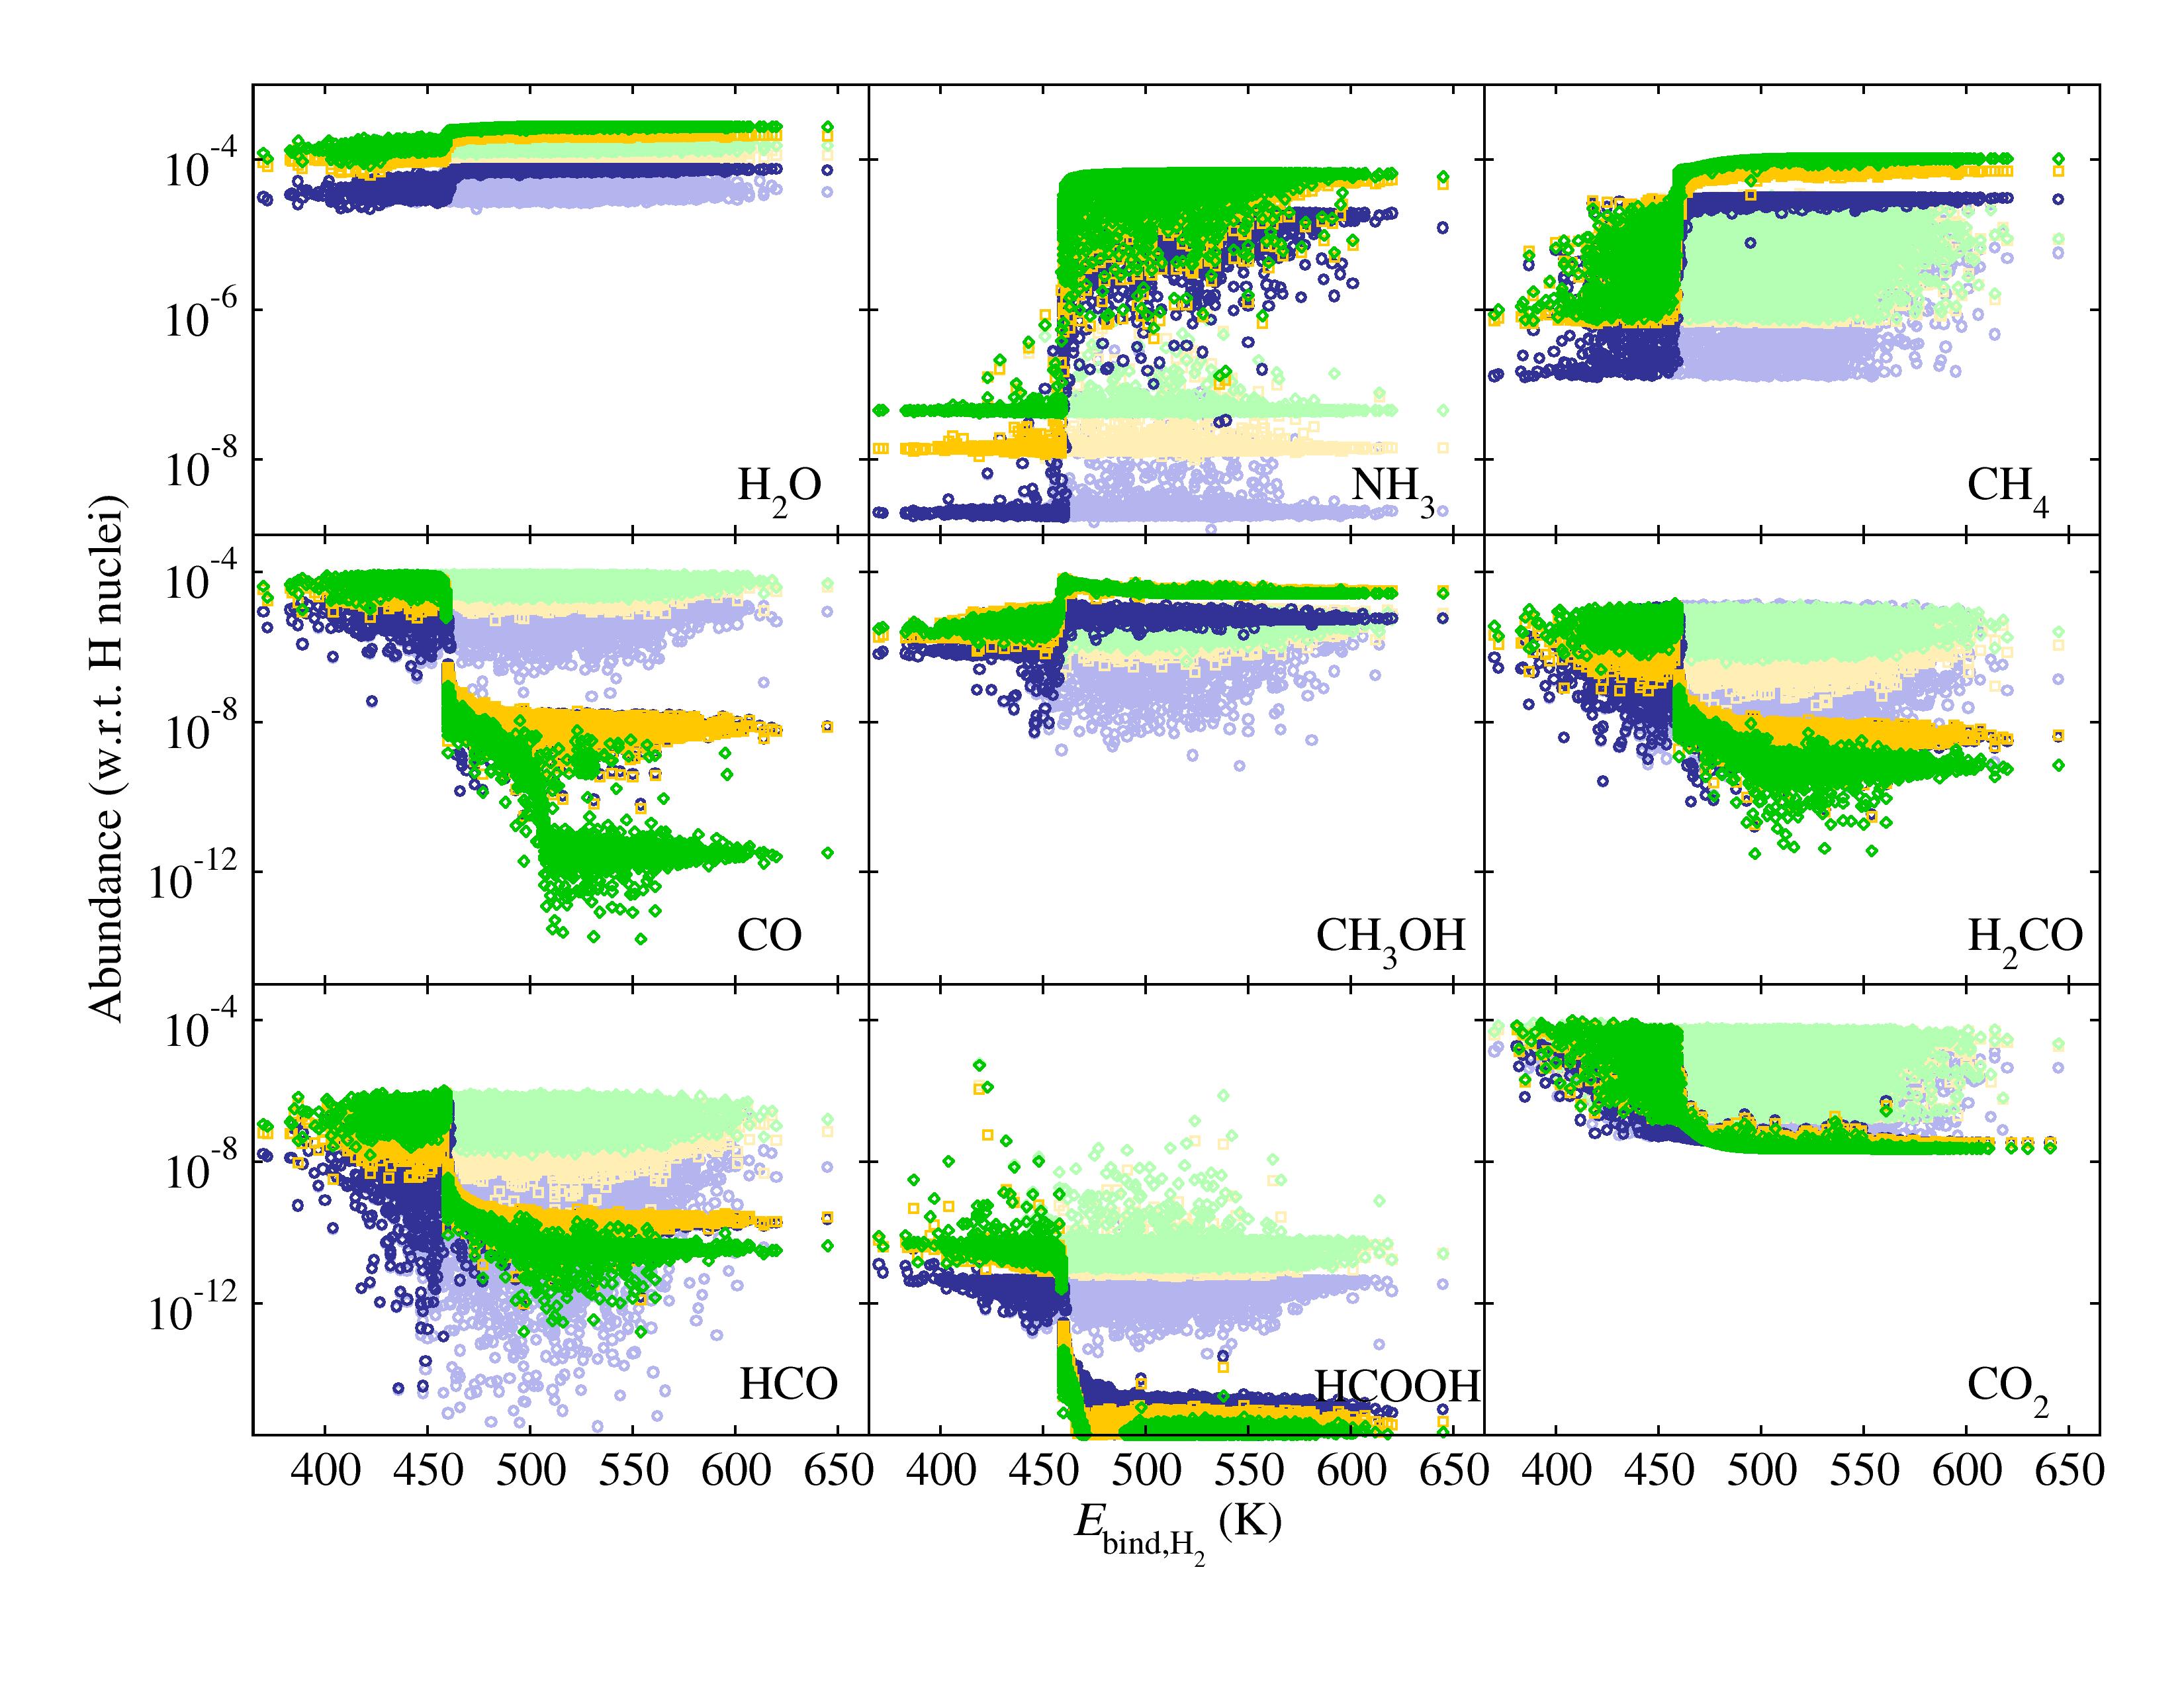
Using this new network we performed 10,000 simulations selecting a set of binding energies at random from their normal distributions. Figure 2 shows the evolution of the ice abundance of some key ice species – CO, HCO, H2CO, CH3OH, HCOOH, H2O, CO2, CH4, and NH3. The abundance is taken with respect to H nuclei. Clearly there is a large variation in steady state abundance, especially for the species with CO as one of their precursors, but also in the time evolution of the abundances. To assess the origin of these differences, we again determined the Pearson correlation coefficient between the binding energies and the log of the abundance with respect to H nuclei. The binding energy of H2 was found to be the most strongly correlating parameter. This is evident in Figure 3, which shows the ice abundance at three different times – 105 (darker blue), 5105 (darker yellow), and 106 (darker green) years – as a function of H2 binding energy. There is a clear change in chemistry around = 460 K. For some species this change occurs somewhat earlier than for others. Two groups can be identified according to similar general behavior. A group, including CH4 and NH3, that have a high abundance for high and a group with CO, HCO, H2CO, CO2, and HCOOH which show a sharp decrease with increasing . The abundance of water and methanol is less sensitive to the value of H2 binding energy.
To determine the origin of this bifurcation, we have analyzed the two populations containing runs with 460 K and 465 K separately. By identifying correlations between ice abundances and binding energies in both simulation populations separately, we hope to gain insight into the change in chemistry that is causing this effect. The discontinuity in temperature is intentional in order to isolate the two sets of results. The binding energy of H2 still correlates most frequently with the different ice abundances, mainly at later times. Other species whose binding energies appear to correlate strongly are HCO, H, N, CH2, and HNO.
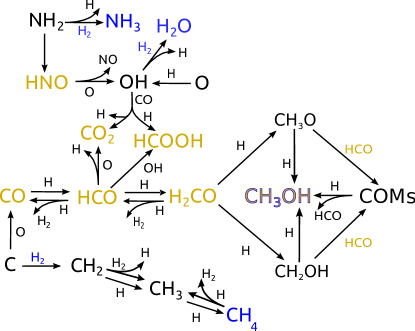
Using these correlations together with information on the most important formation and destruction reactions for the ice species of interest, we extract the limited reaction network that explains the observed trends in the results from the full reaction network containing 2164 surface reactions. This network is depicted in Figure 4. Important precursors in this network are NH2 (formed from N), and C. With increasing H2 binding energies, the residence time of H2 on the surface increases whereas the diffusion barrier for all cases is low enough for H2 to be mobile. For a sufficiently high C and NH2 react sequentially with H2 to form CH4 and NH3, respectively. These pathways are indicated in blue in the schematic. Water is predominantly made through
| (9) |
and its abundance therefore increases with H2 binding energy. The hydroxyl radical, OH, can be formed in different ways. We found the dominant channel to be H + O. For low H2 binding energies,
| (10) |
and
| (11) |
become important as well.
At some critical H2 binding energy, the H2 residence time becomes too short to be able to compete with oxidation reactions of both C and NH2, leading to the formation of CO and HNO, respectively. This opens up a new type of chemistry leading to the species indicated in yellow, CO, HCO, H2CO, CO2, and HCOOH.
Methanol is not only a precursor for more complex saturated organic molecules (COMs) but also one of their main destruction products. We find that for high H2 binding energies, CH3OH is formed exclusively via hydrogenation of CH3O and CH2OH, which are direct products of H2CO + H, even though most of the carbon is initially converted to CH4. For low H2 binding energies, however, the ice abundance of HCO increases and CH3O and CH2OH are found to react with HCO instead of H leading to more complex species. In this way, methanol is more or less “skipped” in the reaction network and is predominantly formed through the destruction of more complex species (i.e., there opens up a “top-down” interstellar formation route to methanol ice).
For K, the H2 surface abundance was found to be equivalent to a thick H2 ice. This is unrealistic to occur, since the binding energy of H2 to itself is significantly lower than to the grain surface. For high , a maximum of one monolayer of H2 is expected to cover the surface of grain mantle. Heavier species landing on the grain will go through this layer to adsorb. H2 molecules landing or diffusing over another H2 molecule will desorb. We have changed our rate equation model to capture this behavior, roughly following Hincelin et al. (2015), as detailed in the appendix. The correlation with is now found to disappear as can be seen in Figure 3 in the lighter colors. In the remainder of the paper we will continue with these results, where the H2 surface abundance remains below one monolayer.
| 1105 yr | 5105 yr | 1106 yr | ||||
|---|---|---|---|---|---|---|
| Species | corr. | corr. | corr. | |||
| CH3OH | HNO | 0.39 | CH2 | 0.52 | CH2 | 0.50 |
| CH2 | 0.37 | HCO | 0.38 | |||
| CO | HCO | 0.50 | HCO | 0.83 | HCO | 0.85 |
| CH2 | -0.33 | |||||
| CO2 | CH2 | -0.56 | HCO | -0.85 | HCO | -0.87 |
| HNO | 0.39 | |||||
| C | -0.31 | |||||
| H2O | HNO | -0.66 | HCO | 0.55 | HCO | 0.65 |
| HNO | -0.52 | HNO | -0.41 | |||
| CH4 | C | 0.66 | C | 0.62 | C | 0.57 |
| HCO | -0.33 | HCO | -0.38 | HCO | -0.43 | |
| HNO | -0.30 | HNO | 0.34 | |||
| HCO | HCO | 0.61 | HCO | 0.94 | HCO | 0.91 |
| CH2 | -0.33 | |||||
| H2CO | HCO | 0.78 | HCO | 0.93 | HCO | 0.89 |
| C | -0.36 | |||||
| NH3 | ||||||
| HCOOH | HCO | 0.55 | HCO | 0.66 | HCO | 0.32 |
| C | 0.31 | |||||
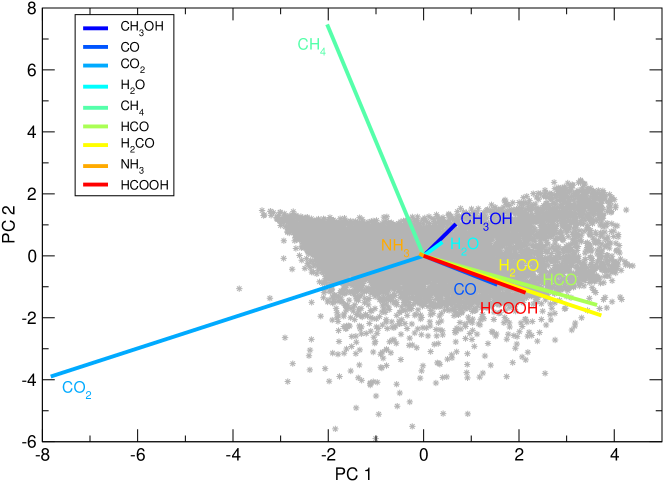
The dispersion found in Figure 3 is due to correlations with binding energies of species other than H2. This is quantified again by the Pearson correlation function for a selection of ice species. All correlations with are listed in Table 6. As can be seen in this table, CO2 shows a strong correlation with the HCO binding energy at late times because an important formation route is through HCO + O. At early times, the correlation with C and CH2 can be explained by the formation of CO through C + O and its competing reaction C + H2 (see Figure 4). HNO is again linked to the formation of OH which is involved in CO2 production through CO + OH. Figure 3 also clearly shows the orders of magnitude difference between the ice abundances. To make the correlation between different abundances more apparent, we have performed a Principal Component Analysis (PCA) of the logarithm of the abundances of the main species obtained at 106 years. In a PCA analysis an axis transformation is performed where the new dimensions, principal components, are linear combinations of the original dimensions; in this case the log of the ice abundances. These principal components are chosen such that the first describes as much as the variance in the data as is possible, followed by the second, etc. The results of the PCA analysis are shown in Figure 5. Each gray dot in this figure represents an individual simulation projected onto the first and second principal components (the scores). The spread of these points show that the dependence of the logarithm of the abundance on the parameter choice is highly nonlinear. The lines in the graph represent the loadings, which are the coefficients in the transformation matrix. The length of the line is a measure for the amount of variance in the original dimension. The length of the lines were multiplied by a factor of ten for better visualization. In accordance with Figure 3, the species that present the largest variance in abundance are CO2 and CH4, followed by H2CO, HCO, HCOOH, CO, HCOOH, CH3OH, H2O, and NH3, respectively. The directions of the lines reveal correlations between the abundances, where overlapping lines indicate species with similar variance patterns. Although it is dangerous to directly infer a chemical network from these correlates, we can however draw some conclusions, on the basis of the PC analysis in combination with the flux analysis that we performed earlier to arrive at Figure 4. We see that the CO hydrogenation products, HCO, HCOOH, H2CO, as well as CO are correlated. CO2 and CH3OH on the other hand do not correlate so tightly indicating that other routes are involved in their formation. CO2 nearly anticorrelates with H2O, reflecting a similar precursor, OH. CH4 and NH3 do not show a strong correlation with any of the other species, reflecting their rather separate formation routes. The PCA analysis hence confirms the scheme depicted in Figure 4.
4.3 The HCO radical and the importance of branching ratios
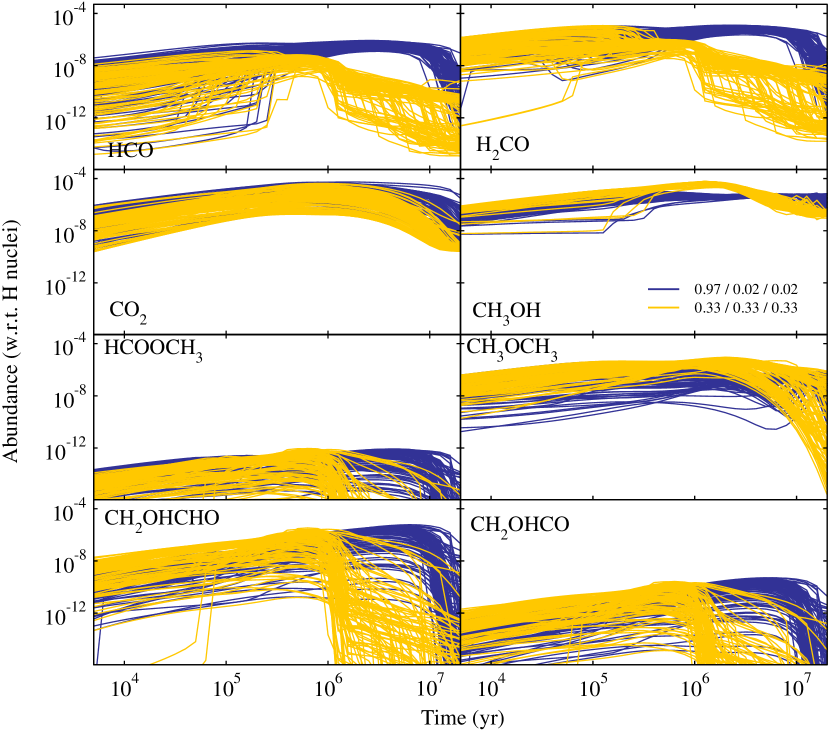
The Pearson correlation coefficients and the network depicted in Figure 4 show that HCO plays a pivotal role the grain surface network. Here we will look at its formation and destruction routes more closely. Its main formation routes are through hydrogenation of CO and H2CO; destruction also mainly occurs through hydrogenation of H2CO. The reaction H + H2CO has three product channels: formation of CH3O or CH2OH and abstraction of a hydrogen atom leading to HCO and H2. Using the standard network, the combination of reaction rates and branching ratios leads to an effective branching ratio of 0.97 for the latter channel. The remainder is equally shared between CH3O or CH2OH. Whereas this might reflect the gas phase chemistry, we find, however, no laboratory data to support these extreme branching ratios on the surface. In a recent experimental study Chuang et al. (2016) investigated these reactions, but they do not quote branching ratios. They find that indeed the addition reaction to CH3O and the abstraction to H2 + HCO occur, and they cannot exclude the channel to form CH2OH. Here, we alter the network by adopting equal ratios for all three channels and performed 100 additional simulations using this network. The evolution of the ice abundance of the species involved in the hydrogenation of CO is shown in Figure 6 in yellow. A comparison is made between the original 100 runs of our standard network in blue.
The timescale of conversion of HCO to H2CO and CH3OH is reduced by a few million years, since there are less back reactions. Moreover, as a consequence of the reduction in HCO, an increase in the methanol abundance can be observed, since CH3O and CH2OH will now predominantly react with H to form methanol. For the more complex species, like HCOOCH3, CH2OHCHO, and the intermediate radical CH2OHCO, both a reduction in the peak intensity and a change in the formation timescale can be observed.
This example clearly shows the importance of accurate branching ratios. In this case, for grain-surface reactions with multiple product channels the ratio between the forwards and backwards reactions is crucial since this determines the timescale of CH3OH formation and the route of complex molecule formation: through CH3OH or through reactions with HCO. We conclude that, using the standard network, reactions forming complex molecules involving HCO are likely overexpressed. Numerous other reactions in the grain surface network have several reaction channels and we believe that the branching ratios used should be carefully scrutinized as it is possible that they have strong effects.
4.4 The effect of initial conditions on COMs production
The overall results indicate that the C + O CO reaction is crucial in the formation of COMs as depicted in Figure 4. So far, the initial form of elemental carbon in the simulations is chosen to be atomic carbon. However, depending on the history of the molecular cloud a substantial fraction could also already be in the form of CO. In this case, one would expect the methanol route start earlier. Here we will look at the extreme case in which all elemental carbon is initially in the form of CO.
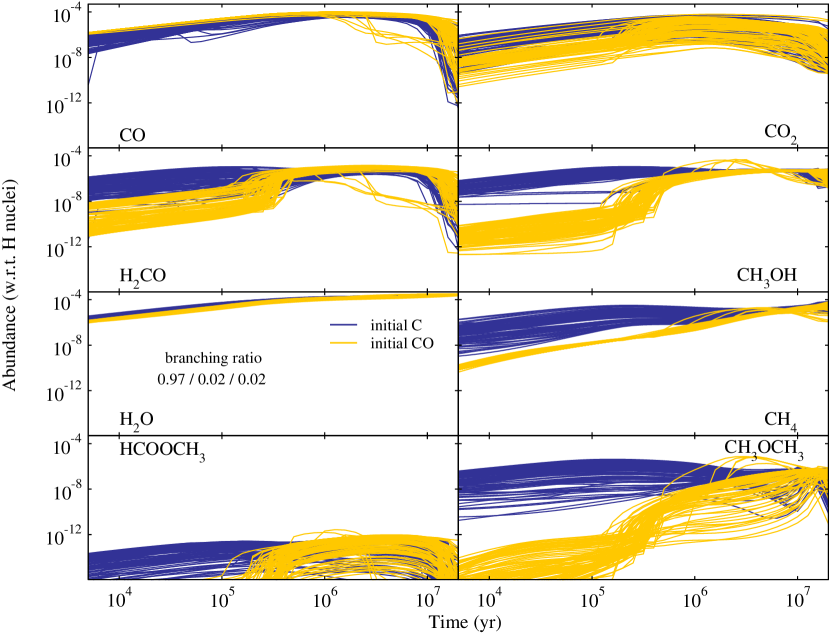
We follow a similar procedure to the previous section by performing another 100 simulations, but with all carbon initially in the form of CO. The initial atomic oxygen abundance is reduced accordingly. The standard network is used and the results are again compared to the previous results. The results are shown in Figure 7. These show an unexpected reduction in H2CO, CH3OH and COMs abundance when we start with all C in the form of CO. The crucial radical to explain this effect is CH3. By starting exclusively from CO, the production rate of this radical is reduced by at least an order of magnitude. It can react with for instance HCO to form CH3CHO which can fall back to H2CO upon hydrogenation or lead to more complex molecules, which in turn reduce to methanol again. Overall, this careful analysis of the reaction network shows that rather than being a final product, COMs also play a crucial role as an intermediate to form main grain mantle species such as formaldehyde and methanol. This already occurs in dark conditions and no photoprocesses are needed for COMs to form at low temperatures (10 K). In hot core models, photodissociation of methanol is used as the formation mechanism of radical species that can then recombine to form more complex molecules upon warm up triggered by the birth of the central star (Garrod & Herbst, 2006; Garrod et al., 2008). Here we see that they may already form at low temperatures, but that they are destroyed by abstraction reactions with atomic hydrogen. The latter reactions become less important for higher temperatures since the residence time of H atoms is significantly reduced at temperatures above 20 K.
4.5 Comparison with ice observations
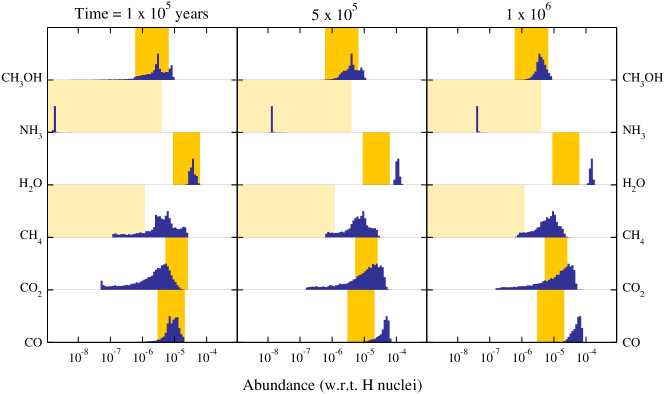
Distributions of the obtained ice abundances with respect to H nuclei are shown in Figure 8 for H2O, CO, CO2, CH3OH, NH3, and CH4, which are all securely identified in these type of objects. Despite the large apparent dispersion in the ice abundances in Figure 3, these histograms highlight that the dispersion in terms of full-width-half-maximum is significantly narrower ( order of magnitude) for most species. We compare the obtained model abundances with observational abundances taken from a recent review by Boogert et al. (2015) where we have taken the background star observations as representative of observations of quiescent clouds and cores. What is clear is the very large spread in observational abundances as indicated by the yellow areas in Figure 8, from upper limits to relatively large values compared with water ice observations. Inspection of Figure 8 shows that the best agreement is obtained at relatively early times of years. This coincides with dark cloud model results focusing on the gas phase, where years is considered as the early time of best overall agreement between models and observations for a large number of species. The current understanding is that the relatively low density of cm-3 persists until roughly 1 Myr when the density increases and the remaining gas phase CO freezes out rapidly on the grains and the star formation sequence starts. With the current density CO freeze out occurs roughly in years (see Figure 7)). After this point, the CO adsorption from the gas phase reduces and destruction of the more complex species wins over formation, simply because its main precursor has run out.
The observations of CH4 and NH3 show only upper limits. Our model results for NH3 fall well below this limit, where as a large fraction of models heavily overproduce CH4. This overproduction of CH4 could be due to too efficient destruction reactions of COMs, because of inaccuracy in branching ratios of reactions leading to CH4 or its precursors, justifying a complete scrutinization of the whole network.
5 Discussion and conclusions
With this paper we set out to study the influence of binding energies of surface species on simulated ice abundances in order to constrain some of the binding energies. We found that studying the correlations between binding energies and simulated ice abundances served as an excellent tool to scrutinize the reaction network. As a result we obtained more information on the reaction network than actually constraining certain binding energies. One reason for this could be the low temperature of 10 K applied in the simulations. At these temperatures, most species are stationary for their full range of binding energies. Hot core or disk models that probe a larger spread in temperature might be more suited for this purpose. However, analyzing the data of a simple dark cloud to really understand the dependencies is already very complex and hence serves as a good starting point for similar studies of more complex astrophysical environments and we leave this to future work. Finally, we want to stress that only the binding energies were varied and that all other parameters are held constant. We expect these to have an effect as well, in particular the diffusion-to-desorption ratio. This is also a topic for future study. Moreover, it would be valuable to extend the present work to a more realistic three-phase model, so that the bulk and the grain surface can be treated separately. Such a model has be shown to capture some of the complexity that arises for the desorption of mixtures of light species such as CO, which exhibits multiple desorption peaks (Fayolle et al., 2011). We arrived at the following set of conclusions and recommendations.
-
1.
For high binding energy of H2, rate equations can result in the unrealistic build up of an H2 ice. Rate equations should be corrected for this, since a high surface abundance of H2 can trigger a different type of surface chemistry.
-
2.
For dark cloud models, the binding energies of C, HCO, HNO, and CH2 are the most determining for the final ice abundances. Since diffusion barriers are inferred from binding energies, these dependencies most likely involve diffusion rates. Obtaining accurate diffusion rates or binding energies for these species would result in a significant improvement in the reliability of grain surface models.
-
3.
HNO is actively involved in the production of OH. Hydrogenation reactions of HNO should be included in the network, in accordance with laboratory results, to prevent overproduction of OH.
-
4.
The branching ratios of reaction products resulting from hydrogenation of H2CO were found to play a crucial role in determining the timescale for COMs formation as well as their formation routes. We believe that with the network used here reactions forming complex molecules involving HCO are too efficient. We encourage experimentalists to work towards extracting branching ratio information from laboratory data: his work highlights the importance of accurate branching ratios for the outcome of g ain-surface models. Since numerous other reactions in the grain surface network have several reaction channels, we recommend modelers on the other hand to carefully scrutinize the branching ratios they use as these ratios can have strong effects.
-
5.
COMs play a crucial role as intermediates for formaldehyde and methanol and are not only the final product in the reaction network. COMs are thus mainly formed through reactions with HCO, the abundance of which highly depends on the H + H2CO branching ratio, and subsequently destroyed by abstraction reactions with atomic H.
References
- Acharyya (2014) Acharyya, K. 2014, MNRAS, 443, 1301
- Acharyya et al. (2007) Acharyya, K., Fuchs, G. W., Fraser, H. J., van Dishoeck, E. F., & Linnartz, H. 2007, A&A, 466, 1005
- Aikawa et al. (1996) Aikawa, Y., Miyama, S. M., Nakano, T., & Umebayashi, T. 1996, ApJ, 467, 684
- Al-Halabi & van Dishoeck (2007) Al-Halabi, A., & van Dishoeck, E. F. 2007, MNRAS, 382, 1648
- Allen & Robinson (1977) Allen, M., & Robinson, G. W. 1977, ApJ, 212, 396
- Boogert et al. (2015) Boogert, A. A., Gerakines, P. A., & Whittet, D. C. 2015, Annual Review Astronomy and Astrophysics, 53, 541
- Brown & Bolina (2007) Brown, W. A., & Bolina, A. S. 2007, MNRAS, 374, 1006
- Charnley (1997) Charnley, S. B. 1997, MNRAS, 291, 455
- Chuang et al. (2016) Chuang, K. J., Fedoseev, G., Ioppolo, S., van Dishoeck, E. F., & Linnartz, H. 2016, MNRAS, 455, 1702
- Collings et al. (2004) Collings, M. P., Anderson, M. A., Chen, R., et al. 2004, MNRAS, 354, 1133
- Collings et al. (2003) Collings, M. P., Dever, J. W., Fraser, H. J., & McCoustra, M. R. S. 2003, Ap&SS, 285, 633
- Collings et al. (2015) Collings, M. P., Frankland, V. L., Lasne, J., et al. 2015, MNRAS, 449, 1826
- Congiu et al. (2012) Congiu, E., Fedoseev, G., Ioppolo, S., et al. 2012, ApJ, 750, L12
- Cuppen et al. (2009) Cuppen, H. M., van Dishoeck, E. F., Herbst, E., & Tielens, A. G. G. M. 2009, A&A, 508, 275
- Cuppen et al. (2017) Cuppen, H. M., Walsh, C., Lamberts, T., et al. 2017, Space Sci. Rev., doi:10.1007/s11214-016-0319-3
- Drozdovskaya et al. (2014) Drozdovskaya, M. N., Walsh, C., Visser, R., Harsono, D., & van Dishoeck, E. F. 2014, MNRAS, 445, 913
- Drozdovskaya et al. (2015) —. 2015, Mon. Not. R. Astron. Soc., 451, 3836
- Dulieu et al. (2013) Dulieu, F., Congiu, E., Noble, J., et al. 2013, Sci. Reports, 3, 1338
- Fayolle et al. (2011) Fayolle, E. C., Öberg, K. I., Cuppen, H. M., Visser, R., & Linnartz, H. 2011, A&A, 529, A74
- Fedoseev et al. (2012) Fedoseev, G., Ioppolo, S., Lamberts, T., et al. 2012, J. Chem. Phys., 137, 054714
- Fraser et al. (2001) Fraser, H. J., Collings, M. P., McCoustra, M. R. S., & Williams, D. A. 2001, MNRAS, 327, 1165
- Fuchs et al. (2006) Fuchs, G. W., Acharyya, K., Bisschop, S. E., et al. 2006, Faraday Disc., 133, 331
- Garrod & Herbst (2006) Garrod, R. T., & Herbst, E. 2006, A&A, 457, 927
- Garrod et al. (2009) Garrod, R. T., Vasyunin, A. I., Semenov, D. A., Wiebe, D. S., & Henning, T. 2009, ApJ, 700, L43
- Garrod et al. (2008) Garrod, R. T., Weaver, S. L. W., & Herbst, E. 2008, ApJ, 682, 283
- Graedel et al. (1982) Graedel, T. E., Langer, W. D., & Frerking, M. A. 1982, ApJS, 48, 321
- Green et al. (2009) Green, S. D., Bolina, A. S., Chen, R., et al. 2009, MNRAS, 398, 357
- Hasegawa & Herbst (1993a) Hasegawa, T. I., & Herbst, E. 1993a, MNRAS, 261, 83
- Hasegawa & Herbst (1993b) —. 1993b, MNRAS, 263, 589
- Hasegawa et al. (1992) Hasegawa, T. I., Herbst, E., & Leung, C. M. 1992, ApJS, 82, 167
- He et al. (2014) He, J., Jing, D., & Vidali, G. 2014, PCCP, 16, 3493
- He & Vidali (2014) He, J., & Vidali, G. 2014, ApJ, 788, 50
- Hincelin et al. (2015) Hincelin, U., Chang, Q., & Herbst, E. 2015, A&A, 574, A24
- Indriolo et al. (2015) Indriolo, N., Neufeld, D. A., Gerin, M., et al. 2015, ApJ, 800, 40
- Karssemeijer & Cuppen (2014) Karssemeijer, L. J., & Cuppen, H. M. 2014, A&A, 569, A107
- McElroy et al. (2013) McElroy, D., Walsh, C., Markwick, A. J., et al. 2013, A&A, 550, A36
- Noble et al. (2012a) Noble, J. A., Congiu, E., Dulieu, F., & Fraser, H. J. 2012a, MNRAS, 421, 768
- Noble et al. (2012b) Noble, J. A., Theulé, P., Mispelaer, F., et al. 2012b, A&A, 543, A5
- Öberg et al. (2005) Öberg, K. I., van Broekhuizen, F., Fraser, H. J., et al. 2005, ApJ, 621, L33
- Ruffle & Herbst (2000) Ruffle, D. P., & Herbst, E. 2000, MNRAS, 319, 837
- Sandford & Allamandola (1988) Sandford, S. A., & Allamandola, L. J. 1988, Icarus, 76, 201
- Sandford et al. (1988) Sandford, S. A., Allamandola, L. J., Tielens, A. G. G. M., & Valero, G. J. 1988, ApJ, 329, 498
- Smith et al. (2016) Smith, R. S., May, R. A., & Kay, B. D. 2016, J. Phys. Chem. B, 120, 1979
- Tielens & Allamandola (1987) Tielens, A. G. G. M., & Allamandola, L. J. 1987, in Astrophysics and Space Science Library, Vol. 134, Interstellar Processes, ed. D. J. Hollenbach & H. A. Thronson, Jr., 397–469
- Tielens & Hagen (1982) Tielens, A. G. G. M., & Hagen, W. 1982, A&A, 114, 245
- Wakelam et al. (2010) Wakelam, V., Herbst, E., Le Bourlot, J., et al. 2010, A&A, 517, A21
- Wakelam et al. (2006) Wakelam, V., Herbst, E., Selsis, F., & Massacrier, G. 2006, A&A, 459, 813
- Walsh et al. (2015) Walsh, C., Nomura, H., & van Dishoeck, E. 2015, A&A, 582, A88
Rate equations do not have any positional information of the species. Species in the top layer are, in principal, treated in the same way as in the bulk of the ice. This results in too many species that actively participate in surface reactions and in the wrong desorption order. The current rate equation models applies a fix to artificially account for this, as explained in Cuppen et al. (2017). In this treatment, surface reactions do not depend on the number of reactants on the grain ( for reaction A+B C) but on the number of reactants in the active layer of size ( with ). Hence, a homogeneous distribution of all species is assumed throughout the grain mantle. If the total number of species on the grain is less than , the original expression with is is used.
Molecular hydrogen is assumed to reside exclusively on top of the grain mantle. It should hence be limited to . We follow mechanism of Hincelin et al. (2015) to account for desorption of any additional H2. H2 molecules that diffuse on top of an H2 molecule in a layer below is assumed to desorb. Because of the fix we apply for surface reactions the additional term in the rate equation deviates from the original expression in Hincelin et al. (2015)
| (1) |
where
| (2) |
and . Choosing , results in a maximum coverage of for H2.