Resolution of the apparent discrepancy between the number of massive subhaloes in Abell 2744 and CDM
Abstract
Schwinn et al. (2017) have recently compared the abundance and distribution of massive substructures identified in a gravitational lensing analysis of Abell 2744 by Jauzac et al. (2016) and N-body simulation and found no cluster in CDM simulation that is similar to Abell 2744. Schwinn et al. (2017) identified the measured projected aperture masses with the actual masses associated with subhaloes in the MXXL N-body simulation. We have used the high resolution Phoenix cluster simulations to show that such an identification is incorrect: the aperture mass is dominated by mass in the body of the cluster that happens to be projected along the line-of-sight to the subhalo. This enhancement varies from factors of a few to factors of more than 100, particularly for subhaloes projected near the centre of the cluster. We calculate aperture masses for subhaloes in our simulation and compare them to the measurements for Abell 2744. We find that the data for Abell 2744 are in excellent agreement with the matched predictions from CDM. We provide further predictions for aperture mass functions of subhaloes in idealized surveys with varying mass detection thresholds.
keywords:
cold dark matter – gravitational lens – cluster - substructure1 Introduction
The existence of a very large number of dark matter haloes and subhaloes is a fundamental prediction of the CDM cosmology. The halo and subhalo mass functions can be accurately calculated from N-body simulations (e.g. Frenk et al., 1988; Jenkins et al., 2001; Gao et al., 2004, 2011, 2012; Springel et al., 2008). These functions are characteristic of CDM and can differ in models with different types of dark matter such as warm or self-interacting dark matter (Hellwing et al., 2016; Bose et al., 2016; Vogelsberger et al., 2012).
The abundance of haloes and subhaloes, their mass, and their spatial distribution can, in principle, be measured from their weak gravitational lensing effects (e.g. Yang et al., 2006; Natarajan et al., 2007; Natarajan et al., 2009; Limousin et al., 2007; Okabe et al., 2014; Li et al., 2013; Li et al., 2016a, b). Strong lensing may be used to measure the small mass end of the mass function (Vegetti & Koopmans, 2009), and this provides a promising test to differentiate between, for example, cold and warm dark matter (e.g. Li et al., 2016b; Li et al., 2017). The combination of strong and weak lensing may be used to measure the mass function on larger mass scales. Using this approach Jauzac et al. (2015, 2016) have reconstructed the total projected mass distribution of Abell 2744, one of the most massive galaxy clusters known (which lies at ). Their technique is particularly sensitive to density variations in the outer parts of the cluster and thus is ideal for identifying subhaloes in these regions and estimating their mass quite accurately.
Jauzac et al. (2016) identified seven massive subhaloes (or eight if the main core is included) within a radius of around the centre of Abell 2744; they estimated their enclosed mass within an aperture of to be greater than in all cases. Schwinn et al. (2017) claimed that this result is inconsistent with the abundance and distribution of cluster subhaloes in the Millennium XXL simulation (MXXL; Angulo et al., 2012) and that a more careful comparison should be performed. They considered subhaloes previously identified in a sample of clusters in the simulation and, assuming that they have NFW density profiles (Navarro et al., 1996), they estimated their mass by integrating the density profile within a cylindrical volume of radius and length , finding a maximum of three subhaloes with mass located within of the centre. They attempted to account for possible effects, such as projection along the line-of-sight or changes in the assumed subhalo density profiles induced by baryons but found these to be unimportant and concluded that the number of observed massive subhaloes in Abell 2744 is in conflict with the predictions of CDM.
To try and explain the discrepancy, Lee (2017) hypothesized that Abell 2744 may be embedded within a filamentary supercluster aligned with the line-of-sight. Natarajan et al. (2017) compared the subhalo mass function of galaxy members in Abell 2744 with the results for clusters in a hydrodynamical simulation (Vogelsberger et al., 2014), finding no discrepancy between observations and the simulation. The discrepancy, however, does not appear to be exclusive to Abell 2744. Chirivì et al. (2017) found a similar mismatch with N-body simulations in the MACS J0416.1-2403 cluster and, like Schwinn et al. (2017), found that projection effects cannot account for the discrepancy.
In this paper we show that the discrepancy between Abell 2744 and the CDM simulation reported by Schwinn et al. (2017) is simply due to an inconsistency in their comparison with the MXXL simulation, specifically an inconsistency between the masses they infer for the subhaloes and the masses assigned to subhaloes in the simulation. We mimic the procedure of deriving an aperture mass that was applied to the lensing data in the high-resolution Phoenix (Gao et al., 2012) and Indra (Falck et al., in prep.) N-body simulations and find that the discrepancy with Abell 2744 is removed.
2 Simulations
The N-body simulations used in this study are the Indra suite of large cosmological simulations (Falck et al., in prep.) and the Phoenix set of very high resolution simulations of individual rich clusters (Gao et al., 2012).
Indra consists of 512 N-body simulations, each with dark matter particles in a periodic cube 1 on a side. The cosmological parameters are taken to be: , , , , , and . Indra includes a very large volume and thus produces a large sample of clusters like Abell 2744, but the resolution, , is too low to resolve subhaloes like those in Abell 2744. We use these simulations to compare aperture against total masses for clusters analogous to Abell 2744.
Phoenix consists of very high resolution resimulations of nine clusters and their surroundings selected from the Millennium simulation (Springel et al., 2005). The Millennium simulation assumes cosmological parameters consistent with the first year WMAP data, , , , and . These values deviate from the latest Planck results but this small offset is of no consequence for the topic of this study. The most massive of the nine Phoenix clusters, ‘Ph-I’, has a virial mass of , close to that of Abell 2744 (see Section 3), and we choose this halo at for detailed comparison with Abell 2744. We identify subhaloes in Ph-I using the SUBFIND algorithm of Springel et al. (2001). To test numerical convergence, the Phoenix clusters were re-simulated at various resolutions. In this study we have analyzed the ‘level-4’ resolution for which the particle mass is ; at this resolution all massive subhaloes are well resolved.
3 Results
3.1 The aperture mass of Abell 2744
Since the subhalo mass function depends on the host halo mass (e.g. Gao et al., 2011), it is important to select simulated clusters of mass similar to that of Abell 2744. There are different ways to define the mass of a halo in a simulation, but in lensing analyses the mass of the lens is usually estimated as the projected mass within a certain circular aperture. For Abell 2744, the aperture has radius .
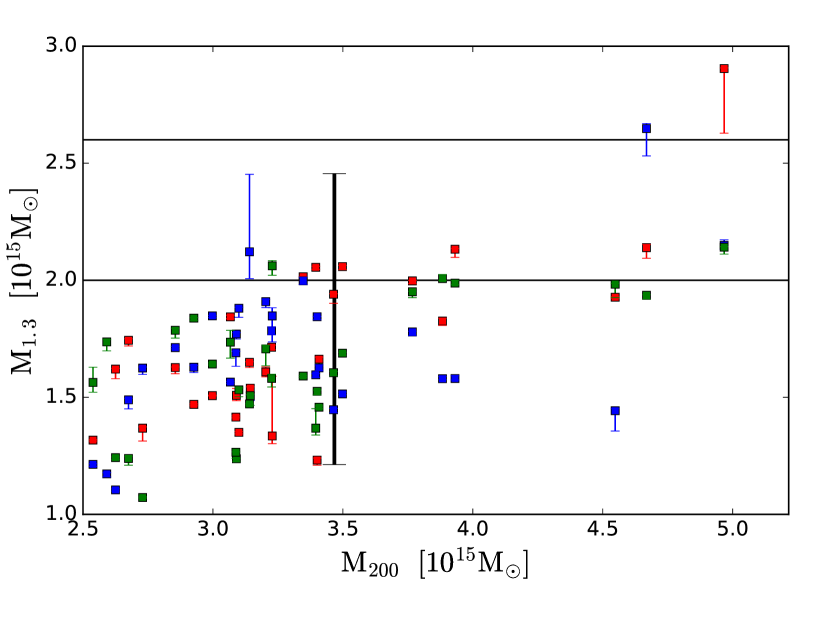
We select all haloes of mass, from 128 realizations of the Indra simulation suite (a volume equivalent to a cube of side ) at . For each halo, we compute an ‘aperture mass’, analogous to that Abell 2744, by projecting the particle distribution along the -, -, and -axis of the simulation, keeping all dark matter particles within of the centre of each cluster. The depth of projection was chosen to be , and . We refer to all these masses collectively as . In Fig. 1 we plot 111 is defined as the mass contained with the radius, , at which the mean interior density is equal to 200 times the critical density. against aperture mass, , for the clusters in our sample. Different colours represent the three different projections; the error bars indicate the scatter in aperture mass due to different projection depths. The projection depth has a negligible effect on the aperture mass except in a few cases where there is contamination by a massive structure along the line-of-sight. The aperture mass is thus essentially insensitive to the assumed projection depth.
The observed range of for Abell 2744 is marked by the two solid horizon lines in Fig. 1. To fall in the allowed region of for Abell 2744, a cluster should have . Only one of the nine Phoenix clusters, Ph-I, has such a large mass; the range of values of for that cluster from 200 random projections is indicated with a black error bar. Only ten percent of these projections fall within the allowed region of for Abell 2744. However, since the amplitude of the subhalo mass function scales approximately linearly with halo mass (Wang et al., 2012), our conclusions from comparing this simulated cluster (the only one available with the required resolution) with Abelll 2744 are conservative.
3.2 Projected massive subhaloes in clusters
We project the particle distribution of Ph-I-4 along 200 random projections, each of depth . The resulting mass maps are not sensitive to the projection depth as long as it is greater than the diameter of the cluster. In of these projections the Ph-I cluster has aperture mass, , within the 3 allowed range for Abell 2744. Hereafter, we refer to these as our Abell 2744 analogues, which use to compare the simulation with the observational data.
In lensing observations, subhalo candidates are identified in the reconstructed mass map. In this paper, we will assume that all subhaloes of mass larger than a threshold, , are detected in the lensing analysis. For each massive subhalo in the simulation we calculate an aperture mass, , analogous to the aperture masses measured in observational analyses (e.g Jauzac et al., 2016) by measuring the mass that falls within a projected radius, . Since close subhalo pairs cannot be distinguished in lensing observations, we merge the density peaks of subhalo pairs of separation less than , which is approximately the shortest pair separation among the massive subhaloes in Abell 2744.
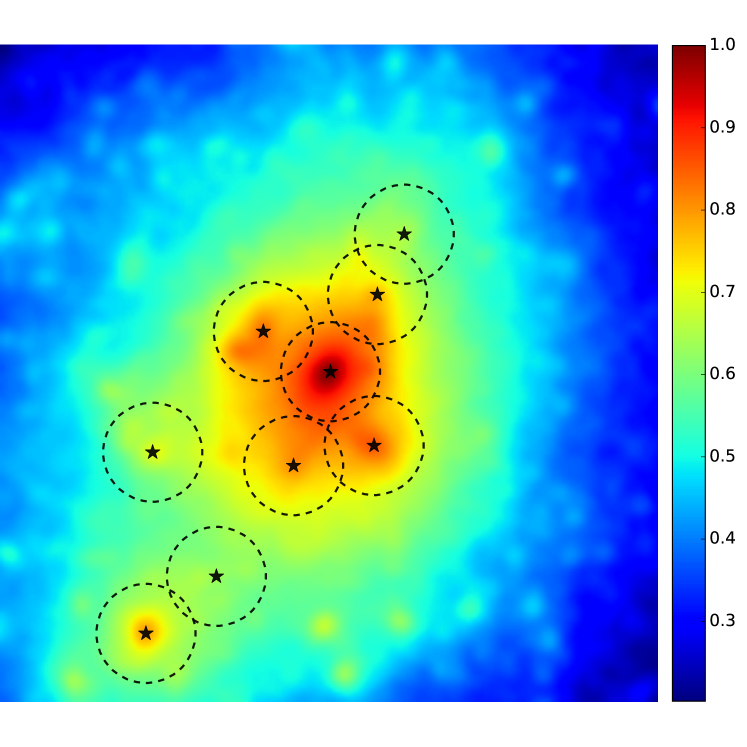
In Fig. 2, we show the mass map of the particular projection that has the most abundant substructures among the 200 projections of Ph-I-4. Setting a subhalo mass detection limit of , we find nine subhaloes (shown as black stars) whose aperture masses are comparable to the aperture masses of the subhaloes in Abell 2744. It is clear that some of these apparently massive subhaloes in projections are actually associated with rather puny subhaloes such as one of the pair in the bottom left of the image or the one slightly above that on the right.
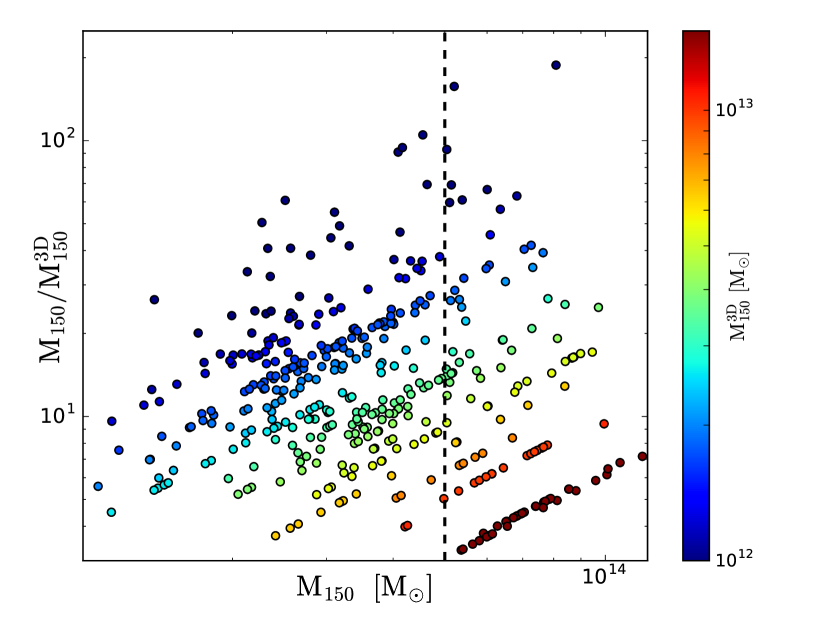
In Fig. 3 we show the relation between the aperture mass, , measured from different directions, and the mass ‘boost factor’, , where is the true mass of the subhalo contained within a sphere of radius around the subhalo centre identified with SUBFIND. Clearly, the aperture mass, of a subhalo can be very different from its real mass, . This is because aperture masses can be greatly boosted by mass in the body of the halo which happens to fall within the projection. This can increase the projected mass by factors varying from a few to about 100. Thus, even intrinsically small subhaloes can appear to be very massive as judged by their aperture mass, particularly if they happen to be projected close to the host halo centre.
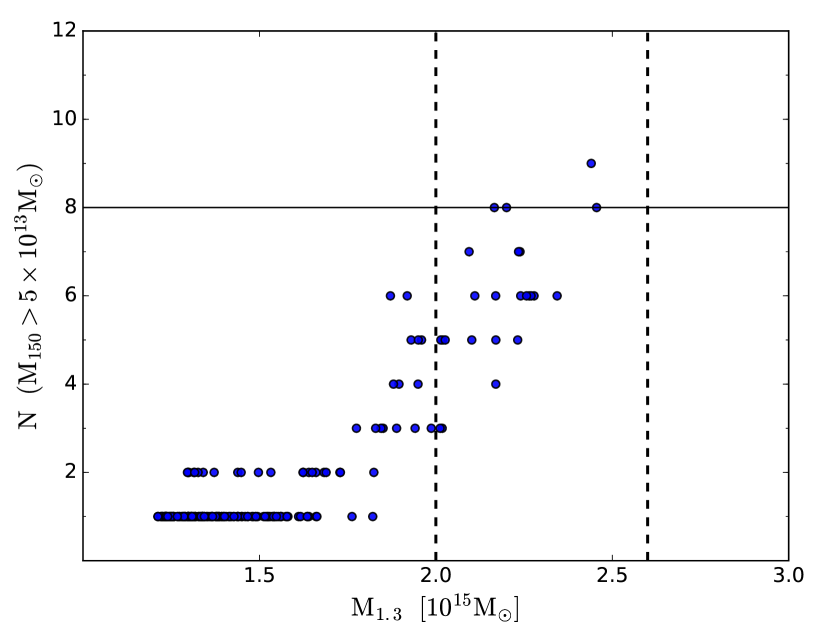
In Fig. 4 we show the number of projected subhaloes of aperture mass, , in our 200 projections of Ph-I-4, assuming a projected mass detection limit of . Clearly, the number correlates strongly with the projected aperture mass. This is expected because, as we have just seen, the subhalo aperture mass is dominated by mass in the body of the cluster that is projected along the line-of-sight. Among 24 projections, four have at least eight subhaloes with , as indicated by the horizontal line. We conclude that when the simulations and the data are analyzed in a consistent way, the detection of eight massive subhaloes in Abell 2744 is perfectly consistent with the predictions of CDM.
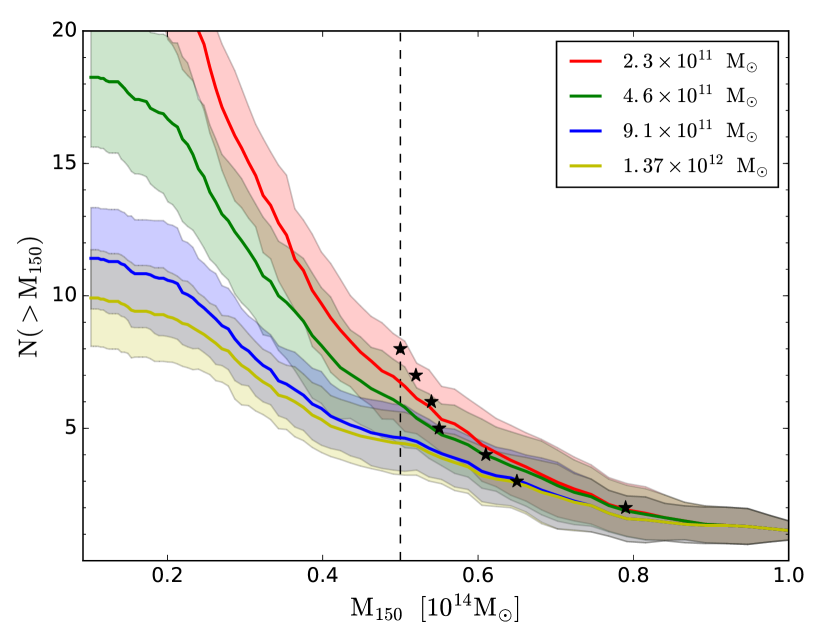
Lowering the detection mass threshold, , rapidly increases the number of massive projected subhaloes. In Fig. 5 we show the predicted aperture mass functions of subhaloes in our 24 Abell 2744 analogues for different values of the threshold. Red, green, blue and yellow lines correspond to threshold values, of 2.3, 4.6, 9.1 and 13.7 , respectively. For the value, , that we have assumed for the lensing analysis of Abell 2744 carried out by Jauzac et al. (2016), the measured aperture mass function (shown as star symbols in the figure) agrees remarkably well with the simulations.
4 Discussion and conclusions
We have made use of cosmological N-body simulations to test whether the identification of eight massive subhaloes by Jauzac et al. (2016) in a gravitational lensing mass reconstruction of Abell 2744 is in conflict with predictions from the CDM cosmological paradigm. Gravitational lensing is sensitive to projected mass; projected masses associated with subhalos are normally measured within a specified aperture. Firstly, using a large-volume, low-resolution suite of simulations we established that the projected aperture mass of Abell 2744 itself corresponds to a minimum true mass of about . One of the clusters from the much higher resolution Phoenix cluster N-body re-simulation project satisfies this mass constraint; we used it to construct a sample of 24 analogues of Abell 2744 by viewing it from different directions.
Projected masses for subhaloes in Abell 2744 are measured within apertures. We calculated equivalent masses for the subhaloes in the simulation by integrating the mass within a cylinder of radius along the line-of-sight to each subhalo. Our main finding is that the measured aperture mass of a subhalo is dominated by mass in the body of the host halo that happens to be projected onto the aperture. This can lead to measured aperture masses that are over 100 times larger than the actual mass associated with the subhalo.
Although our procedure captures the main effect of measuring aperture masses, our comparison with the observations of Abell 2744 is only approximate. In practice, the detectability of subhaloes in gravitational lensing analyses depends not only on their mass, but also on the mass reconstruction method. For example, Merten et al. (2011) also performed a strong plus weak lensing analysis of Abell 2744, using imaging data from HST and Subaru; they were only able to find 4 of the Jauzac et al. (2016) subhaloes. A more realistic comparison with the results of Jauzac et al. (2016) would require a ray-tracing calculation allowing for limitations and complications of the observational data such as resolution, completeness, etc. Such a calculation is beyond the scope of this paper. However, our main result– that projected aperture masses of subhalos in observed rich clusters can be significant overestimates of the true masses of the subhaloes– is general and sufficient to conclude that the number of substructures detected in Abell 2744 by Jauzac et al. (2016) does not pose a crisis for CDM. We have presented simple predictions for the aperture mass function of subhaloes in rich clusters. More detailed theoretical calculations of the kind we have sketched above, tailored to specific lensing surveys, could provide a useful test of CDM.
Acknowledgements
We thank Dandan Xu, Guoliang Li and Simon White for useful discussions. We acknowledges the 973 program grant 2015CB857005, 2017YFB0203300, and NSFC grant No. 11373029, 11390372, 11851301. We acknowledge support from NSFC grants (nos. 11573030, 11133003, 11425312 and 1303033). RL acknowledges NSFC grant (Nos. 11511130054, 11333001), support from the Youth Innovation Promotion Association of CAS and Nebula Talent Program of NAOC and Newton Mobility award. This work was supported by the Science and Technology facilities Council ST/L00075X/1. It used the DiRAC Data Centric system at Durham University, operated by the Institute for Computational Cosmology on behalf of the STFC DiRAC HPC Facility (www.dirac.ac.uk). This equipment was funded by BIS National E-infrastructure capital grant ST/K00042X/1, STFC capital grants ST/H008519/1 and ST/K00087X/1, STFC DiRAC Operations grant ST/K003267/1 and Durham University. DiRAC is part of the National E-Infrastructure.
References
- Angulo et al. (2012) Angulo R. E., Springel V., White S. D. M., Jenkins A., Baugh C. M., Frenk C. S., 2012, MNRAS, 426, 2046
- Bose et al. (2016) Bose S., Hellwing W. A., Frenk C. S., Jenkins A., Lovell M. R., Helly J. C., Li B., 2016, MNRAS, 455, 318
- Chirivì et al. (2017) Chirivì G., Suyu S. H., Grillo C., Halkola A., Balestra I., Caminha G. B., Mercurio A., Rosati P., 2017, preprint, (arXiv:1706.07815)
- Frenk et al. (1988) Frenk C. S., White S. D. M., Davis M., Efstathiou G., 1988, ApJ, 327, 507
- Gao et al. (2004) Gao L., White S. D. M., Jenkins A., Stoehr F., Springel V., 2004, MNRAS, 355, 819
- Gao et al. (2011) Gao L., Frenk C. S., Boylan-Kolchin M., Jenkins A., Springel V., White S. D. M., 2011, MNRAS, 410, 2309
- Gao et al. (2012) Gao L., Navarro J. F., Frenk C. S., Jenkins A., Springel V., White S. D. M., 2012, MNRAS, 425, 2169
- Hellwing et al. (2016) Hellwing W. A., Frenk C. S., Cautun M., Bose S., Helly J., Jenkins A., Sawala T., Cytowski M., 2016, MNRAS, 457, 3492
- Jauzac et al. (2015) Jauzac M., et al., 2015, MNRAS, 446, 4132
- Jauzac et al. (2016) Jauzac M., et al., 2016, MNRAS, 463, 3876
- Jenkins et al. (2001) Jenkins A., Frenk C. S., White S. D. M., Colberg J. M., Cole S., Evrard A. E., Couchman H. M. P., Yoshida N., 2001, MNRAS, 321, 372
- Lee (2017) Lee J., 2017, preprint, (arXiv:1701.04220)
- Li et al. (2013) Li R., Mo H. J., Fan Z., Yang X., Bosch F. C. v. d., 2013, MNRAS, 430, 3359
- Li et al. (2016a) Li R., et al., 2016a, MNRAS, 458, 2573
- Li et al. (2016b) Li R., Frenk C. S., Cole S., Gao L., Bose S., Hellwing W. A., 2016b, MNRAS, 460, 363
- Li et al. (2017) Li R., Frenk C. S., Cole S., Wang Q., Gao L., 2017, MNRAS, 468, 1426
- Limousin et al. (2007) Limousin M., Kneib J. P., Bardeau S., Natarajan P., Czoske O., Smail I., Ebeling H., Smith G. P., 2007, A&A, 461, 881
- Merten et al. (2011) Merten J., et al., 2011, MNRAS, 417, 333
- Natarajan et al. (2007) Natarajan P., De Lucia G., Springel V., 2007, MNRAS, 376, 180
- Natarajan et al. (2009) Natarajan P., Kneib J.-P., Smail I., Treu T., Ellis R., Moran S., Limousin M., Czoske O., 2009, ApJ, 693, 970
- Natarajan et al. (2017) Natarajan P., et al., 2017, MNRAS, 468, 1962
- Navarro et al. (1996) Navarro J. F., Frenk C. S., White S. D. M., 1996, ApJ, 462, 563
- Okabe et al. (2014) Okabe N., Futamase T., Kajisawa M., Kuroshima R., 2014, ApJ, 784, 90
- Schwinn et al. (2017) Schwinn J., Jauzac M., Baugh C. M., Bartelmann M., Eckert D., Harvey D., Natarajan P., Massey R., 2017, MNRAS, 467, 2913
- Springel et al. (2001) Springel V., White S. D. M., Tormen G., Kauffmann G., 2001, MNRAS, 328, 726
- Springel et al. (2005) Springel V., et al., 2005, Nature, 435, 629
- Springel et al. (2008) Springel V., et al., 2008, MNRAS, 391, 1685
- Vegetti & Koopmans (2009) Vegetti S., Koopmans L. V. E., 2009, MNRAS, 392, 945
- Vogelsberger et al. (2012) Vogelsberger M., Zavala J., Loeb A., 2012, MNRAS, 423, 3740
- Vogelsberger et al. (2014) Vogelsberger M., et al., 2014, MNRAS, 444, 1518
- Wang et al. (2012) Wang J., Frenk C. S., Navarro J. F., Gao L., Sawala T., 2012, MNRAS, 424, 2715
- Yang et al. (2006) Yang X., Mo H. J., van den Bosch F. C., Jing Y. P., Weinmann S. M., Meneghetti M., 2006, MNRAS, 373, 1159