HESS J0632057: hydrodynamics and nonthermal emission
Abstract
HESS J0632057 is an eccentric gamma-ray Be binary that produces non-thermal radio, X-rays, GeV, and very high-energy gamma rays. The non-thermal emission of HESS J0632057 is modulated with the orbital period, with a dominant maximum before apastron passage. The nature of the compact object in HESS J0632057 is not known, although it has been proposed to be a young pulsar as in PSR B1259–63, the only gamma-ray emitting high-mass binary known to host a non-accreting pulsar. In this Letter, we present hydrodynamical simulations of HESS J0632057 in the context of a pulsar and a stellar wind interacting in an eccentric binary, and propose a scenario for the non-thermal phenomenology of the source. In this scenario, the non-thermal activity before and around apastron is linked to the accumulation of non-thermal particles in the vicinity of the binary, and the sudden drop of the emission before apastron is produced by the disruption of the two-wind interaction structure, allowing these particles to efficiently escape. In addition to providing a framework to explain the non-thermal phenomenology of the source, this scenario predicts extended, moving X-ray emitting structures similar to those observed in PSR B1259–63.
keywords:
Hydrodynamics – X-rays: binaries – Stars: winds, outflows – Radiation mechanisms: nonthermal – Gamma rays: stars1 Introduction
The very high-energy (VHE) point-like source HESS J0632057, detected in Monoceros by HESS (Aharonian et al., 2007), was proposed by Hinton et al. (2009) to be the fourth gamma-ray binary known after PSR B1259–63, LS 5039 and LS I +61 303 (Aharonian et al., 2005a; Tavani et al., 1998; Paredes et al., 2000; Aharonian et al., 2005b; Albert et al., 2006). The binary nature of HESS J0632057 was confirmed in X-rays when the orbital period was established in days (Bongiorno et al., 2011)111Note that a days, consistent with days, was obtained by Aliu et al. (2014) using more X-ray data., and Casares et al. (2012) further characterized the system, which consists of a Be star and a compact object of unknown nature, is highly eccentric, , and has an orbital semi-major axis of cm.
The X-ray and the VHE lightcurves of HESS J0632057 are quite similar. They show a broad maximum, around orbital phases , between periastron () and apastron passages. Then, both the X-ray and the VHE emission fall sharply right before apastron, around , and around the X-ray and VHE emission present a secondary, less prominent maximum (e.g. Aliu et al., 2014). Emission in GeV has been detected as well, which despite the low statistics is consistent with having a peak before apastron (Li et al., 2017). On the other hand, radio VLBI observations at 1.6 GHz, probing spatial scales cm, found a flux decrease around (Moldón et al., 2011), and a shift in position by 14 milliarcseconds (mas), or AU in projected size at kpc distance. The shift was found between two runs 30 days apart, implying a velocity of cm s-1. In the second run, a radio component appeared showing extension on scales of mas in the opposite direction to that of the position shift.
The system parameters and the non-thermal emission of HESS J0632057 are similar to those of the gamma-ray binary PSR B1259–63 (see Dubus, 2013, and references therein), which may suggest the same nature of the compact object in both sources, a young pulsar non-accreting for most of its orbit (see, however, Zamanov et al., 2017). In this case one expects a complex physical evolution of the pulsar and the stellar winds as they interact along the very eccentric orbit. Such a complexity is clearly seen for instance in the hydrodynamical simulations done by Barkov & Bosch-Ramon (2016) of the two-wind interaction for PSR B1259–63, which provided a framework to explain the moving extended X-ray structures on arcsecond scales found by Kargaltsev et al. (2014); Pavlov et al. (2015).
Motivated by the results of Barkov & Bosch-Ramon (2016) on PSR B1259–63, and aiming at a deeper exploration of HESS J0632057, we have carried out relativistic hydrodynamical simulations of the pulsar-stellar wind interaction in HESS J0632057 on scales accounting for orbital motion (Sect. 2). Using the simulation results, we have developed a specific scenario that explains most of the phenomenology of the non-thermal emission of HESS J0632057 along the orbit, and also predicts transient X-ray emission on arcsecond scales (Sect. 3).
2 Simulations of the two-wind collision in HESS J0632057
The relativistic hydrodynamical simulations were done with the PLUTO code222Link http://plutocode.ph.unito.it/index.html (Mignone et al., 2007) using a simplified three dimensional (3D) geometry in spherical coordinates. PLUTO is a modular Godunov-type code intended mainly for astrophysical applications in multiple spatial dimensions and flows of high Mach numbers. A 3rd order Runge-Kutta approximation in time, spatial parabolic interpolation, and an HLLC Riemann solver, were used (Mignone & Bodo, 2005). The simulations were run through the MPI library in the CFCA cluster of the National Astronomical Observatory of Japan and Greate Wave FX100 Fujitsu cluster in RIKEN (Japan).

The simulation setup is similar to the one adopted in Barkov & Bosch-Ramon (2016) for PSR B1259–63, as it allows one to capture the main physical features of the problem on scales in a reasonable computation timescale. For the case of HESS J0632057 considered here, the computational domain has a size of , , and , and a resolution of . The stellar and the pulsar winds have spherical symmetry and are injected at the inner boundary (). The remaining boundaries have outflow conditions. The pulsar wind is injected in a sector on the orbital plane with a half-opening angle of 0.84 rad, which corresponds to a pulsar-to-stellar wind thrust ratio of , and the stellar wind is injected in the remaining -interval. We use an ideal equation of state with politropic index . The injection densities of the stellar and the pulsar winds were choosen so to reproduce pulsar-to-stellar wind thrust ratio of ; the Mach numbers of the pulsar and stellar winds at injection are 26 and 7; and the stellar wind speed and the pulsar wind Lorentz factor are fixed to c and , respectively (see, e.g., Bosch-Ramon et al., 2012, 2015, regarding the validity of moderate Lorentz factors). The orientation of the pulsar-wind injection sector rotates with time reproducing the orbital motion of days accounting for the eccentricity of the system (), and taking the masses of the Be star and the pulsar equal to be and , respectively (yielding cm). In the simulations, the periastron and apastron pulsar locations are to the right and to the left from the point , respectively. As noted in Barkov & Bosch-Ramon (2016), the mass of the Be disc is likely much smaller than that injected by the spherical stellar wind and is thus neglected in this study. The disc could however add some extra mass to the shocked winds around periastron passage, which deserves a devoted study. The simulations are run for a time (1013 days) to eliminate the effects of the initial conditions on the results.
2.1 Simulation Results
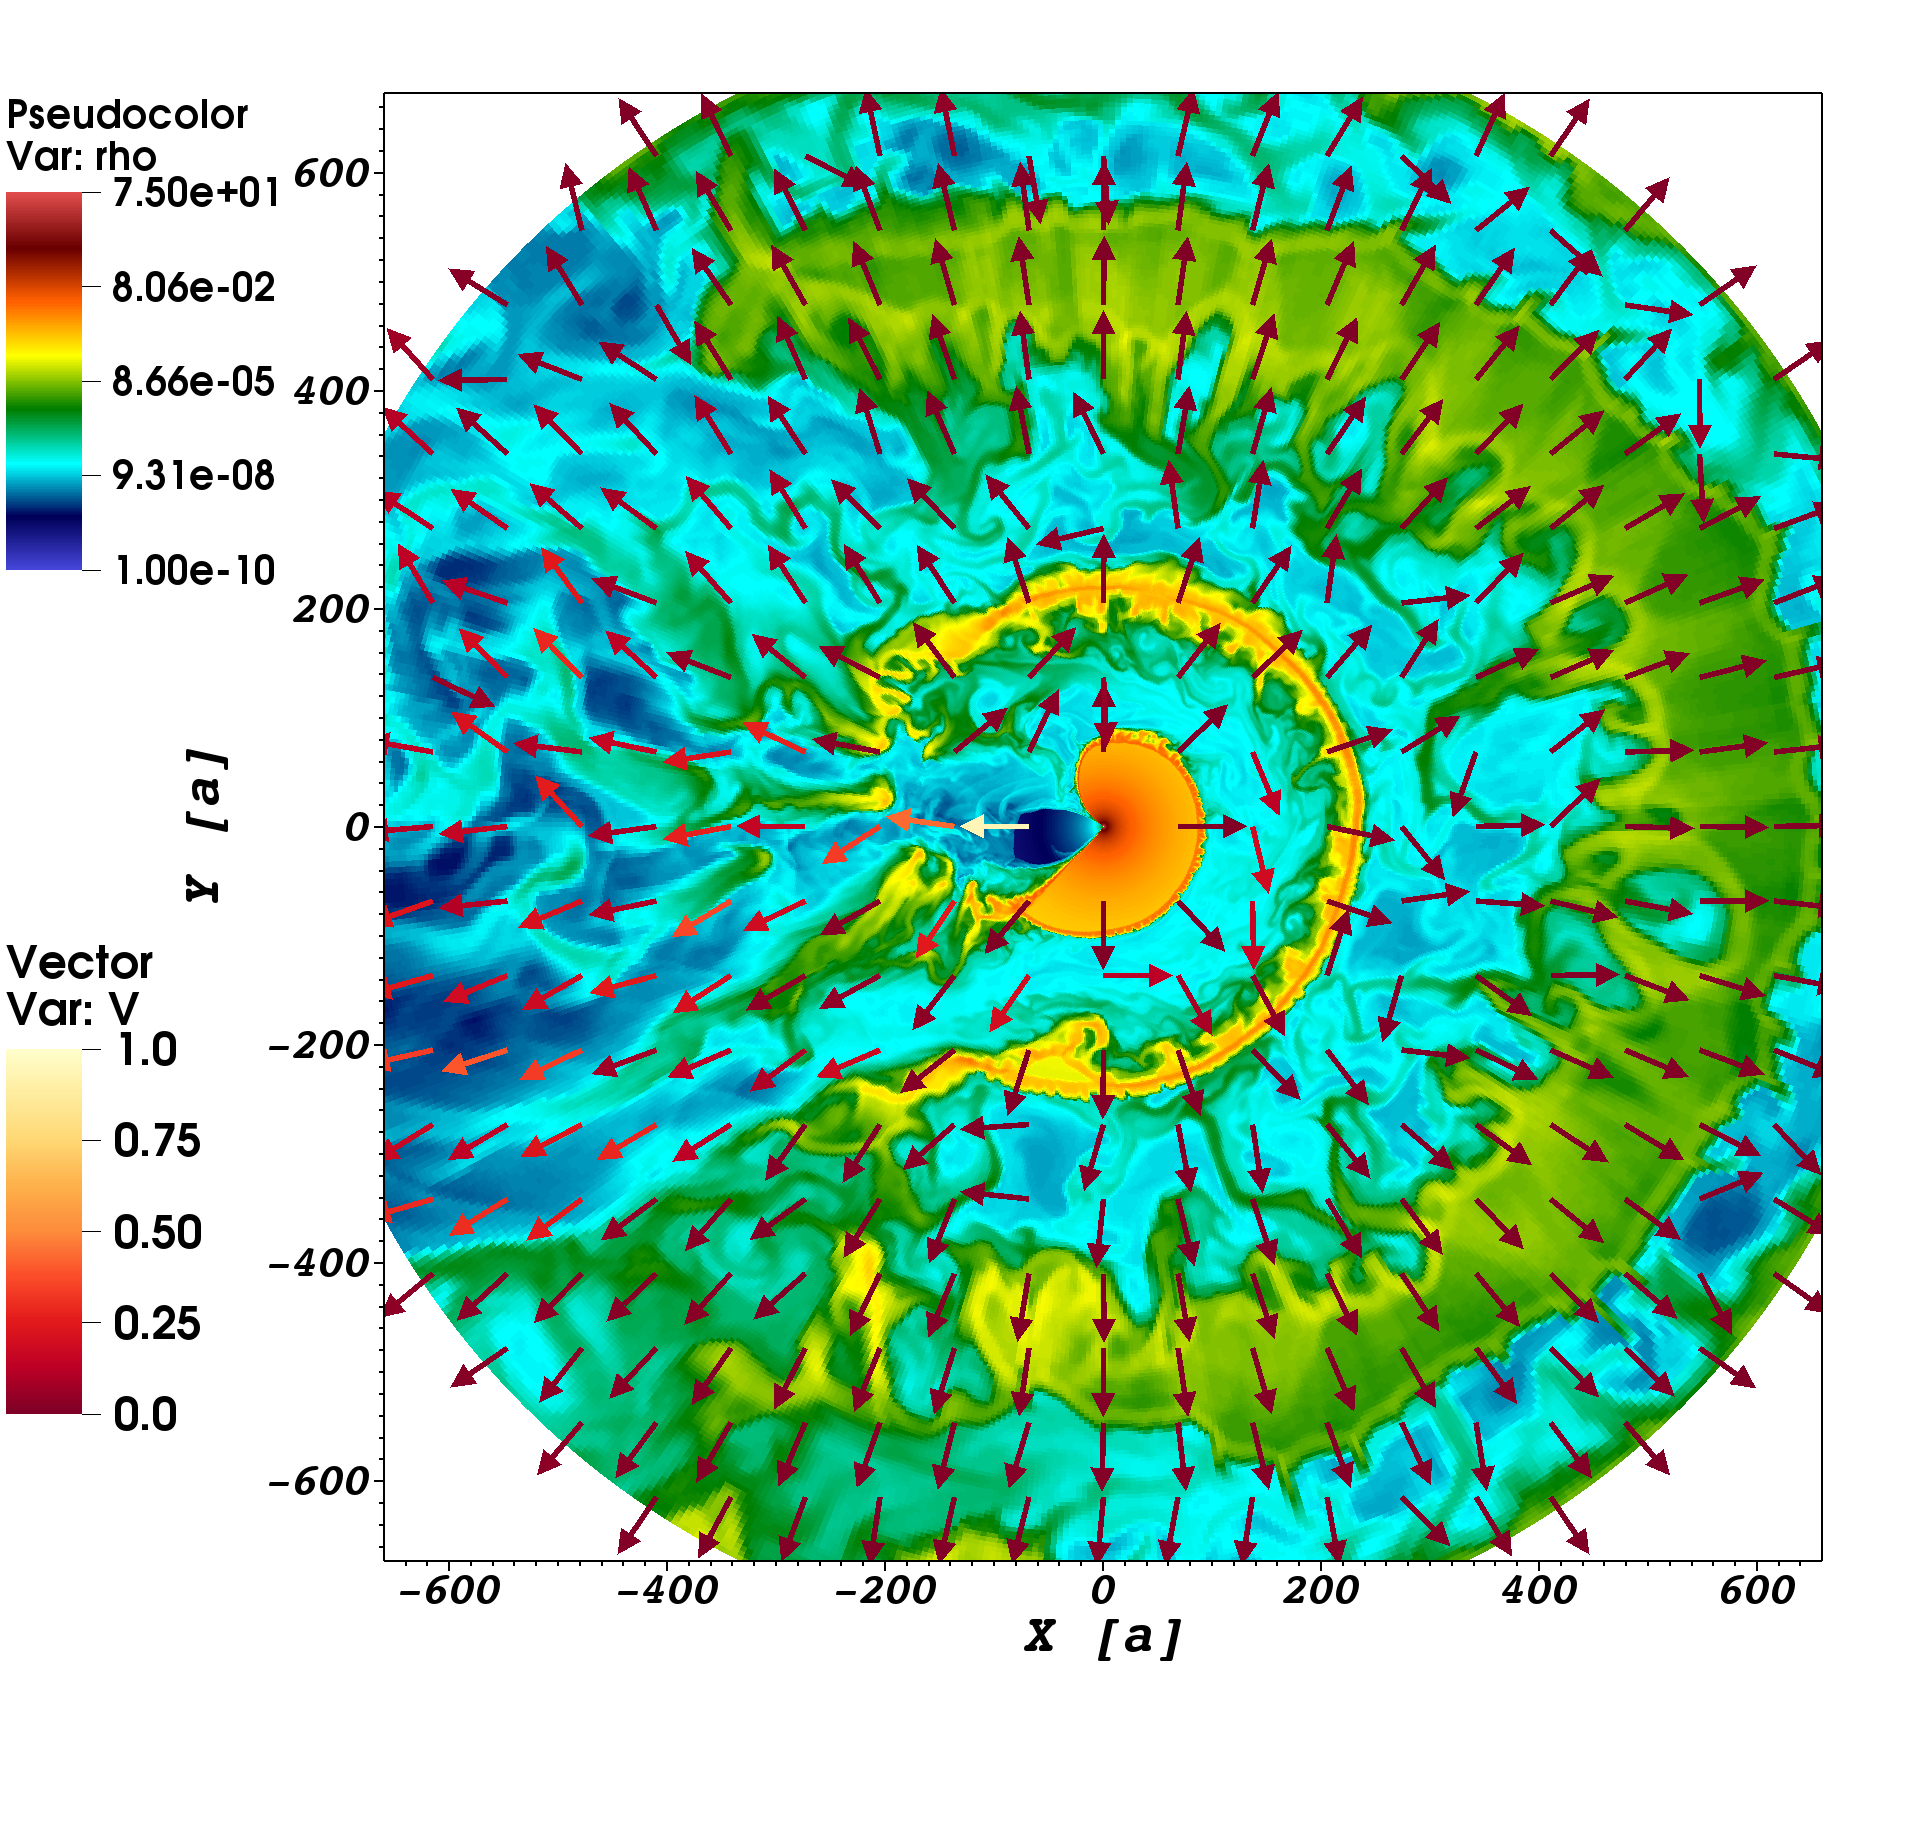
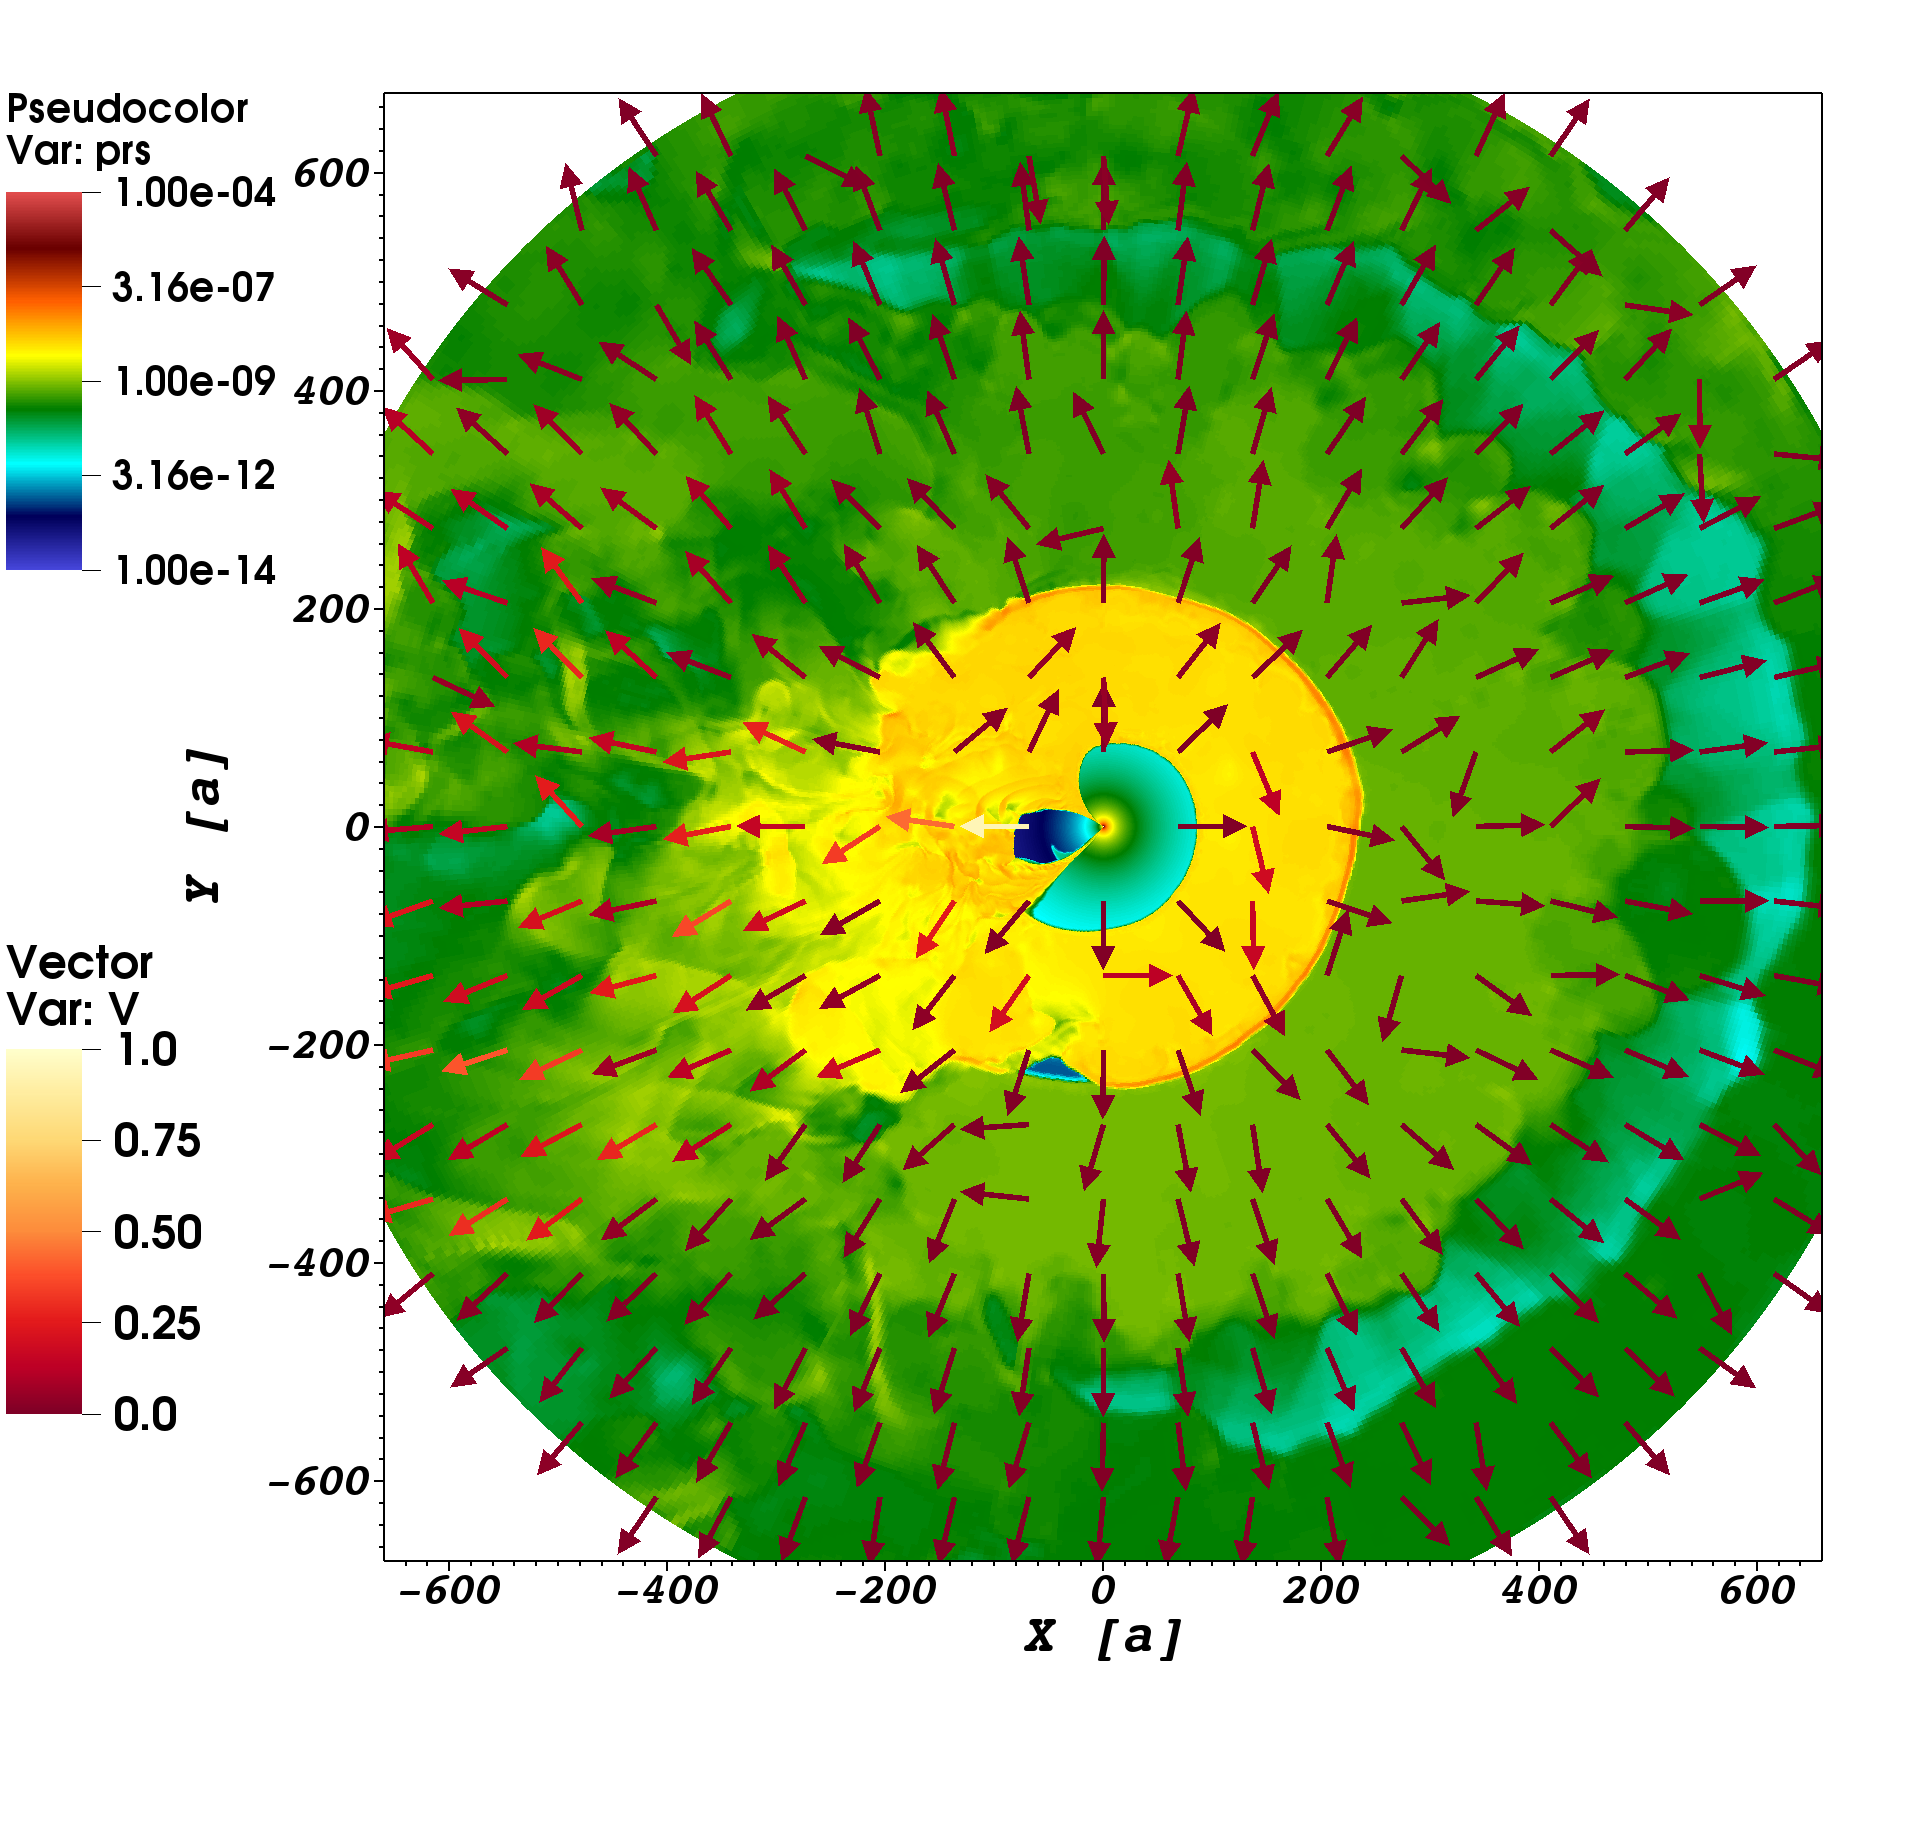
In Fig. 1 we plot the maps of density (top) and pressure (bottom) on the orbital plane, with colored arrows indicating the flow direction and three-velocity modulus.
The three low density (blue) semi-rings to the right (periastron direction) of the density map in Fig. 1, top panel, consist of shocked pulsar wind, and indicate that the pulsar has gone already through three orbits at days (). Intercalated with these semi-rings, there are larger density (green/yellow) semi-rings that consist of shocked stellar wind. This stellar wind was injected rightwards when the pulsar was far from periastron, and the interacting two-wind structure on the binary scales (i.e. the pulsar wind injector and its boundary region with the stellar wind) was directed leftwards (apastron direction). Because of the system high eccentricity, the amount of stellar (pulsar) wind injected in the apastron direction is much less (more) than in the periastron direction because of the very long time spent by the pulsar far from periastron. This leads to the fast disruption () of the shocked stellar wind semi-ring in the apastron direction produced by the impact of the pulsar wind.
The pressure map presented in Fig. 1, bottom panel, shows clearly separated pressure regions: (i) the high-pressure, inner-most yellow region, i.e. within the first turn of the spiral-like structure formed by the shocked winds, which is filled by the energy of the pulsar wind injected during the transit from periastron to apastron; and (ii) the lower-pressure, green region, outside the first turn of the spiral, where a negative, smooth pressure gradient leads to gradual shocked flow acceleration. The outflow in the apastron direction, mostly supersonic, is splattered by shocks, whereas in the periastron direction, the flow intercalates regions of subsonic shocked pulsar wind and shocked (but supersonic) stellar wind333The flows are sub- or supersonic with respect to their own sound speed..
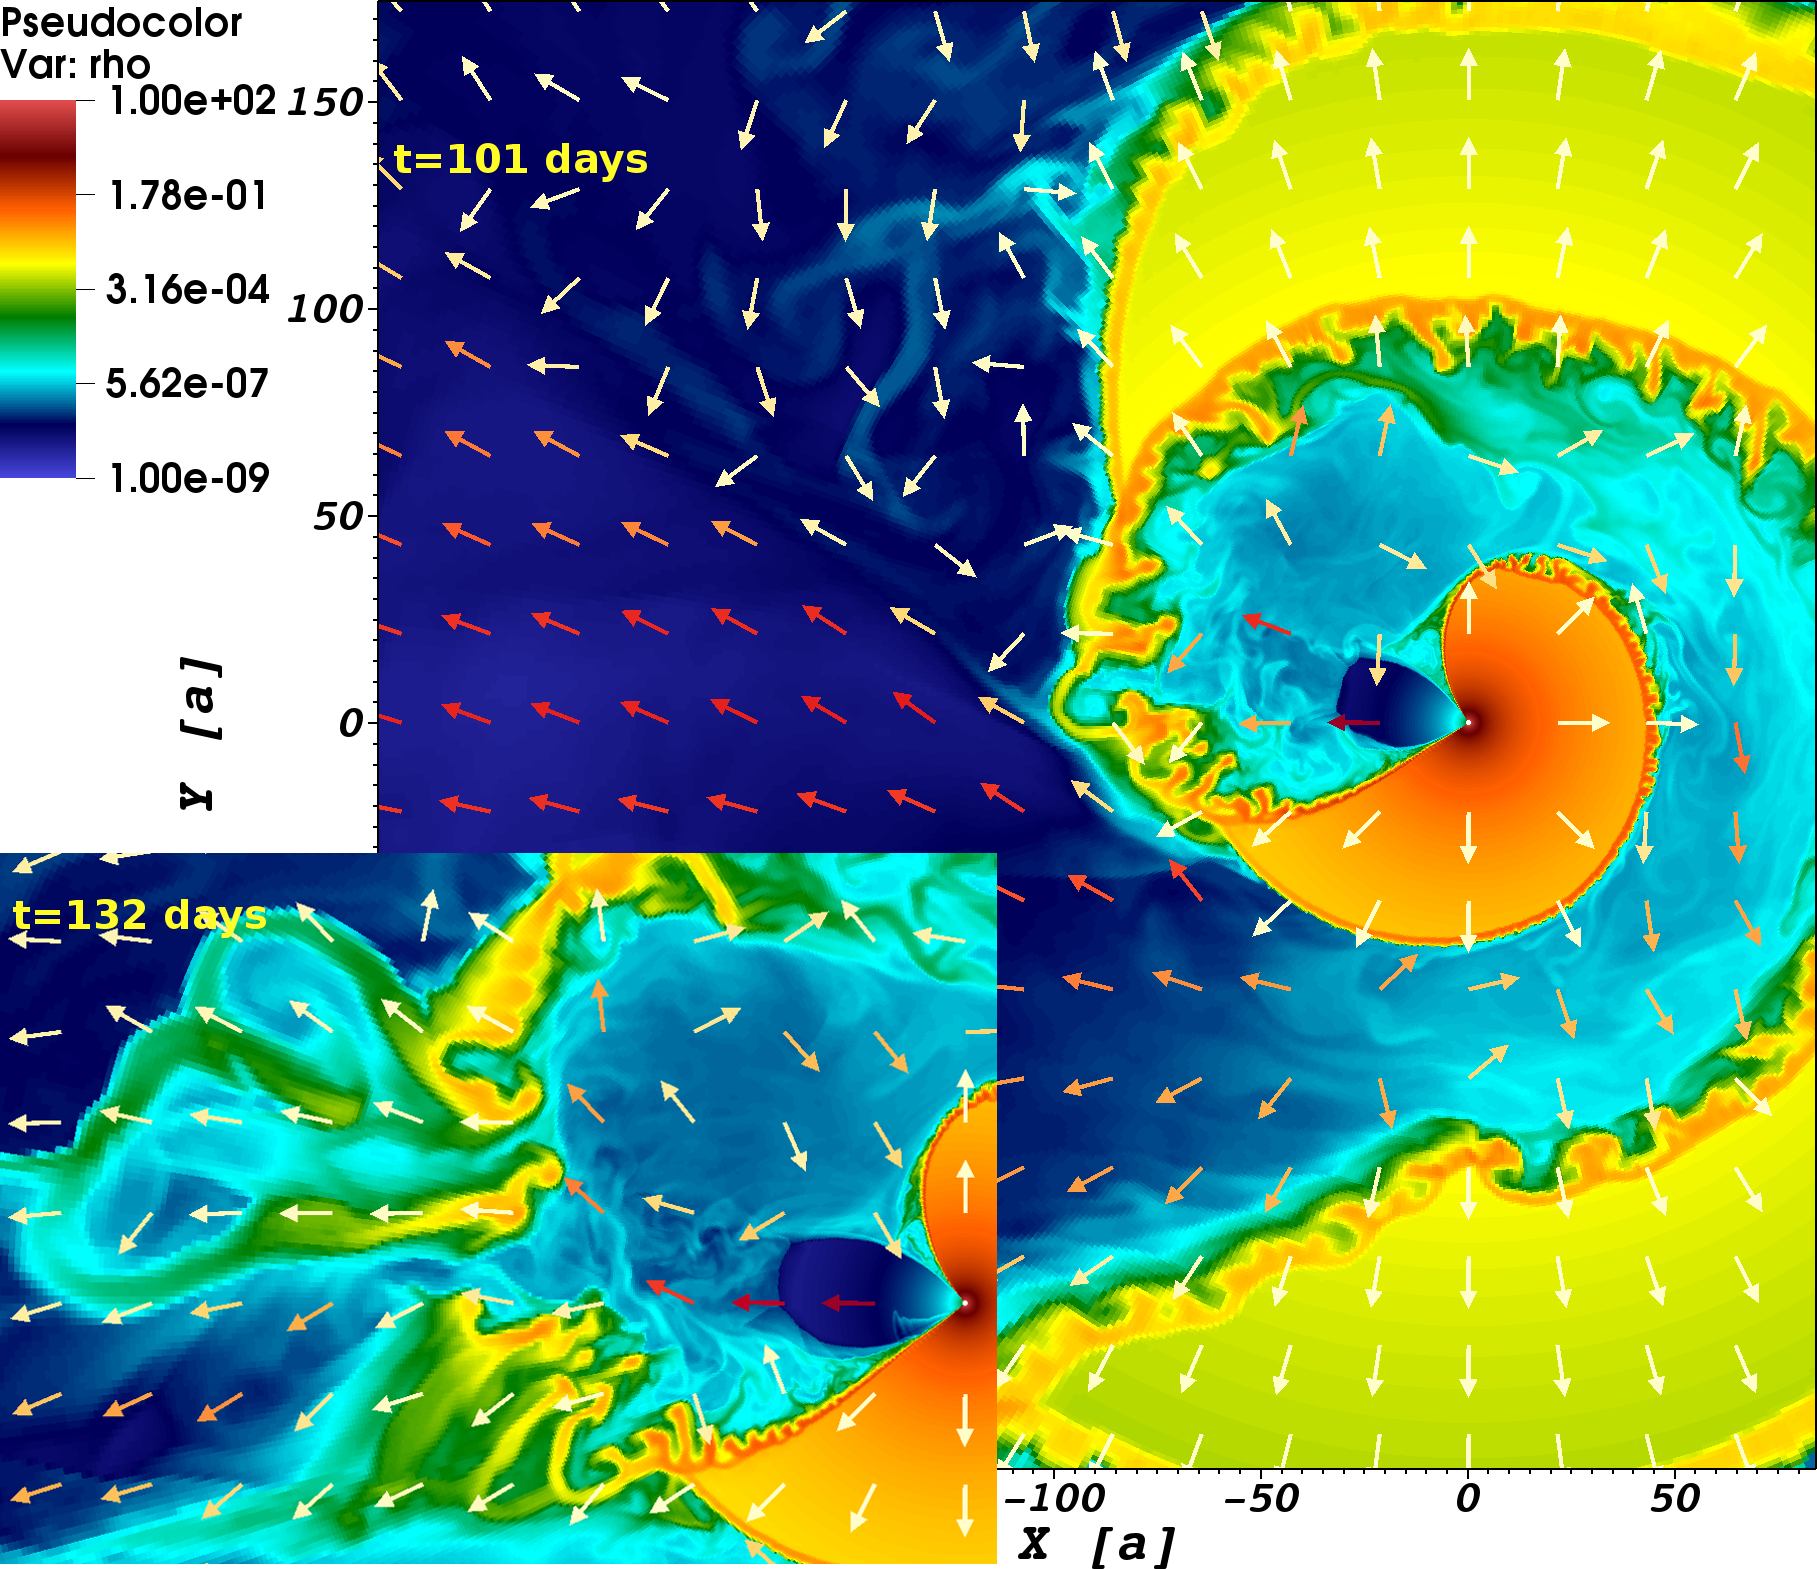
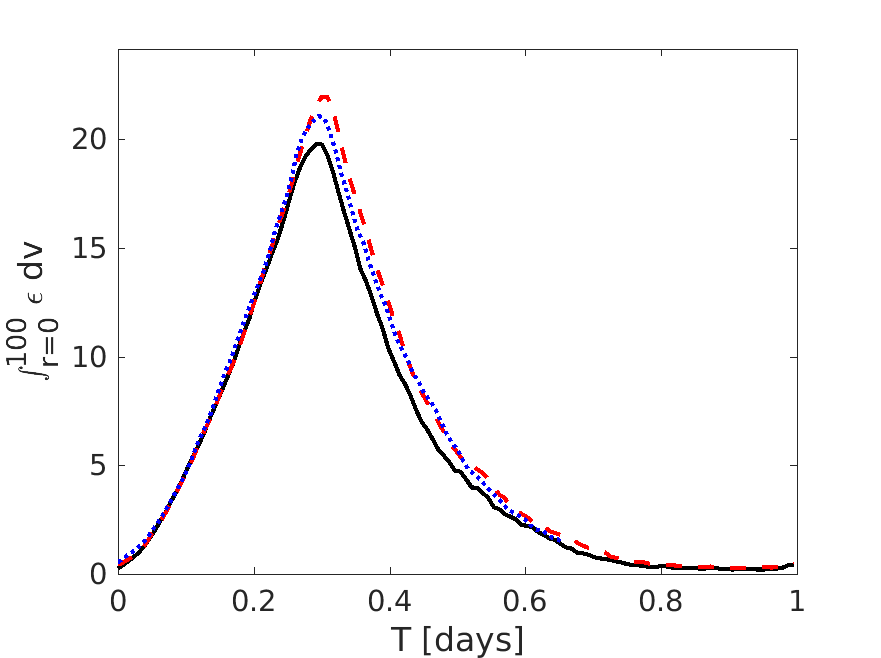
The energy accumulated in the yellow inner-most region of the pressure map abruptly drops around apastron, when the escape rate of shocked pulsar wind from this region suddenly increases. The apastron release of energy accumulated in the first turn of the spiral is caused by the disruption of the stellar wind semi-ring, which has confined the shocked pulsar wind in the apastron side during the transit from periastron to apastron. This disruption process is illustrated by Fig. 2, which shows the colour map of the density for (), and 132 days (; inlet, same scale), for a region close to the binary around apastron. The drop in energy within the inner-most region is clearly visible in the evolution of the total internal energy within shown in Fig. 3. Given the low resolution in , the result must be considered qualitatively, although the predicted strong modulation is compelling.
The typical radial velocity () of the flows moving in the direction of apastron (Sa), periastron (Sp), and normal to the apastron-periastron axis (Sn), can be computed integrating the product of with over some interval on the orbital plane (): .
The sectors Sa, Sp and Sn are chosen to illustrate the typical flow -values in different directions away from the binary, and correspond to the -ranges , and , respectively. The angular intervals are equal, and grows counterclockwise from periastron.
The -distribution of in the Sa, Sp, and Sn directions is presented in Fig. 4 for days (), showing also days () for Sa to illustrate the smoothness of the -distribution of in that direction. The figure shows that does not change much in absolute terms () in the Sp and Sn directions, whereas in the Sa direction quickly rises reaching already at cm.
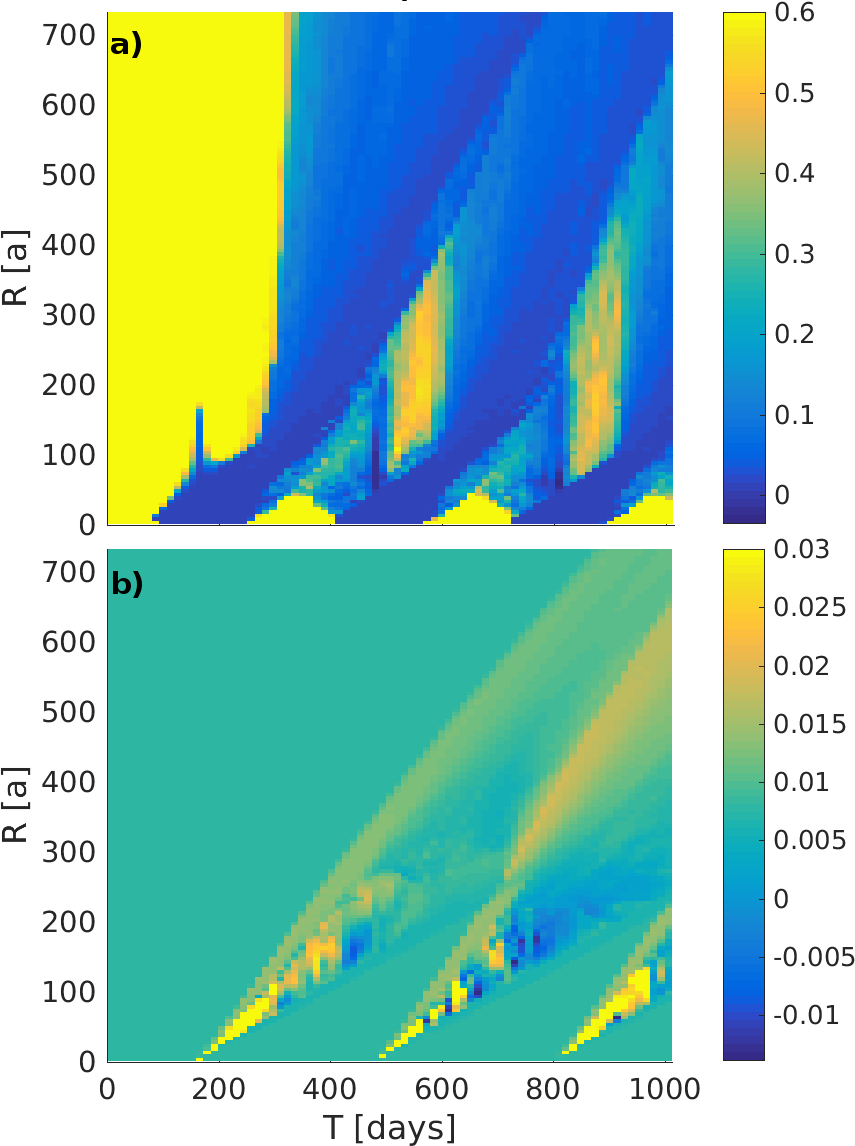
Finally, Fig. 5 presents the colour maps of the dependence on and for the Sp (top) and Sa (bottom) directions. These maps are 2D space-time representations of , which allows one to track the -evolution of the location of jumps along that indicate general flow acceleration. In addition, one can see in the figure that at fixed -values there are sudden drops in along that indicate the presence of front shocks. Because of the presence of the heavy stellar wind semi-rings, at the radius a in the Sp direction, is just , showing time variations caused by the arrival of the intercalated shells of shocked stellar and pulsar wind. On the other hand, in the Sa direction, the flow reaches mildly relativistic radial velocities, , with recurrent time variations produced by the irregular disruption of the stellar wind semi-ring and subsequent pulsar wind mass-loading. At , the system can be considered approximately in a steady state for days in the Sa direction, and days in the Sp and Sn directions.
3 Discussion and summary
As described in Sect. 1, the X-ray, GeV, and VHE lightcurves of HESS J0632057 have a maximum before apastron, around , a fast drop around , and the X-ray and VHE lightcurves have a secondary, less prominent maximum around (Aliu et al., 2014). In the context of this work, the X-ray, GeV, and VHE emission rise around would be related to the growing energy injected by the pulsar wind after periastron passage. In the leptonic scenario (X-rays: synchrotron, GeV and VHE: inverse Compton -IC-; the most efficient in the present context), this energy increase would compensate the decrease in IC emission due to a larger distance from the star. The drop in X-ray, GeV, and VHE emission would be mainly produced then by the efficient removal of energy from this region around , when the stellar wind semi-ring in the apastron direction is disrupted and then blown away by the pulsar wind impact. All this is clearly illustrated by the evolution of the total internal energy accumulated within shown in Fig. 3.
Given the typical size of the region, cm, and the stellar luminosity, erg s-1, the IC cooling timescale for TeV electrons is s (Khangulyan et al., 2014). At the typical speeds involved on those scales, say cm s-1, the potentially present TeV electrons emitting X- and VHE gamma rays would radiate % of their energy before leaving the region. Given the modest X-ray and VHE luminosities, of erg s-1, this implies an electron energy injection rate of erg s-1, compatible with a pulsar spin-down power similar for instance to that of PSR B1259–63 ( erg s-1; Johnston et al. 1992)444The energetic requirements in GeV (Li et al., 2017) are similar to those in X-rays and VHE.. A large magnetic field in the emitting region may require a larger energy budget to explain the VHE luminosities through IC because of the competition between IC and synchrotron losses. Nevertheless, although an accurate assessment of the relation between X-ray and the VHE emitting electrons needs specific modelling, the similar X-ray and VHE fluxes observed already imply that synchrotron losses cannot be much stronger than IC losses for those electrons (Aliu et al., 2014). The origin of the second, less prominent maximum around cannot be derived from the simulation results in a straightforward way, and a detailed study is needed to consistently include the second maximum in the picture just described.
The weak radio emission seen in VLBI, with fluxes mJy, can be explained by the synchrotron emission in radio of the same population of X-ray, GeV, and VHE emitting electrons, although a non-thermal model encompassing the radio, X-ray, GeV, and VHE emission is required to further check the consistency of this scenario. With this caveat in mind, one can still propose that the shift in position of the core emission, and the decrease in flux seen by VLBI observations (Moldón et al., 2011) around , can be explained by the disruption of the apastron side stellar semi-ring starting around that orbital phase. In parallel with this process, the radio emitting region, associated with the inner-most semi-ring of shocked pulsar wind on the periastron side (see Fig. 2), would become more prominent, shifting the core location of the source towards periastron. In this scenario, the impact between the pulsar wind and the fragments of stellar wind in the apastron direction could explain the radio component extended in that direction (see Barkov & Bosch-Ramon, 2016, for a similar explanation regarding the X-ray extended emission in PSR B1259–63). The size of the region highlighted by Fig. 2 is , whereas the observed radio emitting structures are in projected distance, but we indicate that: (i) the de-projected size may be easily larger by a factor of two; and (ii) the values of and wind speed are poorly constrained, leaving room to accommodate another factor of difference between the simulated and the actual radio source size.
The stellar wind fragments released around apastron passage in the apastron direction could be detected as extended X-ray emitting structures, as proposed by Barkov & Bosch-Ramon (2016) for those seen in PSR B1259–63 by Pavlov et al. (2015). In the case of HESS J0632057, the orbital period is times smaller, but the source is at a similar galactic distance. Since the extended X-ray emission size is , as this is the growth timescale of the structure, it is somewhat harder to resolve this X-ray component for HESS J0632057 than for PSR B1259–63 from Earth. The spin-down power of the putative pulsar in HESS J0632057 is also unknown, and a lower value than in PSR B1259–63 would make the emission fainter. On the other hand, the orbital period is times shorter, which leads to more frequent stellar wind fragment release than in the case of PSR B1259–63, leading to a more continuous structure. For all this, we propose that arcsecond scale extended emission from HESS J0632057, slightly more compact than in PSR B1259–63, could potentially be detected with Chandra for an exposure similar to that of PSR B1259–63 Chandra observations (Pavlov et al., 2015).
We conclude that the simulations presented here provide with a robust, semi-quantitative description of the pulsar-stellar wind interaction along the orbit in a strongly eccentric system such as HESS J0632057. They allow us to envision a broad picture that can qualitatively explain most of the non-thermal phenomenology in this source.
Three dimensional simulations with higher resolution in the -direction, including also the magnetic field at a later stage, are planned for a more accurate study of the fluid dynamics, and detailed modelling of the non-thermal emission is also on the way.
4 Acknowledgments
We want to thank the referee for a constructive and useful report. The calculations were carried out in the CFCA cluster of National Astronomical Observatory of Japan and Greate Wave FX100 Fujitsu cluster in RIKEN. We thank the PLUTO team for the possibility to use the PLUTO code and for technical support. The visualization of the results performed in the VisIt package (Hank Childs et al., 2012). This work was supported by the Spanish Ministerio de Economía y Competitividad (MINECO/FEDER, UE) under grants AYA2013-47447-C3-1-P and AYA2016-76012-C3-1-P with partial support by the European Regional Development Fund (ERDF/FEDER), MDM-2014-0369 of ICCUB (Unidad de Excelencia ‘María de Maeztu’), and the Catalan DEC grant 2014 SGR 86. This research has been supported by the Marie Curie Career Integration Grant 321520. The project was also supported by the JSPS (Japan Society for the Promotion of Science): No.2503786, 25610056, 26287056, 26800159, NSF grant AST-1306672 and DoE grant DE-SC0016369. V.B.R. acknowledges financial support from MINECO and European Social Funds through a Ramón y Cajal fellowship. BMV acknowledges MEXT (Ministry of Education, Culture, Sports, Science and Technology of Japan): No.26105521. BMV acknowledges partial support from the NSF grant AST-1306672 and DoE grant DE-SC0016369.
References
- Aharonian et al. (2005a) Aharonian F., Akhperjanian A. G., Aye K.-M., et al. 2005a, A&A, 442, 1
- Aharonian et al. (2005b) Aharonian F., Akhperjanian A. G., Aye K.-M., et al. 2005b, Science, 309, 746
- Aharonian et al. (2007) Aharonian F. A., Akhperjanian A. G., Bazer-Bachi A. R., et al. 2007, A&A, 469, L1
- Albert et al. (2006) Albert J., Aliu E., Anderhub H., et al. 2006, Science, 312, 1771
- Aliu et al. (2014) Aliu E., Archambault S., Aune T., et al. 2014, ApJ, 780, 168
- Barkov & Bosch-Ramon (2016) Barkov M. V., Bosch-Ramon V., 2016, MNRAS, 456, L64
- Bongiorno et al. (2011) Bongiorno S. D., Falcone A. D., Stroh M., et al. 2011, ApJ Lett., 737, L11
- Bosch-Ramon et al. (2012) Bosch-Ramon V., Barkov M. V., Khangulyan D., Perucho M., 2012, A&A, 544, A59
- Bosch-Ramon et al. (2015) Bosch-Ramon V., Barkov M. V., Perucho M., 2015, A&A, 577, A89
- Casares et al. (2012) Casares J., Ribó M., Ribas I., Paredes J. M., Vilardell F., Negueruela I., 2012, MNRAS, 421, 1103
- Dubus (2013) Dubus G., 2013, A&A Rev, 21, 64
- Hank Childs et al. (2012) Hank Childs H., Brugger E., Whitlock B., et al. 2012, in , High Performance Visualization–Enabling Extreme-Scale Scientific Insight. pp 357–372
- Hinton et al. (2009) Hinton J. A., Skilton J. L., Funk S., et al. 2009, ApJ Lett., 690, L101
- Johnston et al. (1992) Johnston S., Manchester R. N., Lyne A. G., Bailes M., Kaspi V. M., Qiao G., D’Amico N., 1992, ApJ Lett., 387, L37
- Kargaltsev et al. (2014) Kargaltsev O., Pavlov G. G., Durant M., Volkov I., Hare J., 2014, ApJ, 784, 124
- Khangulyan et al. (2014) Khangulyan D., Aharonian F. A., Kelner S. R., 2014, ApJ, 783, 100
- Li et al. (2017) Li J., Torres D. F., Cheng K.-S., de Ona Wilhelmi E., Kretschmar P., Hou X., Takata J., 2017, ArXiv e-prints
- Mignone & Bodo (2005) Mignone A., Bodo G., 2005, MNRAS, 364, 126
- Mignone et al. (2007) Mignone A., Bodo G., Massaglia S., Matsakos T., Tesileanu O., Zanni C., Ferrari A., 2007, ApJ supp., 170, 228
- Moldón et al. (2011) Moldón J., Ribó M., Paredes J. M., 2011, A&A, 533, L7
- Paredes et al. (2000) Paredes J. M., Martí J., Ribó M., Massi M., 2000, Science, 288, 2340
- Pavlov et al. (2015) Pavlov G. G., Hare J., Kargaltsev O., Rangelov B., Durant M., 2015, ApJ, 806, 192
- Tavani et al. (1998) Tavani M., Kniffen D., Mattox J. R., Paredes J. M., Foster R. S., 1998, ApJ Lett., 497, L89
- Zamanov et al. (2017) Zamanov R. K., Marti J., Garcia-Hernandez M. T., 2017, ArXiv:1702.06947