High-efficiency optical pumping of nuclear polarization in a GaAs quantum well
Abstract
The dynamic polarization of nuclear spins by photoexcited electrons is studied in a high quality GaAs/AlGaAs quantum well. We find a surprisingly high efficiency of the spin transfer from the electrons to the nuclei as reflected by a maximum nuclear field of 0.9 T in a tilted external magnetic field of 1 T strength only. This high efficiency is due to a low leakage of spin out of the polarized nuclear system, because mechanisms of spin relaxation other than the hyperfine interaction are strongly suppressed, leading to a long nuclear relaxation time of up to 1000 s. A key ingredient to that end is the low impurity concentration inside the heterostructure, while the electrostatic potential from charged impurities in the surrounding barriers becomes screened through illumination by which the spin relaxation time is increased compared to keeping the system in the dark. This finding indicates a strategy for obtaining high nuclear spin polarization as required for long-lasting carrier spin coherence.
Introduction. The hyperfine interaction between conduction-band electrons and lattice nuclei represents a major source of spin decoherence, undesirable for applications in, for instance, spintronics. Unfortunately, in III-V semiconductors all nuclear species have non-zero spin momenta. A possibility of fighting the hyperfine interaction induced electron spin decoherence is to reduce the nuclear spin fluctuations by imposing a magnetic order on the nuclear spin system. One approach to reach this goal is nuclear self-polarization imposing a spontaneous ordering via the electron-nuclear feedback D’yakonov and Perel (1972); Korenev (1999). Another way is cooling of the nuclear spin system down to a few K to reach a phase transition into an ordered phase Merkulov (1982). Further, dynamic polarization of nuclear spins via coupling with charge carriers Khaetskii et al. (2002) counteracts also the spin decoherence. The dynamic polarization reduces the entropy of the nuclear spin system Goldman (1970). Different types of nuclear magnetic ordering can be achieved by lowering the nuclear spin temperature using adiabatic demagnetization Oja and Lounasmaa (1997) or nuclear magnetic resonance techniques Goldman (1970). So far, nuclear ordering has not been achieved in semiconductors because the required initial polarization of the nuclear spins is high, about Merkulov (1982).
Reaching that high nuclear spin polarization has proved to be a challenging task. For example, in case of a GaAs quantum well (QW) the authors Kalevich et al. (1990) reported an average nuclear spin polarization of , which corresponds to an effective nuclear magnetic field acting on the electron spins (the Overhauser field) of . For dynamic nuclear polarization in single quantum dots nuclear magnetic fields up to were reported as result of the enhanced hyperfine interaction in these structures Tartakovskii et al. (2007); Braun et al. (2006); Urbaszek et al. (2007); Gammon et al. (2001). However, the nuclear polarization efficiency (the so-called leakage factor, see below) so far did not exceed 70% in those studies. Furthermore, the strain in (In,Ga)As quantum dots prevents the establishment of equilibrium in the nuclear spin system Maletinsky et al. (2009), representing a major obstacle on the way to nuclear spin ordering.
In this work, we study the dynamic polarization of nuclear spins in a wide, virtually unstrained GaAs quantum well in a tilted external magnetic field. The nuclear fields that we achieve reach remarkably high strengths close to . This corresponds to a nuclear spin polarization efficiency above . The measured dynamics of onset and decay of nuclear polarization indicate a strategy towards high nuclear polarization approaching unity that may be applied also to other semiconductor structures.
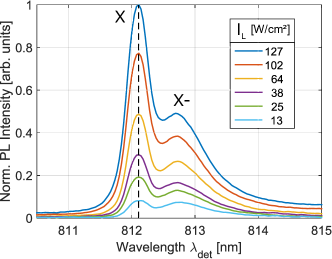
Sample. The high quality sample used here was grown by molecular beam epitaxy on a Te-doped GaAs substrate and consists of nominally undoped GaAs/Al0.35Ga0.65As QWs with thicknesses varing from nm to nm Eshlaghi et al. (2008). Figure 1 shows photoluminescence (PL) spectra in the energy range where the emission of the QW of interest occurs, measured at temperature for different excitation intensities. The exciton emission line at nm from the QW shows a width of nm only, comparable to the high quality quantum wells studied in Ref. Moret et al. (2011). Its intensity increases considerably with excitation power, while the intensity of the additional feature at longer wavelengths remains almost constant as a decomposition of the signal into two spectral lines by a corresponding fit shows. We attribute it to emission from negatively charged excitons that are formed due to a small background doping in the barriers. However, we find no indication for emission from donor-bound excitons.
Maximum achievable nuclear field. First we measure the maximum achievable nuclear field in our structure. To that end, we summarize the Dyakonov-Perel formulation of dynamic nuclear polarization (DNP) Dyakonov and Perel (1974, 1984); Dyakonov et al. (1975). The kinetics of the average nuclear spin are described by an exponential rise with the initial condition :
| (1) |
where the nuclear relaxation time with and being the relaxation times via an electron and via other channels, e.g. quadrupole-induced relaxation, respectively. The stationary value of the mean nuclear spin is given by
| (2) |
is the nuclear spin, is the electron spin and is the electron spin polarization in absence of an external magnetic field. Here is the angle between magnetic field and optical axis, see inset of Fig. 2 (b). We use an oblique magnetic field to allow simultaneously for DNP creation and measurement of the Hanle effect in presence of an Overhauser field.
In addition, we introduce the “leakage factor”
| (3) |
If the spin-lattice relaxation is suppressed, will exceed by far (), and the leakage factor approaches unity. The spin flow out of the nuclear spin system is suppressed then, so that high nuclear polarization may be achieved. Vice versa, if the spin-lattice relaxation is efficient, then so that drops to zero. Therefore the leakage factor is a good measure of the efficiency of dynamic nuclear polarization by optically oriented electrons. Here, we measure the kinetics of the buildup of the nuclear magnetic field experimentally. The time dependence of the nuclear magnetic field can be written as
| (4) |
where is the hyperfine constant and is the Bohr magneton. The stationary value for the nuclear magnetic field is
| (5) |
with Paget et al. (1977). The electron g-factor in the QW is close to the one for bulk GaAs Snelling et al. (1991). From the values for and extracted from the experimental data using Eq. (4), we can determine and .
Experimental protocol. We implement the optical orientation method in a reflection geometry, where the sample is excited with circularly polarized light to inject spin-polarized electrons Lampel (1968); Dyakonov and Perel (1984); Abragam (1967). We analyze the influence of the nuclear field on the circular PL polarization Ekimov and Safarov (1970); Parsons (1969); Dzhioev et al. (1998) defined as , where is the intensity of the right- or left-circularly polarized PL emission, respectively. The PL is passed through a photo-elastic modulator and a monochromator after which it is detected by an avalanche photodiode. The magnetic field is generated by an electromagnet with field strengths up to . The sample is mounted on the cold finger of a flow-cryostat and kept at a temperature of . Two lock-in amplifiers are used to measure the sum and the difference of left- and right-circularly polarized light, . The optical pumping is done in an external magnetic field of . A continuous wave (cw) diode laser is tuned to the excitation wavelength using an excitation intensity of . The laser spot size is about for all measurements. The monochromator is set to , which corresponds to the maximum of the e1-hh1 transition, see the vertical dashed line in Fig. 1, and the optical detuning of .
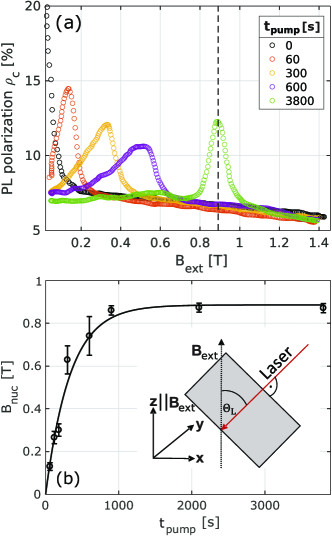
The measurement protocol consists of two steps. First we optically pump the nuclear spin system and monitor the buildup of PL polarization. Then we detect the nuclear spin polarization by measuring Hanle curves Hanle (1924); Dyakonov and Perel (1984) after different pumping times . To that end, the magnetic field at is scanned across the accessible field range from . The Hanle measurements are done at a reduced laser intensity of and a scan-time of , to minimize within the technical limitations disturbances due to further optical pumping.
Figure 2 (a) shows Hanle curves measured after pumping the system for different . The vertical dashed line marks the center of the Hanle curve after the maximum used pump time , where we observe a nuclear magnetic field of , the maximum field achievable for the chosen conditions. All measurements were done at . The buildup of the nuclear magnetic field is shown in Fig. 2 (b) as function of pump time. The solid line gives the fit according to Eq. (4). The fit parameters are: Nuclear relaxation time , nuclear magnetic field , nuclear spin-electron relaxation time , nuclear spin-lattice relaxation time , and leakage factor . We highlight the nuclear magnetic field of nearly for an applied external field of as well as the leakage factor close to unity, indicating highly efficient nuclear polarization. This high efficiency is reflected by the nuclear spin-lattice time , which is nearly seven times longer than .
Measurement of spin-lattice relaxation. Further insight into the low spin flow out of the nuclear spin bath can be taken from studies in which the nuclear spin relaxation time is measured directly. To that end, the experimental protocol is slightly adapted. The external magnetic field is varied from 0 to , which we can measure with an accuracy of mT. The temperature is set to or . A cw Ti:sapphire laser is tuned to resulting in for and for . The laser intensity is .
To measure the nuclear spin-lattice relaxation time without the influence of spin-polarized electrons acting on the nuclei through an effective field known as Knight field, we use a three-stage protocol where the optical pumping, the relaxation and the detection of the remaining nuclear spin polarization are separated in time Kotur et al. (2014, 2016). The first stage addresses the optical pumping of the nuclear spin system in oblique magnetic field (): for and for . Thereafter the excitation beam is switched off and the magnetic field is set to the at which we want to determine as function of the dark period duration . During this dark period the nuclear field decreases by the factor . Right after the dark period the remaining nuclear polarization is measured through the PL polarization representing the third stage, where the laser beam is applied again and the external magnetic field is restored.
From the PL polarization at the beginning of the third stage and using Eq. (6) Kotur et al. (2014) we obtain information about the dynamics of the nuclear magnetic field in the dark
| (6) |
where is the degree of PL polarization in the absence of an external magnetic field and is the half width at half maximum of the pure electronic Hanle curve ( excitation at modulation frequency). Once knowing the dependence we determine the relaxation time from a fit with an exponential decay function.
In order to compare the measured times in the absence of pumping with the time constant of nuclear polarization buildup, in additional measurements the sample is kept in the dark at for in order to completely cancel the Overhauser field. Thereafter the optical pumping is resumed for different external magnetic fields and the time evolution of PL polarization due to the DNP is measured.
Results. To understand the origin of the small leakage of nuclear spin we compare the nuclear spin relaxation times both under pumping and in the dark. Figure 3 (a) shows the change of Overhauser field as function of the dark relaxation period at and . Fitting these data with an exponential decay function gives us the , which due to the absence of photoexcited carriers corresponds to the spin-lattice relaxation time in darkness. We repeated this procedure for a set of dark relaxation fields at and .
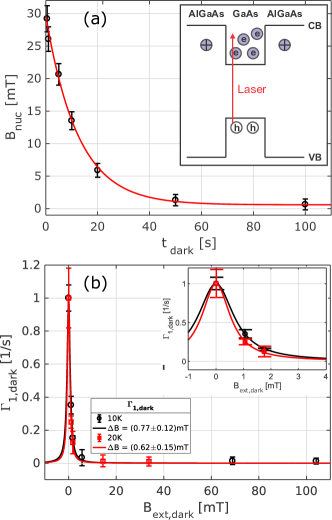
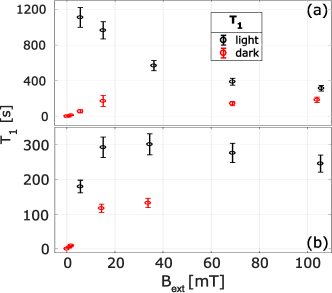
The complete set of measured relaxation rates for different relaxation fields and the two temperatures is shown in Fig. 3 (b). The solid lines are Lorentzian fits with a half width at half maximum of for and for . Figure 4 shows the comparison of the dark and bright (i.e. under illumination) relaxation times measured at (a) and (b) . Surprisingly, we observe at least twice longer times for the nuclear spin polarization buildup under illumination, which disturbs the system, than for the spin polarization decay in darkness.
We note that the observed trend for the nuclear relaxation times under illumination differs at K in the low field regime from the one observed at K. Namely, coming from high external fields one would expect a further increase of below mT, while we observe a decrease. The source of this reduction is not fully understood yet and needs further investigation. A possible origin could be thermal activation of a further relaxation mechanism on these long time scales. An example might be activation of weakly localized electrons in the quantum well plane, so that they become mobile. In higher magnetic fields, they may become re-localized by magnetic confinement.
Discussion The strong suppression of nuclear relaxation in the dark already at weak magnetic fields of the order of indicates a warm up of the nuclear spin system by slowly varying electric fields via the quadrupole interaction for lower fields Kotur et al. (2016). The characteristic field at which increases twice has to be interpreted then as the effective local field of the nuclear spin interactions. The extracted are a few times larger than predicted for the dipole-dipole interaction between the nuclear spins Paget et al. (1977). They are typical for heterostructures and originate from a static quadrupole splitting of the nuclear spin levels. The origin may be some residual strain (as observed in Ref. Vladimirova et al. (2017) in a GaAs microcavity) or a static electric field gradient.
For magnetic fields larger than , the nuclear spin relaxation rate is reduced by a factor of nearly . Similar findings were reported in Ref. Kotur et al. (2016) for bulk n-GaAs, however, with a reduction factor of about only. The reduction was explained by suppression of the quadrupole relaxation, induced by slowly fluctuating ( ms fluctuation time) donor charges Kotur et al. (2014). The low magnetic field required for suppression indicates that there is only a small number of impurities in the QW, as expected for our intrinsic, nominally undoped quantum well of high quality, as evidenced by the narrow emission line. Otherwise such charges would be the source of a background of field-independent relaxation via hyperfine coupling. Therefore, the fluctuating electric fields that induce the quadrupole warm up most likely originate from charges in the AlGaAs barriers Pavesi and Guzzi (1994), see the sketch in Fig. 3 (a). For such impurities, rechargement process were reported for excitation below the barriersGlasberg et al. (1999); Volkov et al. (2000); Dzhioev et al. (2002).
Having this in mind, one can explain the unusual finding that the -time is longer under pumping than in the dark. The long-range fluctuating electric fields, which are created by charges in the AlGaAs barriers Pavesi and Guzzi (1994), are screened by photoexcited carriers when the pump is on, and the quadrupole warm-up is quenched. The contribution to nuclear spin relaxation by residual localized electrons is negligible in our i-type GaAs QW. The only remaining relaxation mechanism is hyperfine scattering on free photoexcited two-dimensional electrons. The strength of this mechanism was theoretically evaluated in Ref. Kalevich and Korenev (1991), where the authors found that in case of non-degenerate free electrons in a QW of width the hyperfine relaxation rate is
| (7) |
where is the hyperfine constant, is the volume of the unit cell, is the QW electron concentration, is the effective mass of the electrons and is the Dirac constant. For our QW this gives an estimate in the order of , using . We highlight also the dependence of the relaxation time . This dependence is a consequence of the stronger electron confinement in narrower QWs, enhancing the hyperfine interaction with the nuclei and shortening the relaxation time. For this scaling to be valid, the QW width should however, not be too small, as the electrons then become localized in the QW plane.
Since the main mechanism of nuclear spin-lattice relaxation under pumping turns out to be purely electronic, provided by the Fermi contact interaction that conserves the total angular momentum of the interacting particles, leading to the low leakage of the nuclear spin as reflected by the value of close to unity Abragam (1967). This explains the strong Overhauser fields reached after long pumping in our experiments.
The presented results show that a wide undoped GaAs quantum well might be the structure of choice for obtaining high degrees of nuclear spin polarization by optical pumping. However, the fast quadrupole-induced nuclear spin warm up observed at low magnetic fields in the dark may hinder experiments targeting adiabatic demagnetization of the nuclear spins, aimed at reaching ultralow spin temperatures and eventually nuclear magnetic ordering. To reduce this undesirable effect, measures should be taken to remove residual charged impurities outside the quantum well and/or screening of fluctuating long-range electric fields in the absence of optical pumping. This concept may be also transferred to unstrained GaAs-based quantum dots that are appealing as host systems for carrier spins suitable as quantum bits Sallen et al. (2014); Huo et al. (2014).
Acknowledgments. We acknowledge the financial support of the Deutsche Forschungsgemeinschaft in the frame of the ICRC TRR 160 (Projects No. A6, C7) and the Russian Foundation for Basic Research (Projects No. 15-52-12020, 15-52-12017).
References
- D’yakonov and Perel (1972) M. D’yakonov and V. Perel, JETP Lett. 16, 398 (1972).
- Korenev (1999) V. Korenev, Zh. Eksp. Teor. Fiz. 70, 129 (1999).
- Merkulov (1982) I. Merkulov, Zh. Eksp. Teor. Fiz 82, 319 (1982).
- Khaetskii et al. (2002) A. V. Khaetskii, D. Loss, and L. Glazman, Phys. Rev. Lett. 88, 186802 (2002).
- Goldman (1970) M. Goldman, Spin temperature and nuclear magnetic resonance in solids (Clarendon Press Oxford, 1970).
- Oja and Lounasmaa (1997) A. Oja and O. Lounasmaa, Rev. Mod. Phys. 69, 1 (1997).
- Kalevich et al. (1990) V. Kalevich, V. Korenev, and O. Fedorova, JETP Lett. 52, 349 (1990).
- Tartakovskii et al. (2007) A. I. Tartakovskii, T. Wright, A. Russell, V. I. Fal’ko, A. B. Van’kov, J. Skiba-Szymanska, I. Drouzas, R. S. Kolodka, M. S. Skolnick, P. W. Fry, et al., Phys. Rev. Lett. 98, 026806 (2007).
- Braun et al. (2006) P.-F. Braun, B. Urbaszek, T. Amand, X. Marie, O. Krebs, B. Eble, A. Lemaître, and P. Voisin, Phys. Rev. B 74, 245306 (2006).
- Urbaszek et al. (2007) B. Urbaszek, P.-F. Braun, T. Amand, O. Krebs, T. Belhadj, A. Lemaître, P. Voisin, and X. Marie, Phys. Rev. B 76, 201301 (2007).
- Gammon et al. (2001) D. Gammon, A. L. Efros, T. Kennedy, M. Rosen, D. Katzer, D. Park, S. W. Brown, V. Korenev, and I. Merkulov, Phys. Rev. Lett. 86, 5176 (2001).
- Maletinsky et al. (2009) P. Maletinsky, M. Kroner, and A. Imamoglu, Nat. Phys. 5, 407 (2009).
- Eshlaghi et al. (2008) S. Eshlaghi, W. Worthoff, A. D. Wieck, and D. Suter, Phys. Rev. B 77, 245317 (2008).
- Moret et al. (2011) N. Moret, D. Y. Oberli, E. Pelucchi, N. Gogneau, A. Rudra, and E. Kapon, Phys. Rev. B 84, 155311 (2011).
- Dyakonov and Perel (1974) M. Dyakonov and V. Perel, JETP 38, 177 (1974).
- Dyakonov and Perel (1984) M. Dyakonov and V. Perel, in Optical Orientation, edited by F. Meier and B. Zakharchenya (Elsevier, Amsterdam, 1984), vol. 8 of Modern Problems in Condensed Matter Sciences, pp. 11 – 71.
- Dyakonov et al. (1975) M. Dyakonov, V. Perel, V. Berkovits, and V. Safarov, JETP 40, 950 (1975).
- Paget et al. (1977) D. Paget, G. Lampel, B. Sapoval, and V. I. Safarov, Phys. Rev. B 15, 5780 (1977).
- Snelling et al. (1991) M. Snelling, G. Flinn, A. Plaut, R. Harley, A. Tropper, R. Eccleston, and C. Phillips, Phys. Rev. B 44, 11345 (1991).
- Lampel (1968) G. Lampel, Phys. Rev. Lett. 20, 491 (1968).
- Abragam (1967) A. Abragam, The Principles of Nuclear Magnetism (Clarendon Press, Oxford, 1967).
- Ekimov and Safarov (1970) A. Ekimov and V. Safarov, JETP Lett. 12, 1 (1970).
- Parsons (1969) R. R. Parsons, Phys. Rev. Lett. 23, 1152 (1969).
- Dzhioev et al. (1998) R. I. Dzhioev, B. P. Zakharchenya, V. L. Korenev, P. E. Pak, D. A. Vinokurov, O. V. Kovalenkov, and I. S. Tarasov, Phys. Solid State 40, 1587 (1998).
- Hanle (1924) W. Hanle, Z. Phys. 30, 93 (1924).
- Kotur et al. (2014) M. Kotur, R. Dzhioev, K. Kavokin, V. L. Korenev, B. Namozov, P. Pak, and Y. G. Kusrayev, JETP Lett. 99, 40 (2014).
- Kotur et al. (2016) M. Kotur, R. Dzhioev, M. Vladimirova, B. Jouault, V. Korenev, and K. Kavokin, Phys. Rev. B 94, 081201 (2016).
- Vladimirova et al. (2017) M. Vladimirova, S. Cronenberger, D. Scalbert, M. Kotur, R. I. Dzhioev, I. I. Ryzhov, G. G. Kozlov, V. S. Zapasskii, A. Lemaître, and K. V. Kavokin, Phys. Rev. B 95, 125312 (2017).
- Pavesi and Guzzi (1994) L. Pavesi and M. Guzzi, J. Appl. Phys. 75, 4779 (1994).
- Glasberg et al. (1999) S. Glasberg, G. Finkelstein, H. Shtrikman, and I. Bar-Joseph, Phys. Rev. B 59, R10425 (1999).
- Volkov et al. (2000) O. V. Volkov, I. V. Kukushkin, D. V. Kulakovskii, K. von Klitzing, and K. Eberl, JETP Lett. 71, 322 (2000).
- Dzhioev et al. (2002) R. I. Dzhioev, V. L. Korenev, I. A. Merkulov, B. P. Zakharchenya, D. Gammon, A. L. Efros, and D. S. Katzer, Phys. Rev. Lett. 88, 256801 (2002).
- Kalevich and Korenev (1991) V. K. Kalevich and V. L. Korenev, Appl. Magn. Reson. 2, 397 (1991).
- Sallen et al. (2014) G. Sallen, S. Kunz, T. Amand, L. Bouet, T. Kuroda, T. Mano, D. Paget, O. Krebs, X. Marie, K. Sakoda, et al., Nat. Commun. 5, 3268 (2014).
- Huo et al. (2014) Y. H. Huo, B. J. Witek, S. Kumar, J. R. Cardenas, J. X. Zhang, N. Akopian, R. Singh, E. Zallo, R. Grifone, D. Kriegner, et al., Nat. Phys. 10, 46 (2014).