Predictions for Cold Nuclear Matter Effects in Pb Collisions at TeV
Abstract
Predictions for cold nuclear matter effects on charged hadrons, identified light hadrons, quarkonium and heavy flavor hadrons, Drell-Yan dileptons, jets, photons, gauge bosons and top quark pairs produced in Pb collisions at TeV are compiled and, where possible, compared to each other. Predictions of the normalized ratios of Pb to cross sections are also presented for most of the observables, providing new insights into the expected role of cold nuclear matter effects. In particular, the role of nuclear parton distribution functions on particle production can now be probed over a wider range of phase space than ever before.
keywords:
perturbative QCD, hard and electromagnetic probes, cold nuclear matter, charged hadron production1 Introduction
This paper compiles cold matter predictions for the 8.16 TeV Pb run at the LHC that occurred in November 2016. While it appears after the completion of the run, the predictions were all gathered before any data appeared. However, the preliminary data that have become available after the run, namely rapidity and dependence in the forward and backward rapidity regions from ALICE [1] and LHCb [2] are included for comparison in the appropriate sections.
This work follows the format of the predictions for Pb run at TeV [3]. Section 2 describes the models that specifically address unidentified light charged hadron production. These include saturation approaches, Monte Carlo event generators, and perturbative QCD-based calculations. Section 3 compares predictions obtained from models described in Sec. 2 with each other. The next several sections present predictions for specific observables including quarkonium and heavy flavor hadrons (Sec. 4), Drell-Yan lepton pairs (Sec. 5), jets (Sec. 6), direct photons (Sec. 7), massive gauge bosons (Sec. 8), and top quarks (Sec. 9). Some of the calculations were made at TeV while others were made at the actual center-of-mass energy of 8.16 TeV. The 2% difference in , does not have a significant effect on most calculated observables and especially not on ratios such as the nuclear modification factor . The energies at which the calculations are carried out are noted throughout.
Note that, as in the 2013 Pb run at 5.02 TeV, the proton direction is defined to be toward forward rapidity, similar to a fixed-target configuration where the nucleus is the target. This is assumed to be the case, even though data are taken in two different experimental configurations, one with the proton moving toward forward rapidity and one where the beam directions are reversed. As before, changing the beam direction is necessary for the forward detectors of ALICE and LHCb to be able to cover the full phase space.
There are advantages with the 8.16 TeV run that were missing from the run at 5.02 TeV. The Run 2 Pb 8.16 TeV luminosity was nearly a factor of five higher than the 2013 Run 1 5.02 TeV Pb luminosity so that the rates for hard processes should be considerably higher than in the earlier Pb run. In addition, while there was not a 5 TeV run for a baseline comparison at the time of the initial Pb run, data was taken at 8 TeV in Run 1. Therefore, when constructing the nuclear suppression factor , there is no need to rely on interpolations between runs at different energies because a more direct comparison can be made. In addition, the 8 TeV comparison data was taken during a long LHC proton run rather than a short heavy-ion run, as was the case for the comparison data at 2.76 TeV used to extrapolate the baseline at 5.02 TeV. All these factors combine to make it more likely that the data can better discriminate between approaches and constrain models.
It is noteworthy that the LHC Run 2 has also included a short run at 5.02 TeV, the same energy as the earlier Pb run and also the same as the Pb+Pb Run 2 energy. Thus it is possible to return to the previously released results to form a measurement-based ratio rather than employing an extrapolated denominator, allowing some clarification of previous controversial results, see Ref. [4]. In addition, for the first time at the LHC, data from , Pb and Pb+Pb collisions are now available at the same energy and thus can be compared on the same level.
One physics outcome from the 5 TeV Pb run is the new set of nuclear parton distribution functions by Eskola and collaborators, EPPS16 [5]. This set is the first to include the LHC data, specifically that of and production from CMS [18, 19] and ATLAS [20] as well as the dijet data from CMS [17]. One advantage of these results is that they are all forward-backward asymmetry data and do not rely on a baseline at the same energy. They also added, for the first time for the Eskola et al sets, the neutrino deep-inelastic scattering data from CHORUS [21]. Incorporating the LHC and neutrino data into the analysis allowed more detailed flavor separation for the quark sets. In particular, the LHC data allowed them to increase the fit range in momentum fraction, , and factorization scale, , to regions heretofore unavailable. Unfortunately, even with the dijet data from CMS, the gluon distribution in the nucleus, particularly at low and moderate , is still not well constrained. These sets were not yet available at the time most of the predictions for this paper were collected. Therefore there are no calculations with these sets presented here except for the top quark predictions in Sec. 9. However, it is worth noting that the central EPPS16 set gives results quite similar to those calculated with EPS09 NLO. The largest change, for gluon-dominated processes, is the increase in the uncertainty band due to the increased number of parameters required for flavor separation and the relaxing of some previous constraints. See Ref. [5] for details and comparison to the 5.02 TeV Pb data included in the global analysis.
One might expect further global analyses of the nuclear parton densities after the 8.16 TeV data become available. At a given , the value probed in a hard scattering process is a factor of 0.62 smaller at 8.16 TeV than 5.02 TeV. In addition, the higher energy allows a somewhat broader reach in rapidity so that some processes, such as production at LHCb, see the discussion in Ref. [4], measured near the edge of phase space, can expect higher statistics and perhaps high enough significance to be included in future global fits. Similarly, the reach of most processes is increased.
A further physics outcome of the 5.02 TeV Pb run, particularly in the most central collisions, along with high multiplicity data, showed a smooth transition between these high particle density and Pb collisions and Pb+Pb colliisons for some observables [6]. Applications of hydrodynamics to these small systems with large pressure anisotropies have been remarkably successful [7] despite the short distances and system evolution times. It has been argued that hydrodynamics is applicable as long as hydrodynamic modes dominate the evolution, independent of the system anisotropy [8]. However, the short lifetimes implied for small systems make the non-equilibrium stage of hydrodynamics more important, as was shown in the case of photon production [9]. Furthermore, flow observables are sensitive to the substructure of the proton projectile [10] in Pb collisions, as demonstrated in Ref. [11].
However, other approaches can mimic the signatures of hydrodynamics. As has been shown previously, collective behavior can arise from models such as [4] where only a few collisions are required to produce an anisotropy. Correlations can also arise in the saturation picture because initial-state correlations can be carried into the final-state, including long range correlations in rapidity [7].
Observables to distinguish between the different approaches have been suggested, including mass ordering of the anisotropy coefficients, multi-particle cumulants, odd flow harmonics, and jet quenching [12]. Measurements with different collision systems, such as the Au, d+Au and 3He+Au studies at RHIC [13, 14] and modeled in e.g. Refs. [15, 16] are also important. For more details and further references, see Ref. [12]. This interesting topic will not be further covered here since the focus is on cold nuclear matter effects in these collisions.
2 Inclusive charged hadron production models (J. Albacete, G. G. Barnaföldi, G. Bíró, A. Dumitru, M. Gyulassy, Sz. M. Harangozó, T. Lappi, Z.-B. Kang, P. Lévai, Z. Lin, G. Ma, H. Mäntysaari, G. Papp, A. Rezaeian, B. Schenke, S. Schlichting, P. Tribedy, R. Venugopalan, I. Vitev, X.-N. Wang, H. Xing, B.-W. Zhang)
Here the models employed for inclusive charged hadron production are described. They include saturation models, event generators, and perturbative QCD, assuming collinear factorization.
2.1 Saturation models
Three saturation models are discussed here: the running-coupling Balitsky-Kovchegov (rcBK) hybrid approach, the impact-parameter Color Glass Condensate (bCGC) approach, and the IP-Glasma model.
2.1.1 rcBK (J. Albacete, A. Dumitru, T. Lappi, H. Mäntysaari) and bCGC (A. Rezaeian)
The discussion in this section is based on that of Lappi and Mäntysaari in Ref. [22] using the rcBK hybrid approach with a color glass condensate (CGC) initial condition for the nucleus and collinear factorization for the proton in the forward direction. They have provided the transverse momentum dependence of the nuclear suppression factor for charged hadrons, at mid and forward rapidity. Albacete and Dumitru provided the charged hadron multiplicity distribution in the lab and center of mass frames based on the work reported in Ref. [23] and also shown in the compilation of predictions and results for 5 TeV in Refs. [3, 4]. Rezaeian provided the charged hadron multiplicity distribution based on the bCGC saturation model in the center of mass frame and the transverse momentum dependence of the nuclear suppression factor based on the rcBK saturation approach at midrapidity [73]. The details of the calculations can be found in Ref. [73].
Input from HERA
In the rcBK approach, particle production is calculated consistently with the HERA deep inelastic scattering data in the CGC framework, as discussed in more detail in Ref. [22]. First, the proton structure function is calculated in terms of the virtual photon-proton cross section
| (1) |
where is the dipole-proton scattering amplitude, is the transverse size of the dipole, and the proton transverse area, , is obtained by assuming a factorizable impact parameter profile, . The virtual photon splitting function, , describes the splitting for transverse () and longitudinal () photons. Only light quark flavors () are considered here.
The QCD dynamics are included in . The Bjorken- evolution of the amplitude is given by the rcBK equation. The initial condition for Balitsky-Kovchegov evolution is parameterized as
| (2) |
The initial saturation scale at is parameterized by . Instead of introducing an anomalous dimension, , in the dipole amplitude, in the calculations of Lappi and Mäntysaari, the infrared cutoff of the McLerran-Venugopalan (MV) model is modified by introducing an additional fit parameter, , which also affects the saturation scale at the initial condition. An advantage of this parameterization [22] over the AAMQS fit by Albacete et al. [23] is that, in the “MVe” parameterization used here, the dipole amplitude in momentum space (and thus the unintegrated gluon distribution) is positive definite.
The parameters , and are obtained by fitting the combined HERA proton structure function data [24]. When solving the rcBK equation, the strong coupling constant is parameterized as
| (3) |
where is also a fit parameter. The last free parameter, , is the scale at which the strong coupling constant is evaluated in coordinate space. The best fit values are , , mb and , corresponding to the saturation scale at initial momentum fraction .
[Note that the prediction by Albacete and Dumitru uses the AAMQS fit with initial condition
| (4) |
They used , and GeV in their calculations for this work.]
The dipole amplitude for nuclei is obtained by requiring that, in the dilute limit, the dipole-nucleus cross section is times the dipole-proton cross section, and that, for large dipoles, . The dipole-nucleus scattering amplitude is then
The nuclear thickness function, , is obtained from the Woods-Saxon distribution. No additional nuclear parameters are introduced because , and are obtained from a fit to DIS data. The dipole-nucleus amplitude is evolved to smaller values of independently for each impact parameter using the rcBK equation.
Single inclusive cross section
At midrapidity, both the proton and the nucleus are probed at small and the invariant gluon yield is obtained from the factorization result [25, 26]
| (6) |
where and the dipole amplitude is evaluated in the adjoint representation, . The dependence of is left implicit. The amplitude in Eq. (6) is obtained from the Fourier transformation of the dipole-nucleus amplitude .
Proton-proton scattering is described by replacing by and, instead of , the geometric area multiplying the expression becomes , see Ref. [22]. The inelastic proton-proton cross section is taken to be mb.
For particle production at forward rapidity, the proton becomes dilute and can be described with parton distribution functions obtained from collinear factorization. The invariant quark or gluon scattering yield in proton-nucleus collisions is then
| (7) |
The dipole-nucleus amplitude in the definition of is evaluated in the fundamental representation for , , and quarks and in the adjoint representation for gluons. In proton-proton collisions, the result in Eq. (7) is multiplied by with replaced by [22].
To calculate the results at the hadron level, the parton level yields are convoluted with the leading order DSS [27] fragmentation functions and the integral over impact parameter is calculated within the optical Glauber model. Note that at high in both the -factorization and hybrid formalisms.
2.1.2 IP-Glasma (B. Schenke, S. Schlichting, P. Tribedy and R. Venugopalan)
Several interesting observations in small collision systems ( and Pb) have been made in the high multiplicity events which populate the tails of the respective multiplicity distributions. A first principles explanation of the origin of such events can be obtained in the framework of the CGC approach where high-multiplicity events are attributed to initial-state fluctuations that lead to rare configurations of the parton distribution in the colliding hadrons and nuclei. Detailed properties of the shape of the underlying multiplicity distribution are determined by the mechanism of correlated multiparticle production from the Glasma gluon fields, generated shortly after the collision of high energy hadrons and nuclei. Based on perturbative calculations in this framework, it was shown that multiparticle production leads to a negative binomial distribution with its mean and width related to the saturation scales of the colliding hadrons and nuclei [28]. Beyond the perturbative approach, recent progress in understanding the origin and features of high-multiplicity events has been based on the development of the IP-Glasma model [29]. Multiparticle production in the IP-Glasma model is computed nonperturbatively from the numerical solution of classical Yang-Mills equations. By including different sources of initial-state fluctuations, an accurate description of the experimental multiplicity distribution can be obtained in this framework for a wide range of collision systems [30].
The IP-Glasma model includes different sources of initial state fluctuations such as collision geometry, the position of nucleons in the nucleus, intrinsic fluctuations in the saturation scale and the distribution of color charge density in the nucleons [30, 31]. In particular, the sub-nucleonic color charge fluctuations in the IP-Glasma model are constrained by the saturation scale extracted from the HERA data employing the IP-Sat dipole model [32, 33]. For a detailed discussion on the implementation of the IP-Glasma model, see Refs. [29, 30, 34, 35].
2.2 Event generators
Predictions are reported for two event generators, and .
The first, , is a new version of the well known HIJING generator by Gyulassy and Wang [36]. This version is still in development so some that of the first results calculated with are presented here. Predictions are given for the charged hadron multiplicity distribution in the center of mass frame, charged hadron transverse momentum distributions, and the nuclear suppression factor as a function of transverse momentum at midrapidity for charged hadrons and identified pions, kaons and protons as well as quarkonium and heavy flavor hadrons.
The second, , has been updated since the predictions shown in Refs. [3, 4]. The updates are discussed here and the differences between the calculations of the results at 5 TeV are shown. Predictions are given for the charged hadron multiplicity distribution, both non-diffractive and as a function of centrality, the transverse momentum spectrum at midrapidity, and the elliptic flow moments , and as a function of transverse momentum.
2.2.1 , (G. G. Barnaföldi, G. Bíró, M. Gyulassy, Sz. M. Harangozó, P. Lévai, G. Ma, G. Papp, X.-N. Wang, B.-W. Zhang)
Collaborators from Budapest, Wuhan and Berkeley have developed a new version of the [36] (Heavy Ion Jet INteraction Generator) Monte Carlo model first developed by Gyulassy and Wang: [37]. employs minijets in proton-proton (), proton-nucleus () and nucleus-nucleus () reactions over a wide range of center-of-msas energies, from 5 GeV to a few TeV. The original program was written in FORTRAN since it was based on the FORTRAN version of , [38], as well as the [39] and [40] packages along with the parton distribution function package in the CERN library, [41]. Today, is still the most widely used particle event generator for high-energy heavy-ion collisions both for testing models and for experimental simulations.
The features of the latest FORTRAN version of , version 2.552 [42] with nuclear shadowing [43], were embedded in the new . Because new, novel computational techniques require a shift to more modular programming, the new version of (version 3.1) was written as a genuinely modular C++ Monte Carlo event generator, including the most recent C++ public packages utilized by , (e.g. [44] and the parton distribution library [45]).
Since is based on with the Monash 2013 tune [46] while is based on the FORTRAN version of with the Perugia0 [47] tune, one might expect to see some differences between the two results at the level. Due to the different tunes employed, it is likely that the two results will not completely agree at this level.
It is noteworthy that is suitable for further parallelization, providing faster and more efficient use of new parallel architectures. The development is now at the stage where ‘preliminary’ predictions are possible. Such preliminary redictions are presented in this work, including for light charged particles, and heavy flavor hadrons.
2.2.2 (Z. W. Lin)
The string melting version of A Multi-Phase Transport model, [48], is employed to calculate the yields, spectra, and flow coefficients of charged hadrons produced in Pb collisions at TeV. [48, 49] is a comprehensive transport model that includes fluctuating initial conditions, parton elastic scatterings, hadronization through the Lund string fragmentation or quark coalescence, and hadronic interactions. The string-melting version of the model () [48, 49, 50] converts traditional hadronic strings in the initial state to partonic matter when the energy density in the overlap volume of the collisions is expected to be higher than that for the QCD phase transition. It then uses a quark coalescence model to describe the bulk hadronization of the resultant partonic matter to hadron matter.
The string melting version 2.26t7 [48] uses the same parameters as in earlier studies of Pb+Pb collisions at LHC energies [50, 51]. In particular, Lund string fragmentation is used to generate the initial hadrons before string melting. The parameters and GeV-2 are used for the Lund symmetric splitting function. In addition, the strong coupling constant is fixed at . A parton scattering cross section of 3 mb is employed. Finally, an upper limit of 0.40 is imposed on the relative production of strange to non-strange quarks in Lund string fragmentation. This set of values has been shown [50] to reasonably reproduce the yields, , spectra, and elliptic flow, , of low pions and kaons in central and mid-central Pb+Pb collisions at TeV.
While the parameters listed above have not been tuned to the available 5 TeV Pb data, it is interesting to note that the parameters employed in the previous string melting version, 2.26t1, could reproduce the charged particle yields, , and the elliptic flow coefficients in 5 TeV Pb collisions [3, 4]. However, the charged hadron spectra were too soft [4].
2.3 Perturbative QCD, Collinear Factorization
Here two perturbative QCD calculations assuming collinear factorization, described in more detail in Ref. [3]. are briefly described. Both include isospin effects, the difference from the proton results due to the neutron excess in heavy nuclei, transverse momentum broadening, and nuclear shadowing. However, there are some differences between the calculations.
The leading order calculations by Vitev et al. include cold nuclear matter energy loss, not included in the calculations by Barnaföldi et al.. Also, shadowing is treated differently in the two calculations. Vitev assumes higher-twist dynamical shadowing, a shift of the target momentum fraction to higher , resulting in a suppression of the parton density in the nucleus. The next-to-leading order calculations of Barnaföldi et al. employ data-driven nuclear modifications as a ratio of the parton densities in the nucleus to those in the nucleon such as EPS09.
Vitev et al. provide the nuclear suppression factor as a function of transverse momentum at and for charged hadrons, photons, jets, and heavy flavor mesons. Barnaföldi et al. provide calculations of the transverse momentum distributions and nuclear suppression factor as a function of transverse momentum.
Note that the NLO result by Eskola and collaborators on the charged hadron nuclear suppression factor as a function of transverse momentum, also included, is presented where that result is discussed in the next section but is not described in detail here. That calculation includes isospin and the EPS09 NLO parameterization of the nuclear parton densities.
2.3.1 Cold Nuclear Matter in pQCD (I. Vitev, Z.-B. Kang and H. Xing)
Vitev and collaborators have performed phenomenological calculations including various cold nuclear matter effects on the production of energetic final states in Pb collisions. The ingredients of the calculations, discussed in detail below, include isospin effects, the Cronin effect, cold nuclear matter energy loss and dynamical shadowing. The model was described in more detail in Sec. 2.5 of Ref. [3].
A factorized perturbative QCD approach was used to present predictions for single inclusive particle production in proton-lead collisions, particularly for prompt photon and charged hadron production, heavy flavor production, and inclusive jet production.
Isospin effects The isospin effect can be easily accounted for on average in the parton distribution functions for a nucleus with atomic mass and proton number [52, 53] via
| (8) |
where and are the parton distribution functions (PDFs) of a proton and a neutron, respectively. The isospin effect plays a role in observables that are flavor sensitive, for example photon or inclusive hadron production. Conversely, as will be discussed later, processes dominated by gluons in the initial state, such as jets and heavy flavor, are not significantly affected by isospin. Note that energy loss and dynamical shadowing are applied to the proton and neutron PDFs as described in Eqs. (10) and (11) below.
Cronin effect Theoretical approaches to the Cronin effect are based on multiple parton scattering. Recently, calculations have been performed at backward rapidity based upon a higher-twist approach [54]. Traditionally, multiple scatterings have been resummed [55] and shown to affect particle production cross sections and back-to-back correlations. As a practical implementation, if the parton distribution function has a normalized Gaussian form, random elastic scattering induces further -broadening in the nucleus [56],
| (9) |
where is the transverse component of the parton in the target nucleus, . The values GeV-2, GeV2, and = 1 fm [57] are chosen. These parameter choices can reasonably describe the RHIC data [56]. The Cronin effect is implemented in all calculations in this approach. To explore the effect of a reduced Cronin enhancement, 50% longer scattering lengths, , are also tested. The most recent RHIC results suggest that the Cronin peak is broader and the maximum value of is at a slightly higher than the model suggests. While better fits to existing data can be pursued in the future, it is important to examine the possible effect of initial-state multiple scattering on the production of hard probes at 8.16 TeV at the LHC.
Cold nuclear matter initial-state energy loss When a parton from the proton undergoes multiple scattering in the nucleus before the hard collision, it can lose energy due to medium-induced gluon bremsstrahlung. This effect can be easily implemented through a shift in the momentum fraction in the projectile proton PDFs,
| (10) |
where is the parton momentum fraction of the proton projectile. The energy loss considered in these calculations is the high-energy limit of the Bertsch-Gunion approach [58]. Multiple gluon emission, , reduces the effect of the mean energy loss. This is implemented through the relation . The mean energy loss depends on the momentum transfer per interaction, , between the parton and the medium and the gluon mean-free path, . These parameters, constrained by Drell-Yan data [59], were and found to be GeV and fm. Incidentally, these values of and also describe the Cronin effect given in Eq. (9) above. Enhanced and reduced levels of energy loss were also considered, see Ref. [60]. Larger CNM energy loss is disfavored, especially by minimum bias jet data.
Dynamical shadowing Final-sate coherent scattering of the struck partons leads to higher-twist shadowing in the observed cross section [61]. This effect is included through a modification of the momentum fraction of the target nuclear PDFs,
| (11) |
where is the parton momentum fraction in the target nucleus and or for final-state parton or in the partonic scattering . Here is a characteristic energy scale of the multiple scattering with GeV2. Resummed coherent power corrections are only relevant at low .
2.3.2 (G. G. Barnaföldi, G. Bíró, Sz. M. Harangozó, P. Lévai, G. Papp)
The NLO code is based on a phenomenologically enhanced, perturbative QCD improved parton model [62, 63] described in some detail in Sec. 2.6 of Ref. [3]. The model includes a phenomenologically-generalized parton distribution function in order to handle nonperturbative effects at relatively low and small . Similar to [36], multiple scattering in the nucleus is described by the broadening of the initial intrinsic transverse momenta of the incoming particles, . The broadening appears as a phenomenological parameter in the calculations and mimics nonperturbative effects. The value of the intrinsic can be determined from data obtained over a wide energy range of nucleon-nucleon (predominantly ) collisions. It was found to be GeV2.
In this model, the factorization and renormalization scales are fixed by the momentum of the intermediate jet, with . The fragmentation scale is connected to the final momentum of the hadron, . In all cases, the factor multiplying the momentum scale is set to . The baseline proton parton distribution functions used in the calculations, assuming collinear factorization, is the MRST central gluon set, MRST-cg [64]. The KKP fragmentation functions [65] are employed for the hadronization process. Both MRST-cg and KKP are applicable starting from a relatively low squared momentum transfer GeV2. Thus these calculations are applicable down to GeV.
As in Refs. [3, 66, 67], the initial-state nuclear effects included in proton-nucleus or nucleus-nucleus collisions are multiple scattering and shadowing. Intrinsic transverse momentum broadening via semihard collisions is related to multiple scattering in this approach. For typical large nuclei there are three to four semihard collisions. The average broadening per collision in the nucleus is GeV2, independent of . The only initial-state energy dependence arises through the average transverse momentum in , , so that the same broadening due to multiple scattering applies for collisions from SPS to LHC energies. The model gives a Cronin peak [68, 69] in the intermediate range, GeV.
Nuclear shadowing is introduced by modifying the PDFs in the nuclear environment via a parameterization such as those in Refs. [43, 70]. Shadowing and isospin effects were previously taken into account on average using a scale-independent parameterization of the shadowing function, , adopted from Ref. [43].
In the present work, the results shown are obtained with the [43] and EPS09 NLO [70] shadowing parameterizations. Because EPS09 exhibits strong gluon antishadowing, replicating the Cronin effect – albeit in the wrong position and with slower -scaling – without multiple scattering to avoid double counting the Cronin effect, the strength of the transverse momentum broadening due to multiple scattering is reduced when this set is used. No reduction in multiple scattering is required for the shadowing parameterization because it does not include antishadowing.
3 Charged particle results
Here the results for charged particle production, calculated using the approaches described in the previous section, are presented.
3.1 Multiplicity distribution (, , rcBK, bCGC and IP-Glasma)
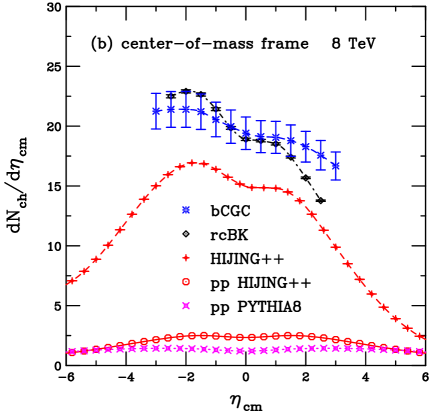
Results for the charged hadron multiplicity distribution from , , and the rcBK calculations by Albacete and Dumitru are shown here. A calculation of the probability for inelastic parton-parton interactions as a function of the charged hadron multiplicity from the IP-Glasma approach is also shown.
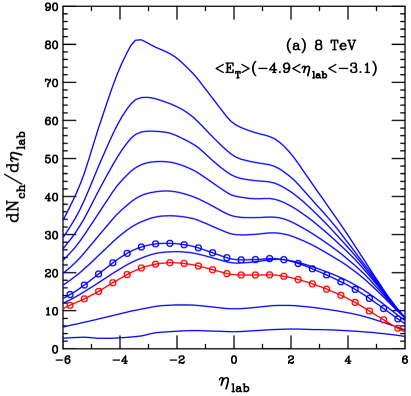
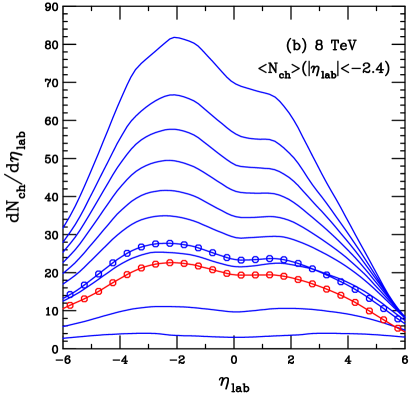
The result is calculated in the laboratory frame. The rcBK and calculation is given in both frames. The event generator results are given over all phase space while the rcBK and calculations are given for . The results are separated into two different panels, one for each reference frame.
In Ref. [3], it was explained that the bCGC calculations of Rezaeian [71] and the rcBK calculations of Albacete et al. [72] depended on the minijet mass which, in turn, affects the transformation between rapidity, for identified particles, and pseudorapidity, for unidentified charged particles. In Ref. [4], Albacete and Dumitru demonstrated that depends strongly on the transformation. The rcBK calculation depends on the Jacobian of this transformation which is not uniquely defined in the CGC framework. It is necessary to assume a fixed minijet mass, related to the pre-hadronization/fragmentation stage. In Ref. [3], they assumed the same transformation for and Pb collisions. A Jacobian with the hadron momentum modified by gave very good agreement with the ALICE 5.02 TeV charged hadron multiplicity distribution [4]. The results were unchanged in the proton direction but modified in the direction of the lead beam. The difference shows the sensitivity of this result to the mean mass and of the unidentified final-state hadrons. The results with the modified hadron momentum, as in Ref. [4], are given in Fig. 1.
The results for the charged-particle pseudorapidity density in non-single diffractive Pb collisions calculated by Rezaeian are given in the center of mass frame. The boost from the laboratory frame to the center of mass frame was accomplished by adding a rapidity shift of . The details of calculation can be found in Ref. [73]. The results are based on -factorization [26] and the bCGC saturation model [71, 74, 75, 76, 77, 78].
The free parameters of the bCGC model were determined by a fit to the small- HERA data, including experimental data from diffractive vector meson production [79, 80]. In the -factorization approach, one needs to rewrite the rapidity distribution in terms of pseudorapidity using the Jacobian of rapidity-pseudorapidity transformation [71, 73, 74, 75, 76, 77, 78]. As described previously, the Jacobian depends on the minijet mass . The shape of strongly depends on both and the Jacobian [73]. The main theoretical uncertainties in the bCGC approach come from fitting both the -factor and the minijet mass to RHIC data [81, 82] in minimum-bias collisions. The RHIC data alone are not enough to uniquely fix the value of . It was found that MeV gives the best description of RHIC and also describes the ALICE data within a uncertainty [73]. The value of is similar to current quark mass.
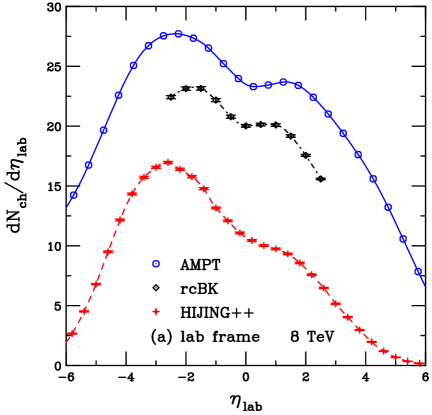
In the lab frame, the result is about 15% higher than the rcBK calculation at . The two shapes are very similar in the forward, proton, direction but at backward the lead peak is narrower in the rcBK calculation. The result is nearly a factor of two lower than the rcBK calculation at but the peak is shifted slightly backward relative to the and rcBK results.
On the other hand, in the center of mass frame, the rcBK calculation is % higher than the Pb calculation. There are also significant differences in the shapes. In Fig. 1, MeV was used to calculate at 8 TeV in the bCGC approach, as also assumed for the 5.02 TeV calculations. The band on the bCGC calculation shows the theoretical uncertainty of due to the variation of around its central value while still remaining consistent with the RHIC and ALICE data, see Ref. [73].
The rcBK calculation gives more enhancement in the lead direction than the calculation. The bCGC result by Rezaeian is similar in magnitude to the rcBK calculation by Albacete and Dumitru but flatter in shape with a smaller enhancement in the lead direction and a milder decrease with in the proton direction.
Also shown are the results at the same energy obtained using and [44] with the Monash 2013 tune [46]. Here the center of mass and laboratory frames coincide. The results are shown in the center of mass frame in Fig. 1(b). The difference between the two generators on the level arises from the different tunes and minijet production, which acts up to the minijet cutoff. The minijet contribution enhances the spectra, especially at midrapidity.
The IP-Glasma model is now employed to compare multiplicity distributions in collisions at 7 TeV and Pb collisions at 5.02 TeV to experimental measurements and predict the multiplicity distribution for Pb collisions at 8 TeV. In the calculations, approximately 30K IP-Glasma events are generated for each collision system by uniformly sampling the impact parameter in the range from to ( fm for and 10 fm for Pb) and computing the interaction probability, , for each event,
| (12) |
where is the nucleon-nucleon interaction cross section for each center of mass energy, , and is the collisional overlap area computed on the basis of individual nucleon-nucleon collisions, defined as
| (13) |
Here, denote the nucleon thickness functions, parameterized as
| (14) |
with the characteristic size scale GeV-2 extracted from fits to the diffractive HERA data [32, 33].
Event-by-event multiparticle production is computed nonperturbatively from classical-statistical real-time lattice simulations on lattices with a spacing of 0.02 fm [34]. Based on the solutions of the classical Yang-Mills equations, the single inclusive gluon spectrum, , is extracted from correlation functions of the gauge fields after the collision [83, 84]. By integrating the gluon spectrum over the range of transverse momenta GeV, the overall gluon multiplicity is obtained for each event. Based on the CGC+Lund event generator [35], matching the IP-Glasma model of multiparticle production to the Lund string fragmentation model implemented in , Ref. [35] demonstrated that including fragmentation effects does not significantly affect the shape of the multiplicity distribution. Specifically, the multiplicity distribution is well approximated by , such that an estimate of the charged particle multiplicity distribution can be obtained directly by assuming is proportional to .
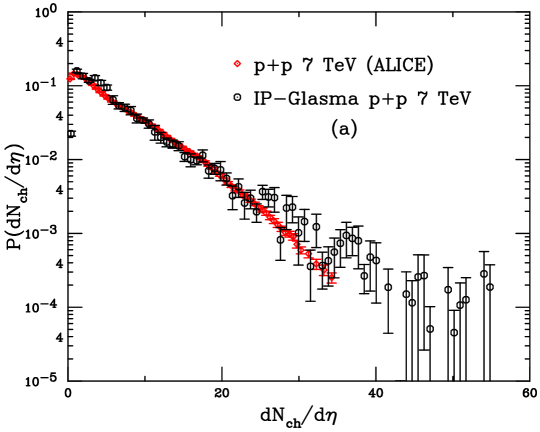
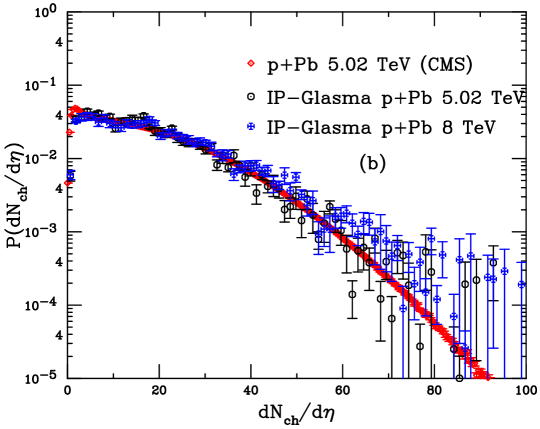
The results for the multiplicity distributions of charged hadrons with the IP-Glasma model are shown in Fig. 2. The multiplicity distributions are compared to the available data from ALICE [85] in collisions at 7 TeV and from CMS [86] in Pb collisions at 5.02 TeV. On the same plot, the IP-Glasma predictions for 8 TeV Pb collisions are also shown. The most important prediction is that no significant change in the multiplicity distribution is expected between Pb collisions at 5.02 TeV and 8 TeV.
3.1.1 Centrality Dependence of
Results for the centrality dependence of in the laboratory frame calculated with are shown here.
Table 1 gives information on the different centrality classes of Pb events at 8 TeV from the model, including the average, minimum and maximum impact parameter values, the average number of participant nucleons in the Pb nucleus per event, , and the average number of inelastic participant nucleons in the Pb nucleus per event, . The results are given for the ATLAS centrality criteria where the average transverse energy per event in the lead-going direction, in [87], are also shown. Diffractive events are excluded. Thus the results are non-diffractive events. The difference in rapidity of the proton beam in the lab frame and in the center-of-mass frame is .
| Centrality | (fm) | (fm) | (fm) | (GeV) | ||
| TeV | ||||||
| All | 5.72 | 0.0 | 13.2 | 8.64 | 6.11 | 47.9 |
| 0-1% | 2.93 | 0.1 | 6.7 | 19.84 | 15.42 | 158.4 |
| 1-5% | 3.20 | 0.0 | 8.0 | 17.85 | 13.54 | 125.4 |
| 5-10% | 3.47 | 0.0 | 8.2 | 16.38 | 12.20 | 105.3 |
| 10-20% | 3.79 | 0.0 | 8.7 | 14.84 | 10.82 | 87.9 |
| 20-30% | 4.22 | 0.0 | 9.9 | 13.03 | 9.26 | 71.8 |
| 30-40% | 4.70 | 0.0 | 11.1 | 11.21 | 7.80 | 58.7 |
| 40-60% | 5.63 | 0.1 | 12.1 | 8.22 | 5.55 | 41.4 |
| 60-90% | 7.24 | 0.1 | 13.2 | 3.88 | 2.58 | 18.1 |
| 90-100% | 8.17 | 2.2 | 13.2 | 1.95 | 1.28 | 5.2 |
| TeV | ||||||
| All | 5.62 | 0.0 | 13.2 | 8.01 | 5.76 | 35.7 |
| 0-1% | 2.84 | 0.1 | 6.5 | 18.73 | 14.92 | 118.1 |
| 1-5% | 3.13 | 0.0 | 7.1 | 16.74 | 13.00 | 92.9 |
| 5-10% | 3.39 | 0.1 | 7.7 | 15.17 | 11.56 | 77.6 |
| 10-20% | 3.73 | 0.0 | 8.6 | 13.67 | 10.15 | 64.7 |
| 20-30% | 4.18 | 0.0 | 9.0 | 11.92 | 8.62 | 52.7 |
| 30-40% | 4.66 | 0.1 | 10.1 | 10.24 | 7.22 | 43.0 |
| 40-60% | 5.55 | 0.0 | 12.5 | 7.57 | 5.20 | 30.6 |
| 60-90% | 7.12 | 0.1 | 13.2 | 3.68 | 2.48 | 14.3 |
| 90-100% | 7.98 | 0.3 | 13.2 | 1.96 | 1.27 | 4.6 |
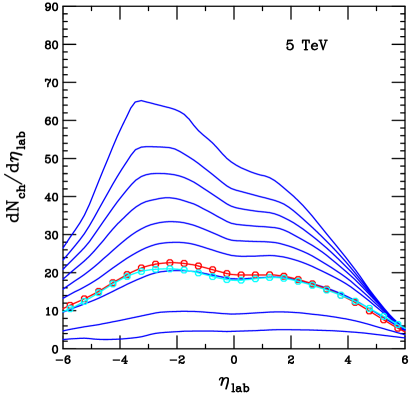
Figure 3(a) shows the results for at the tabulated centralities in the laboratory frame for non-diffractive events in Pb collisions at 8 TeV. The result for all non-diffractive events at 5 TeV, also calculated with the same version of , version 2.26t7, is given by the red line for comparison. The overall increase of multiplicity at 8 TeV is clearly visible.
Because the flow coefficients are shown for the CMS centrality criteria, based on the number of charged hadrons at central rapidity, , the charged particle pseudorapidity distributions are also shown at 8 TeV for this centrality definition in Fig. 3(b). Note that the distributions based on the central rapidity criteria are shifted forward for the most central bins, (0-1)%, (1-5)% and (5-10)% in particular, as well as for the most peripheral bin, (90-100)%. However, the distributions for the two different centrality definitions in the mid-central and mid-peripheral centrality bins match rather well. The centrality classes for this critera are given in Table 2. Although the distributions are clearly shifted, the average number of participants changes no more than 5% in the most central bins while the difference in the semi-central bins is even smaller.
| Centrality | (fm) | (fm) | (fm) | |||
|---|---|---|---|---|---|---|
| All | 5.72 | 0.0 | 13.2 | 8.64 | 6.11 | 118.4 |
| 0-1% | 3.24 | 0.0 | 7.1 | 18.95 | 14.70 | 343.6 |
| 1-5% | 3.45 | 0.0 | 8.1 | 17.20 | 13.01 | 280.5 |
| 5-10% | 3.64 | 0.1 | 9.5 | 15.91 | 11.82 | 242.0 |
| 10-20% | 3.90 | 0.0 | 9.0 | 14.53 | 10.59 | 207.8 |
| 20-30% | 4.26 | 0.0 | 9.7 | 12.96 | 9.24 | 175.5 |
| 30-40% | 4.66 | 0.0 | 11.6 | 11.36 | 7.93 | 148.2 |
| 40-60% | 5.50 | 0.0 | 12.2 | 8.58 | 5.82 | 109.9 |
| 60-90% | 7.18 | 0.1 | 13.2 | 3.98 | 2.64 | 49.9 |
| 90-100% | 8.29 | 1.9 | 13.2 | 1.74 | 1.16 | 15.8 |
The results at 5 TeV for different centralities of non-diffractive events with the current version of are shown in Fig. 4. For comparison, the previous prediction for minimum-bias events at 5 TeV, obtained with version 2.26t1 [3], is also shown. The same centrality definition as in Fig. 3(a), based on the ATLAS criteria, is used here. It is clear that the distribution of non-diffractive events is somewhat higher. Note that the 5 TeV result presented in Ref. [3] was for minimum-bias collisions, including diffractive events. In addition, different values of the Lund fragmentation parameters, strong coupling constant, and parton cross section were used.
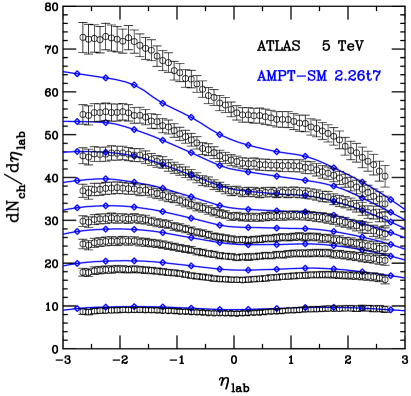
In Ref. [4], calculations from the default model were compared to the ATLAS data [87]. The calculations used the same centrality bins as the experiment, the same as that given here. When compared to the data, the prior version of showed the same inflection point near midrapidity but tended to underestimate the multiplicity in the most central collisions. The comparison of the current version to the same data in Fig. 5 show a similar level of agreement. Note, however, that the curvature of the calculations in the lead-going direction is more similar to the data in the new version.
3.2 Transverse Momentum distributions
Here the transverse momentum distributions are presented. First, results are shown for charged hadrons from and . Next, the pion, kaon and proton distributions from are given. The pion results are compared to the and results for charged hadrons in and Pb collisions.
3.2.1 Charged and identified hadron distributions (, )
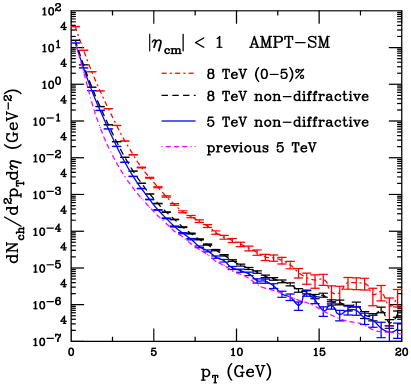
Figure 6 shows the -spectra of charged hadrons per collision within the center of mass pseudorapidity range for all non-diffractive events and also for the top 5% centrality at 8 TeV from . Also shown are the current result for non-diffractive events at 5 TeV (obtained with the string melting version 2.26t7) and the previous prediction [3, 4] for minimum-bias events at 5 TeV (obtained with the string melting version 2.26t1). Note that the uncertainties shown are only statistical. The spectrum at 8 TeV is obviously harder than that at 5 TeV. The current 5 TeV spectrum for non-diffractive events is enhanced in the intermediate range, GeV, relative to the previous prediction for minimum-bias events. This is mainly due to the small value of the Lund parameter, , used in the current parameter set. The smaller value of leads to a higher effective string tension and a harder -spectrum for initial hadrons [50].
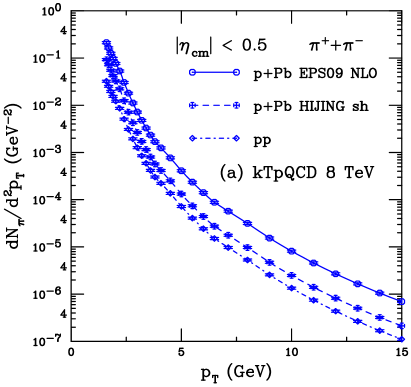
The predicted spectrum from for charge-averaged pions, , is presented in Fig. 7(a), calculated at TeV in and Pb collisions. The [43] shadowing parameterization is stronger than EPS09 NLO [70]. The difference is significant. Indeed the Pb result with the shadowing parameterization is more compatible with the calculation in than the Pb result with the EPS09 NLO shadowing parameterization. Note that these results are shown for GeV. The Pb calculations are for minimum bias collisions.
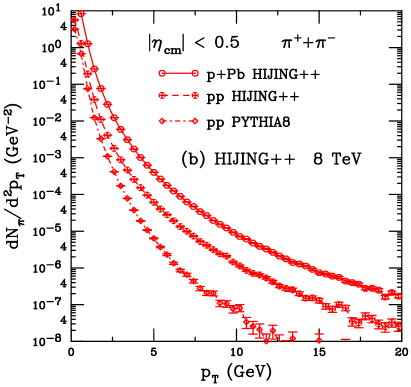
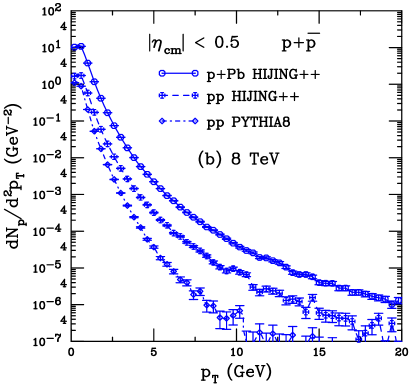
The result is shown in Fig. 7(b) for GeV. These calculations were done at 8.16 TeV. The upper curve is the Pb result for minimum bias collisions. The results with and are also shown. It is clear that the difference between the results for and is large and increasing with .
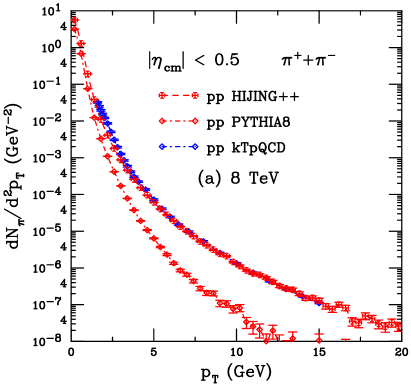
Given the difference in the results, for comparison, the calculation with is shown with the and curves in Fig. 8(a). The perturbative QCD result is in very good agreement with the calculation even though the two calculations were done at slightly different energies, 8 TeV for and 8.16 TeV for and . The Monash 2013 tune for seems to considerably soften the dependence of light hadron production.
The Pb result for is also compared with the calculation in Fig. 8(b). Of the two results, the one including the shadowing parameterization is shown since this parameterization is also included in . Again, the difference in the two results is small.
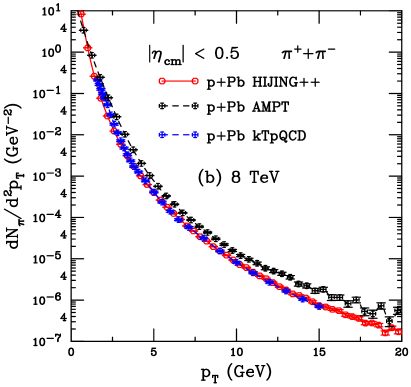
The non-diffractive result at 8 TeV for charged hadrons is also included in the figure. There are several differences between the two generator calculations. is given in the central rapidity bin, , for charged pions while the result is for charged hadrons in a broader bin, . Since the charged hadron result is dominated by pion production and the rapidity bin widths are divided out, these differences should be negligible. The largest difference is likely the overall normalization since gives a considerably larger -integrated multiplicity at midrapidity than does . On a logarithmic scale, these differences are rather small. Thus the two results are compatible over a broad range of , with the result becoming somewhat harder for GeV but, overall, the comparison is good.
Finally, the results for charged kaons and protons plus antiprotons are shown in Fig. 9. The corresponding results with and with the Monash 2013 tune are also given. The same difference in the distributions is observed in these cases as well. Statistical uncertainties, which become larger for the more massive light hadrons, are shown.

3.3 Nuclear Suppression Factor
In this section, calculations of the nuclear suppression factor are presented. Results are shown first at midrapidity for charged hadrons. The calculations include initial-state shadowing by Eskola et al., cold nuclear matter by Vitev et al., the rcBK results by Lappi and Mäntysaari and Rezaeian, the result with two different shadowing parameterizations, and . The suppression factor for identified pions, kaons and protons are also shown at midrapidity. Finally, the calculations by Vitev et al. and by Lappi and Mäntysaari are shown at forward rapidity.
3.3.1 for charged hadrons at
EPS09 (K. J. Eskola, I. Helenius, H. Paukkunen)
The first CMS result for the minimum-bias charged-hadron nuclear modification factor () at TeV showed an enhancement of % at GeV [89]. Such an enhancement would clearly be too large to be accommodated by a DGLAP-based nPDF analysis and would thus suggest a violation of factorization of the nuclear effects at high . A similar behavior was also seen in the first ATLAS measurement [90] (with some cuts on centrality) but in their published result [91] the reach is restricted to GeV. However, the measurement from ALICE [92] was consistent with unity for GeV. For these early measurements no baseline measurement was available at the same collision energy. During 2015 a short run was performed at the LHC with TeV providing a directly measured baseline for . Indeed, the new CMS measurement of the [93] show only a moderate enhancement (20% at most), consistent with the nPDF-based calculation when all uncertainties are accounted for. Regarding the relevance of the charged-hadron baseline calculation (and hence also the ratio ), the independent fragmentation picture is expected to work in the region GeV where the scale dependence of the computed cross sections is modest and where nonperturbative and/or higher-twist effects can be expected to remain small [94].

Figure 10 shows the EPS09-based prediction of the nuclear modification factor for charged hadron production in +Pb collisions at TeV at midrapidity () as a function of . The calculational framework is the same as in Refs. [4, 95]. The next-to-leading order (NLO) calculations are performed with the Incnlo code [96] using the CT10 free proton PDFs [97] and EPS09 NLO nuclear modifications [70]. Three different parton-to-hadron fragmentation functions are employed: Kretzer [98], KKP [99] and DSS [100].
The theoretical uncertainties related to scale variations and the proton PDFs cancel out almost completely in this ratio so that only uncertainties originating from the EPS09 NLO sets are considered. Also, while the differences between the fragmentation functions are large [94], they also cancel in the ratio. The behavior is very similar at TeV: some suppression due to shadowing is seen at small values of which turns into a small enhancement above GeV following from the antishadowing in EPS09 NLO.
Very recently the first nPDF analysis also including data from the LHC, EPPS16, was completed [5]. The central result is very similar to the EPS09 NLO fit but, due to increased freedom in the parameterization and the lack of additional weights on certain data sets, the uncertainties are larger. This will result in a somewhat wider uncertainty band than that shown in Fig. 10.
Other approaches
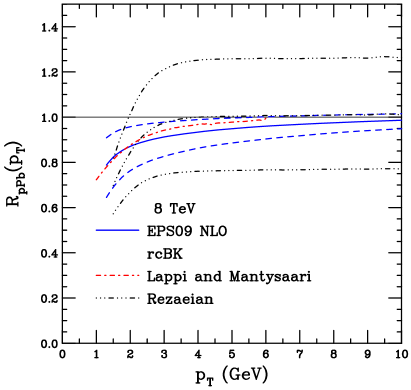
Figure 11 compares the EPS09 NLO central calculation from Fig. 10 with the rcBK results at by Lappi and Mäntysaari (red curves) and Rezaeian (black curves). In the calculations by Lappi and Mäntysaari, the generalization to nuclei is done using the optical Glauber model, as discussed in Sec. 2.1.1 and the nuclear saturation scale is not a free parameter. The calculations by Rezaeian are obtained using the hybrid CGC formalism at leading-order [101] and the solutions of the rcBK evolution equation [102]. The details of these calculations can be found in Ref. [73]. The average initial saturation scale for the nucleus was with the range of constrained to in Ref. [73]. The preferred value, , corresponds to the average value of extracted from other reactions [73]. However, the exact value of cannot be determined in the leading-order approximation [103]. Moreover, the experimental data at small are not sufficient to uniquely fix the initial value of the rcBK evolution equation via a fit [73]. Therefore, the freedom to choose in the hybrid factorization formalism introduces rather large uncertainties [103]. The LHC data for at 5.02 TeV seem to rule out a strong Cronin-type peak. If this feature of the data is verified at higher energy and thus lower , it can be considered as important evidence in favor of small evolution effects at the LHC [73]. Note the average number of binary collisions was assumed to be [104]. To compare with the LHC data at 8 TeV, the curves can be rescaled with the experimental value of .
In the common range shown, the rcBK result is quite similar to that of EPS09 NLO at low but rises toward unity somewhat faster. Due to the uncertainty in the value of in Rezaeian’s calculation, that band, although narrower than at 5.02 TeV, encompasses the EPS09 NLO band and the Lappi and Mäntysaari calculations for GeV.
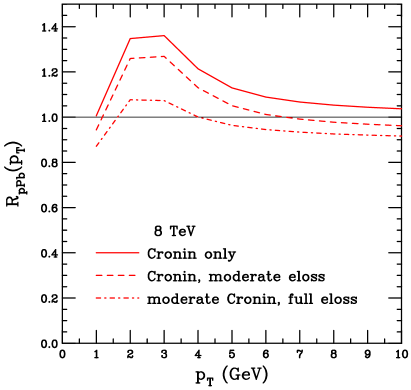
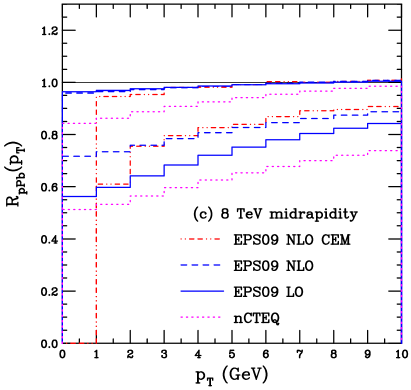
The calculations by Vitev et al. shown in Fig. 12, on the other hand, all show an enhancement peaking at GeV. The largest enhancement is with only Cronin broadening. In this case, does not drop below unity for GeV. If the Cronin enhancement is unchanged but moderate energy loss, with the gluon mean-free path enhanced 50% over the 1 fm default value, is included, the enhancement is somewhat reduced. The smallest enhancement comes when the default Cronin effect is reduced by a factor of two, increasing the scattering length from 1 fm to 1.5 fm, while the default energy loss in cold matter, with a gluon mean-free path of 1 fm, is used. In this case, the ratio is less than unity for GeV.
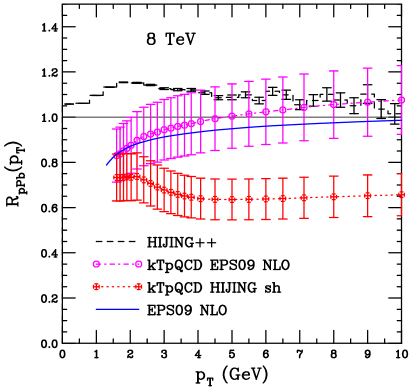
The nuclear modification factors for and for charged hadrons are shown in Fig. 13. The baseline for the calculation is calculated with and not . As is the case for the cold matter pQCD calculation by Vitev et al. shown in Fig. 12, the result is larger than unity over the range shown. It shows an enhancement at GeV comparable to the dot-dashed curve by Vitev et al. with moderate Cronin and default energy loss. On the other hand, the calculations show significant suppression at low . These calculations include an estimated 10% uncertainty band to account for uncertainties on the underlying proton parton density, scale dependence of the perturbative calculation, and the fragmentation function. Note that the central EPS09 NLO set is used in . The nuclear PDF uncertainties are not included in the uncertainty band shown. The result is directly compared to the central EPS09 NLO calculation. The two calculations agree within the model uncertainties although the central result increases to already at GeV due to the multiple scattering included in this model. On the other hand, the calculation with the shadowing parameterization decreases with and seems to saturate for GeV. The two results only overlap for GeV.
3.3.2 of Identified Particles at
Figure 14 shows the calculations of for charged pions, charged kaons and protons+antiprotons formed from the Pb and calculations with in Figs. 7 and 9. The trend for all three is similar to that for charged hadrons. The ratio has a somewhat larger enhancement than for and in the range GeV. At higher , statistical uncertainties become too large for a meaningful separation.
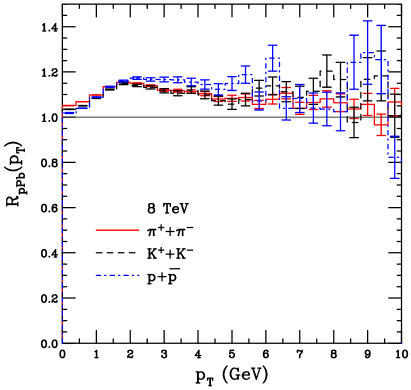
Recent experimental measurements of identified particle multiplicities in Pb collisions [105, 106] have raised the possibility that an onset of Cronin-like enhancement might also arise form a common radial flow-like boost [107]. The effect is more pronounced on particles of larger mass, such as and in comparison to . For a quantitative study and discussion of this phenomenon in the framework of the event generator EPOS, see Ref. [108]. Without radial flow in , there is an enhancement, as is also apparent for charged hadrons in Fig. 13, but it has no significant mass dependence.
3.3.3 at
Two results are shown here, the CGC calculation by Lappi and Mäntysaari and the collinear factorization calculation of cold nuclear matter by Vitev et al..
CGC
The nuclear suppression factor is calculated at midrapidity using factorization while at forward rapidities, , and 5, the hybrid formalism is employed. (See Ref. [22] for a more detailed comparison of the methods). The results are presented for minimum bias collisions only as the centrality classes from the Optical Glauber model can not be expected to match experimental centrality classes defined using multiplicity distributions. (See also the discussion in Ref. [109]). The predictions for , 4 and 5 are shown in Fig. 15.
It is emphasized that, in this calculation, there are no free nuclear parameters except the standard Woods-Saxon distribution. Thus these results are predictions based only on HERA DIS data. They show strong suppression for the rcBK calculation at . The suppression factor decreases with increasing , thus the smaller region at larger results in greater suppression.
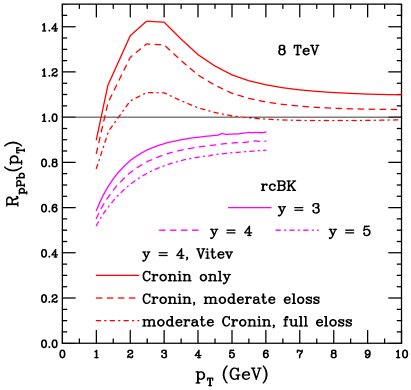
Perturbative QCD
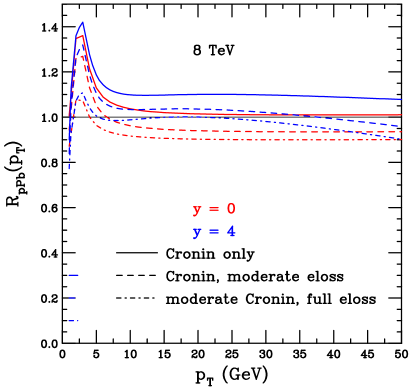
The calculations by Vitev et al. at are also shown in Fig. 15. The results are somewhat higher than those at in the range shown. The Cronin effect is slightly enhanced because, at higher rapidity, the distribution is more steeply falling so that, while is decreasing, the multiple scattering remains the same, leading to a somewhat larger enhancement at low . This effect alone causes the Cronin-only curves at to be above those at midrapidity. However, when energy loss is included, the effect at forward rapidity is slightly stronger than at because the projectile values are larger at forward rapidity. At intermediate , the results for are above those at but the effect becomes stronger at larger since the distribution decreases faster at high , eventually causing the high results to drop below those at midrapidity. The higher-twist dynamical shadowing plays a negligible role at high , even at , because, for massless particles, the dependence in Eq. (11) results in a decrease in the shadowing effect as , causing it to become negligible for GeV. The difference in the two calculations at and are shown in Fig. 16 where the dependence is extended to GeV to emphasize the difference between the results for the two rapidities at higher .
3.3.4 Flow Coefficients
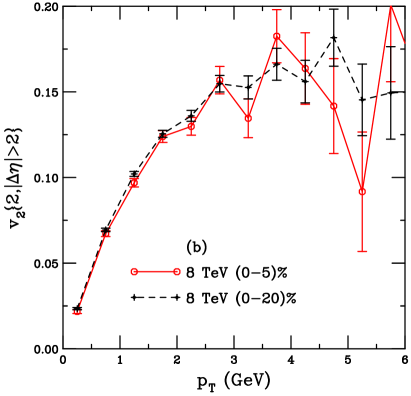
The -dependence of the anisotropy harmonics with , and 4 shown here follows the analysis method of the CMS collaboration [110] where
| (15) |
The coefficients are calculated as [111], where denotes averaging over different charged hadron pairs in each event and then averaging over those events. Both particles in a pair need to be within and have a minimum separation of 2 units. The transverse momentum of the reference particle is within GeV. was used earlier to study these observables in Pb collisions at 5 TeV and direct comparisons with the 5 TeV and data have shown good overall agreement [112].
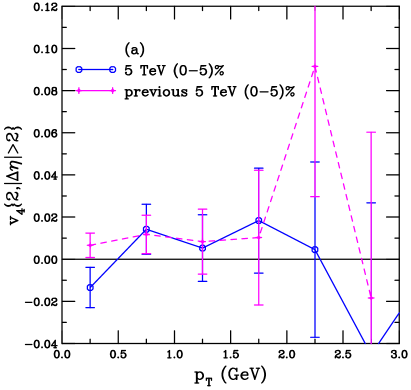
Figures 17-19 show the anisotropy harmonics for and 4 respectively, calculated with the two-particle correlation method described above. Results for the top 5% centrality 5 TeV Pb collisions from version 2.26t7 in this study and from the previous prediction compilation [4] using version 2.26t1 are shown in Figs. 17(a)-19(a). Results for the top 5% centrality and top 20% centrality 8 TeV Pb events are given in Figs. 17(b)-19(b).
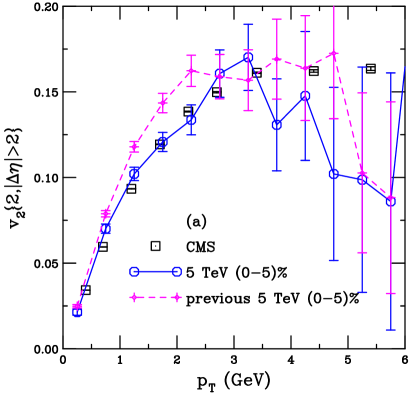
In Figs. 17(a) and 18(a), the CMS 5.02 TeV Pb and data are shown for the CMS centrality cut, , given in Ref. [113]. The results shown in the magenta curves in these figures, labeled “previous 5 TeV (0-5)%”, employ the same centrality definition as in Refs. [3, 4], the number of charged particles in the pseudorapidity window .
As noted in Ref. [4], this centrality definition is not identical to that of CMS [113]. Instead, the CMS criteria roughly corresponds to % centrality while the results shown in Figs. 17(a)-19(a) are for a % centrality cut at 5 TeV. Thus, the comparison to data here, as in Ref. [4] is inexact. However, as was also shown in Ref. [4], the differences in the flow coefficients between the (0-5)% and (0-20)% centrality bins was not large. The difference between the centrality selection and that of the CMS data is therefore likely within the uncertainties of the 5 TeV calculations.
| Centrality | (fm) | (fm) | (fm) | |||
| TeV | ||||||
| All | 5.72 | 0.0 | 13.2 | 8.64 | 6.11 | 118.4 |
| 0-5% | 3.41 | 0.0 | 8.1 | 17.55 | 13.35 | 293.1 |
| 0-20% | 3.71 | 0.0 | 9.5 | 15.63 | 11.59 | 237.7 |
| TeV | ||||||
| All | 5.62 | 0.0 | 13.2 | 8.01 | 5.76 | 97.2 |
| 0-5% | 3.37 | 0.0 | 7.7 | 16.26 | 12.64 | 243.2 |
| 0-20% | 3.67 | 0.0 | 9.3 | 14.42 | 10.91 | 195.4 |
In the new 5 TeV calculations and the 8 TeV calculations, shown in Figs. 17-19, the centrality selection is closer to the CMS acceptance at central rapidity, . The characteristics of the 5 and 8 TeV Pb collisions in the centrality bins shown in this section are given in Table 3. Note that the broader centrality definition here than that in Ref. [4] scales the average number of charged hadrons approximately with the pseudorapidity region while the average number of participants, both in all collisions and in the inelastic collisions, remains relatively constant.
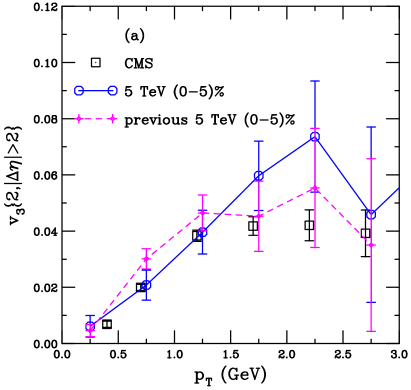
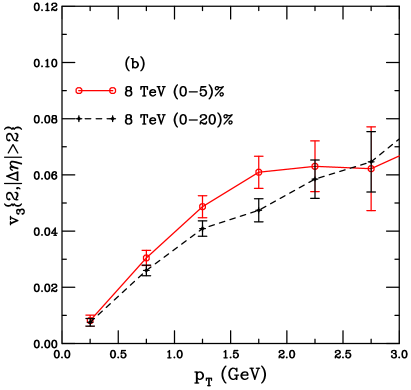
Figure 17(a) compares the 5 TeV results on elliptic flow, , from version 2.26t1 (labeled previous 5 TeV) and the updated version 2.26t7 with the CMS data [113]. The new version of gives a lower , in better agreement with the CMS data, albeit for a slightly different centrality cut, as described above. However, for GeV, the lower statistics of the 5 TeV calculations do not allow one to distinguish between the results. Figure 17(b) shows that the elliptic flow at 8 TeV for the top 5% centrality is similar to that for the top 20% centrality. The dependence of at 8 TeV is also very similar to the result for the top 5% centrality at 5 TeV with version 2.26t7.
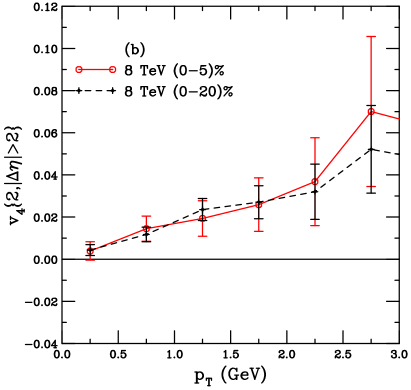
The trends shown in Fig. 18(a) at 8 TeV are similar to those in Fig. 17(a) at 5 TeV. The updated calculation gives lower at low , in better agreement with the CMS data. In addition, Figs. 18-19 show that at 8 TeV and for the top 5% centrality are not very different from those for the top 20% centrality. The magnitudes of and at 8 TeV trend somewhat higher than those at 5 TeV for the top 5% centrality with version 2.26t7. However, the statistical uncertainties at the lower energy, especially those on version 2.26t1, shown in Ref. [4], are rather large.
4 Quarkonium and heavy flavor (F. Arleo, G. G. Barnaföldi, G. Bíró, B. Ducloué, E. Ferreiro, M. Gyulassy, Sz. M. Harangozó, Z.-B. Kang, J.-P. Lansberg, T. Lappi, P. Lévai, G. Ma, Y.-Q. Ma, H. Mäntysaari, G. Papp, H.-S. Shao, I. Vitev, R. Venugopalan, R. Vogt, H. Xing, X.-N. Wang, B.-W. Zhang, H.-F. Zhang)
Here, calculations of prompt quarkonium and heavy flavor hadrons are presented together with the hidden heavy flavor hadron production described first. The quarkonium calculations include shadowing in the color evaporation model (Vogt), a data driven approach studying the effect of shadowing on best-fit results from proton-proton collisions (Lansberg and Shao), final-state energy loss (Arleo), comover suppression (Ferreiro) and saturation effects (Ducloué et al. and Y.-Q. Ma et al.). The heavy flavor calculations include the cold matter energy loss approach of Vitev et al. and the data-driven shadowing calculations of Lansberg and Shao. In addition preliminary calculations, based on the same model described in Sec. 2.2.1 are also shown. However, in this case, heavy flavor decays and the associated resonances decays were turned off.
4.1 Quarkonium
The model calculations for prompt quarkonium production are described here, first for those calculations based on collinear factorization, including comovers, and then for the saturation approaches.
4.1.1 Collinear Factorization
EPS09 NLO in the Color Evaporation Model (R. Vogt)
The predictions for the quarkonium nuclear suppression factor, considering only shadowing effects on the parton densities are described here. The results are obtained in the color evaporation model (CEM) at next-to-leading order in the total cross section. In the CEM, the quarkonium production cross section is some fraction, , of all pairs below the threshold where is the lowest mass heavy-flavor hadron,
| (16) |
where or and is the subprocess cross section at LO. At NLO, includes and processes and an additional light parton, , is emitted in the final state, . The normalization factor is fit to the forward (integrated over ) cross section data on only , Be, Li, C, and Si targets. In this way, uncertainties due to ignoring any cold nuclear matter effects, which are on the order of a few percent in light targets, are avoided. The fits are restricted to the forward cross sections only.
The same values of the central charm quark mass and scale parameters are employed as those found in the fits to the open charm total cross section, GeV, , and [114]. For the CEM calculation, the scales and are defined as proportional to the transverse mass instead of the quark mass. The normalization is obtained for the central set, . The calculations of the mass and scale uncertainties are multiplied by the same value of to obtain the extent of the uncertainty band [114]. The results here are based on those of Ref. [115] but extended to 8 TeV. For these calculations, instead of defining and relative to the quark mass, as above, they are defined relative to the transverse mass, where is that of the pair, .
All the calculations are NLO in the total cross section and assume that the intrinsic broadening is the same in as in Pb. See Ref. [115] for details of the calculation. Note that the effect of the intrinsic on the shape of the quarkonium distribution can be expected to decrease as increases because the average also increases with energy. However, the value of may increase with so that effect remains important at higher energies. The energy dependece of is GeV2 where for and 3 for [115].
The EPS09 band is obtained by calculating the deviations from the central value for the 15 parameter variations on either side of the central set and adding them in quadrature. Only the nPDF uncertainties are shown. In this approach, the scale uncertainties defined by the total cross section fits, while reduced relative to changing and by a factor of two around a central value of , are still larger than those due to the nPDFs. For more details, see Ref. [115].
Data-Driven Models (J.-P. Lansberg and H.-S. Shao)
In Ref. [116], Lansberg and Shao proposed a novel approach to evaluate the impact of the nuclear modification of the gluon densities as encoded in the nuclear PDFs. It is particularly well-suited for quarkonium and open heavy flavor production in proton-nucleus collisions at LHC energies, whose leading contributions are to a good approximation from partonic processes. It relies on a data-driven parameterization of the partonic scattering amplitude squared which allows one to correctly take into account the kinematics relating the momentum of the observed particle and the momentum fraction of the initial gluons which enter the evaluation of the nPDFs.
This method has several advantages. It can be applied to single quarkonium and inclusive heavy flavor production with parameters tuned to data on individual meson production assuming scattering. A data-driven approach results in a smaller uncertainty on the cross sections than those from calculations of theoretical uncertainties since the available data provide stringent constraints on the model parameters. Since the calculation depends only on a simple, common, parameterization of the amplitude for both open heavy flavor and quarkonium, it is very efficient.
The functional form of the amplitude in this model is
where and are the incident partons involved in the hard scattering to produce final-state particle with mass and final-state parton and and are the momentum fractions carried by and . The function ensures that the second term in the last factor is incorporated only when . The amplitude does not include any dependence on spin or color. The amplitude includes four parameters: , , , and . They are determined from the data after convolution with the proton PDFs,
| (18) |
The phase space for the scattering is denoted by and the proton PDFs are denoted by . The factorization scale dependence of the PDFs is suppressed in Eq. (18) but the factorization scale is assumed to be equal to the transverse mass of the produced particle, . For the energies considered in Ref. [116], only the contribution to the partonic cross section is included since this contribution dominates production in the kinematic acceptance of the LHC detectors.
By construction, after the parameters are fit to accurately reproduce the data, the formalism described above can provides reliable cross sections after including the nPDF correction factor in Eq. (18). The calculations can then be directly compared to experimental data, either as individual distributions or as the nuclear modification factor and forward-backward asymmetry .
Since the hard scattering is parameterized, there is no dependence on either mass or renormalization scale: only the factorization scale at which the nPDF is evaluated needs to be fixed, introducing an additional uncertainty on top of the nPDF uncertainty. The results can be calculated for any nPDF set included in the [117] and [45] libraries employing the corresponding version of [118]. As shown in Ref. [116], the nPDF uncertainty is larger than the factorization scale uncertainty found by varying the central scale by a factor of two, and .
Currently predictions are given for the nCTEQ15 [119] and EPS09 LO and NLO nPDFs sets. The CT14 NLO proton PDFs [120] are used with the nCTEQ15 nPDFs while CT10 NLO proton PDFs [97] are used with the EPS09 LO and NLO nPDFs since the code does not load two PDF libraries at once [116]. The gluon distributions in CT10 NLO and CT14 NLO are quite similar so the resulting difference is not large. In any case, even though the CTEQ6L1 and CTEQ6M PDFs should be used with EPS09 LO and EPS09 NLO respectively for consistency, Ref. [116] notes that the proton PDF is less critical since EPS09 provides a ratio while nCTEQ15 provides distributions. Only minimum-bias collisions are considered since the code has not yet been coupled to a Glauber Monte Carlo. The uncertainties are evaluated using the different eigensets provided by the nPDF sets.
The value of in Eq. (4.1.1) was fixed to 2 for all the calculations in Ref. [116]. The average was fixed to 4.5 GeV for both mid and forward rapidity while the value of was fixed to 13.5 GeV for all the data. Making rapidity-dependent fits is appropriate for the because of the different acceptance at midrapidity ( GeV) and forward rapidity () for some of the LHC experiments because the large magnetic fields do not allow detection of leptons from low decays. No acceptance-based fit is required for because the larger mass allows all with to be detected, even at midrapidity since the lepton momenta from decays at are above detection threshold. Thus, for quarkonium, only and were fit to data. Separate fits were made in all cases for CT14 NLO and CT10 NLO. While the data used in the fits were typically from Run I data at 7 TeV, the parameter values were unchanged for the 8.16 TeV Pb run. Note that the calculations were done for 8 TeV.
Energy Loss (F. Arleo)
In the coherent energy loss model [121, 122], the differential production cross section as a function of the quarkonium (labeled ) energy is
| (19) |
where () is the energy (energy loss) of the pair in the rest frame of nucleus . The upper limit on the energy loss is where is the beam energy in that frame. The energy loss probability distribution, or quenching weight, , is related to the medium-induced, coherent radiation spectrum given in Refs. [122, 125]. This result proved to be an excellent approximation of the spectrum computed to all orders in the opacity expansion [123]. It depends on the accumulated transverse momentum transfer due to soft rescatterings in the nucleus where is the medium path length obtained from a Glauber calculation using realistic nuclear densities and is the transport coefficient in cold nuclear matter. The transport coefficient at momentum fraction is [122]
| (20) |
at small values of , , where is defined in kinematics. Here is the quarkonium rapidity in the center-of-mass frame of an elementary proton-nucleon collision, is the transverse mass and is the only free parameter of the model. It is determined by fitting the suppression measured by the E866 Collaboration [124] in W relative to Be collisions at GeV, see Ref. [122]. The fitted value is GeV2/fm. The production cross section appearing in Eq. (19) is given by the simple parameterization
| (21) |
where the exponent is obtained from a fit to measurements at different center-of-mass energies.
model comparisons, collinear factorization
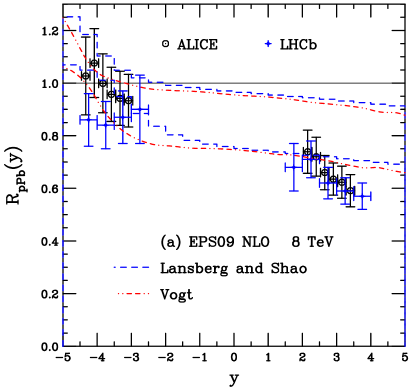
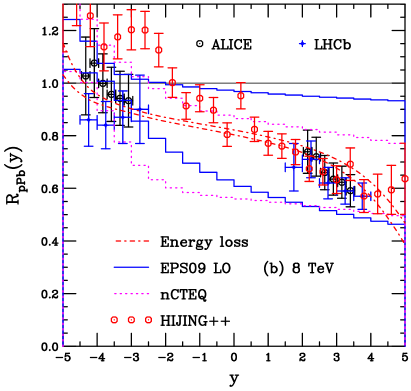
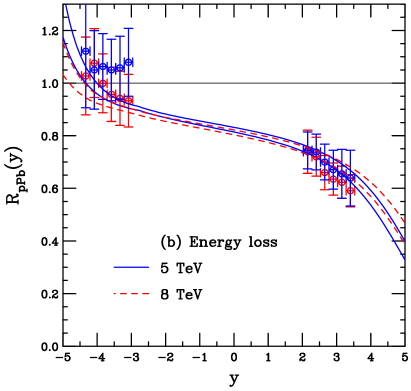
The predictions for suppression in Pb collisions at TeV in the approaches discussed in this section are shown in Figs. 20-22. The LHCb [2] and preliminary ALICE [1] data are also included. The prediction for is included in Fig. 20(b).
The values Lansberg and Shao obtained for and for the were very similar for the two proton PDFs. A clear dependence on rapidity range ( acceptance) is noticeable in the fit parameters with the values of both parameters being larger at midrapidity for high : and at forward rapidity and , at midrapidity.
In Fig. 20(a), the CEM and data-driven calculations employing EPS09 NLO are compared. The data-driven calculations employ the same parameters, , and for and Pb. The 8 TeV energy was run in collisions so no energy extrapolation is required. The ratios here and elsewhere do not depend on since the normalization is not changed. The calculations in Figs. 20 and 22 used the parameters for LHCb (forward rapidity) since these are for low and forward . These values were chosen since the measurement at ALICE can go to due to the lower magnetic field.
There is a slight backward shift for the CEM calculation relative to the data-driven calculation with the same nPDF. There are several possible reasons for this. The EPS09 NLO calculation in the CEM is done for the renormalization and factorization scales proportional to with . However, the central value of the factorization scale is , larger than the scale used in the data-driven calculation. The CEM calculation is also dominated by the contributions to the cross section, in particular , and is thus NLO in the total cross section. At rapidities larger than , the two model results with EPS09 NLO are quite similar. The EPS09 NLO sets essentially plateau with rapidity for .
While the collinear factorization-based shadowing calculations at backward rapidity are fully compatible with the ALICE and LHCb data, they tend to somewhat underestimate the amount of suppression at forward rapidity. This is due to the aforementioned plateau of the calculations at forward rapidity. It is noteworthy that the behavior of the gluon suppression due to shadowing at low with EPPS16 [5] has a shape similar to that of EPS09 NLO. However, the number of fit parameters has increased from 15 in EPS09 NLO to 20 in EPPS16 which mainly influence the width of the low shadowing band, especially for the gluons. Therefore, one might expect that employing this new set, with its associated uncertainties, would increase the relative suppression at low and thus also encompass the ALICE and LHCb data. Thus it is important to seek constraints on the gluon density in the nucleon at low , at least but, in practice, measurements at even lower would be preferable to see if the effect saturates at low or not.
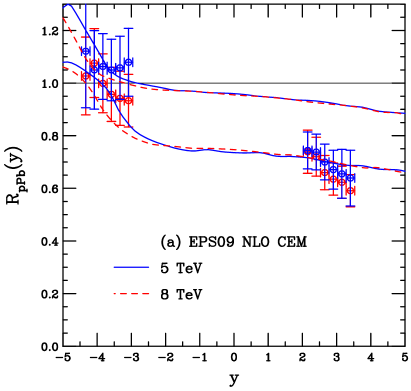
In Fig. 21, the results that were available for comparison to the data from the 5 TeV run [4], the EPS09 NLO CEM calculation by Vogt and the energy loss calculation by Arleo, are compared side-by-side with the nuclear suppression factor measured by ALICE at the same energies [126, 1]. The EPS09 LO calculation by Lansberg et al. in Ref. [4] used a standard matrix element, not the data-driven approach here, and the CGC calculations were different also.
The ALICE data are remarkably similar so far at the two energies although the still-preliminary 8.16 TeV data have large uncertainties. (Note that the same data sets from LHCb are not shown here to make it possible to distinguish between the data sets at the two energies. The LHCb data at 5 [127] and 8.16 TeV [2] are also compatible at the two energies.) The 5 TeV data in the backward rapidity region do not show a strong rapidity dependence while there is a decrease with increasing rapidity at 8.16 TeV. The trends in the data at forward rapidity are very similar although the slope seems again somewhat larger for 8.16 TeV. Recall, however, that the baseline of the 5.02 TeV was obtained from an interpolation between measurements at higher (7 TeV) and lower (2.76 TeV) energies since there was no run at 5 TeV until LHC Run II. It would be interesting to recalculate the 5 TeV results for the measured data at the same energy.
The EPS09 NLO CEM calculation gives essentially identical results for the two energies for . At more backward rapidity, the antishadowing peak has moved to still more negative rapidity in the higher energy calculation. The energy loss calculation also shows a shift to more negative rapidity, the rise at backward rapidity is shifted to the left, toward lower values of , at the higher energy. Interestingly, this has the effect of lifting the 8 TeV result above that of the 5 TeV calculation at positive rapidity, opposite the trend of the data.
In both cases the difference in the calculated will be hard to distinguish and subtle differences in curvature may not be differentiated by the data unless the uncertainties are significantly reduced.
In Fig. 20(b), the data-driven calculations with EPS09 LO and nCTEQ are compared with the energy loss calculation. As has been observed previously [115], the lower limit of shadowing with EPS09 LO () is similar to that of EPS09 NLO. However, the upper limit of EPS09 LO shows much stronger shadowing (lower ) due to the different low behavior of CTEQ6M and CTEQ6L1, see Ref. [115] for more details. The nCTEQ calculation shows stronger shadowing at backward rapidity for the upper limit of shadowing with a steeper rise toward the antishadowing region.
The energy loss calculation has a different curvature at forward rapidity with a stronger effect turning on for . It also has a rise at backward rapidity since the backward shift in rapidity that causes the drop at forward rapidity causes a corresponding enhancement at backward rapidity. Overall, the energy loss model predicts rather strong suppression at forward rapidity, , and a slight enhancement in the most backward rapidity bins, .
As can be seen in Fig. 20(b), the preliminary ALICE data are consistent with the shadowing and energy loss calculations. In the case of the data-driven results, the uncertainties in EPS09 LO and nCTEQ are large enough to encompass the data. In addition, the maximum achievable shadowing in these cases is stronger than for EPS09 NLO. The curvature of the energy loss calculation is compatible with the decreasing trend of the ALICE data at forward rapidity.
Finally, the predictions for the are also shown as the red points in Fig. 20(b). The are produced in the hard scatterings in the underlying generator. The rather large uncertainties are likely due to the fact that, in the calculations, all the charmonium channels were turned on and allowing production in multiple channels can reduce the population of a specific final quarkonium state.
At rapidities in the range , the calculations are within the uncertainties of the shadowing models and agree rather well with the forward rapidity data. However, for , the calculation gives a significant enhancement, larger than what one would expect from standard nPDF parameterizations that include antishadowing. This may be due to multiple scattering of the final-state with other particles in the medium.
Figure 22 compares all the shadowing calculations at backward rapidity (), forward rapidity (), and midrapidity () as a function of . The backward rapidity region has an antishadowing peak, as the ratio is larger than unity for all calculations, especially for GeV. The level of shadowing at low , GeV, is similar at forward rapidity and midrapidity. This is not surprising because already at the nPDF calculations are at their maximum -integrated shadowing. However, at midrapidity, the suppression factors increase more rapidly with than at forward rapidity. The strongest shadowing at midrapidity is found with nCTEQ but at forward rapidity nCTEQ and EPS09 LO give comparable shadowing effects.
The preliminary -dependent ALICE data at backward and forward rapidity are compared to the calculations in Fig. 22. The LHCb data are also shown. Note, however, that these data are in slightly different rapidity windows, for backward rapidity and for forward rapidity [2]. Despite the difference in rapidity windows, the data, which include both statistical and systematic uncertainties added in quadrature, agree rather well in both rapidity regions. At backward rapidity, all the calculations overlap with each other as well as with the measurements. On the other hand, at forward rapidity, the data rise faster with than the calculations which remain less than unity for GeV. Thus the behavior of the data are generally incompatible with the nCTEQ result for GeV. However, the data would seem to suggest a faster evolution with than the current global analyses can account for.
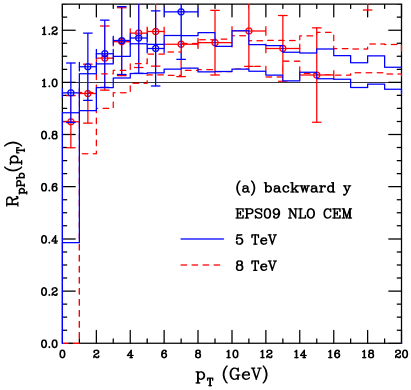
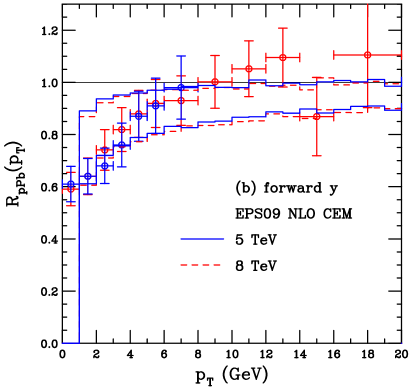
Figure 23 compares the dependence of the suppression factor at the two energies, both the data and the EPS09 NLO CEM calculation from Ref. [4]. The new data at the higher energy extend the measured range by a factor of two. At forward rapidity, the data are very similar where they overlap, not surprising since they agree rather well in this region of rapidity, see Fig. 21. On the other hand, the 5 TeV data are higher at low for the backward rapidity region, similar to the rapidity dependence. The calculations reflect this: the results are on top of each other at forward rapidity but there is more low suppression at backward rapidity.
model comparisons, collinear factorization
The predictions for suppression in Pb collisions at TeV in the approaches discussed in this section are shown in Figs. 24 and 25. In Fig. 24(a), the CEM and data-driven calculations employing EPS09 NLO are compared.
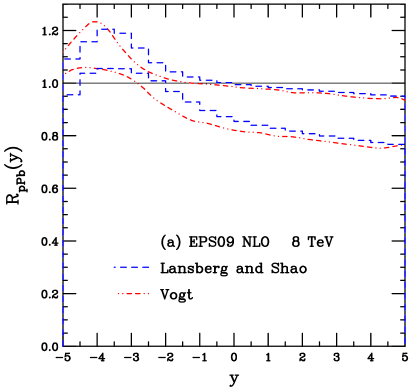
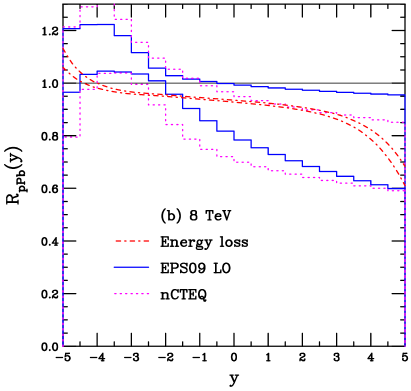
For the fits, Lansberg and Shao found larger values of while the value of was smaller. A stronger dependence on the proton PDF employed was also noted. They found for CT14 NLO and for CT10 NLO. The value of was decreased to . Note that due to the higher average fixed for relative to , can be expected to be different since is directly related to , see Eq. (4.1.1). On the other hand, is simply a normalization constant.
The trend is similar to that for . However, the larger mass reduces the shadowing effect for all calculations. There is a similar shift between the CEM and data-driven calculations with EPS09 NLO as seen in Fig. 20. It is less pronounced for than for . The parameters in the CEM calculation for the central fit are GeV, and [115]. Thus the factorization scale used in this calculation is again larger than that of the data-driven calculation. In this case, however, the difference is not as large and, since the scales are overall larger than for , evolution reduces the relative difference.
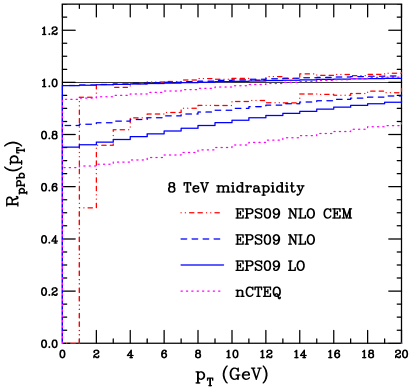
In Fig. 24(b), the data-driven calculations with EPS09 LO and nCTEQ are compared with the energy loss calculation. The shadowing effects are also reduced for the EPS09 LO and nCTEQ calculations although these still show a stronger effect overall than that with EPS09 NLO. The suppression due to energy loss predicted for the shares the same features as for the . However, the suppression is less pronounced than that of the since the (average) coherent energy loss scales as [125].
Figure 25 compares all the shadowing calculations at midrapidity () as a function of . Weaker shadowing is seen also in the dependence of production at midrapidity. As was the case for the , the nCTEQ set has the strongest effect at midrapidity and low .
and Interactions with Comovers (E. G. Ferreiro)
A relative suppression of excited charmonium states as compared to their ground state has been obtained in d+Au and Pb collisions by the PHENIX [129], ALICE [130, 131] and LHCb [132] collaborations. In particular, stronger suppression of the relative to the has been detected. This behavior can be explained by the interactions of the quarkonium states with a comoving medium [133].
In the comover framework, the suppression arises from scattering of the nascent with the produced particles, the comovers, that travel along with the pair [134, 135]. The comover suppression affects the more strongly than the due to its larger size. The comover suppression is stronger in regions of phase space where the comover densities are larger. Thus the effect is strongest in more central collisions and, for the asymmetric proton-nucleus collisions, in the direction of the nucleus.
In the comover interaction model (CIM) [135, 136, 137, 138, 139, 140], the rate equation that governs the density of charmonium at a given transverse coordinate , impact parameter and rapidity , , obeys the expression
| (22) |
where is the charmonium dissociation cross section due to interactions with a comoving medium of transverse density .
Assuming that the comover density becomes more dilute with time due to the longitudinal expansion of the medium leads to a dependence on proper time and Eq. (22) can be solved analytically. The result depends only on the ratio of final over initial time. Using the inverse proportionality between proper time and density, the interaction is assumed to stop when the density has diluted to the point that the comover density is equal to the density at the same energy, . Thus, the solution of Eq. (22) is given by
| (23) |
where the argument of the logarithm is the interaction time of the with the comovers.
The cross section of charmonium dissociation due to interaction with the comoving medium, , was fixed [136] from fits to low-energy experimental data to be mb for the and mb for the . These same values were also successfully applied at higher energies to reproduce the RHIC [141] and LHC [142] data in nucleus-nucleus collisions.
The modification of the gluon parton distribution functions in the nucleus is also taken into account in this approach. Since the effect is identical for the 1S and 2S states [143], i.e. for the and the , it produces an identical decrease of the and the yields at mid and forward rapidity for LHC energies. However, due to gluon antishadowing, it can induce an increase of both yields in the backward rapidity region.
The nuclear modification factor is thus
| (24) |
where is the survival probability due to the comover interactions and takes into account the modification of the nuclear parton distribution functions.
Figure 26 shows the nuclear modification factor as a function of rapidity in Pb collisions at TeV. Three rapidity intervals are studied: the -going direction, ; the Pb-going direction, ; and the midrapidity interval. EPS09 LO shadowing is assumed [70, 144] for both the and the . The interaction with comovers induces a stronger suppression in the backward rapidity region, the Pb-going direction, due to the higher comover density. This effect is more important for than for production since The effect due to the EPS09 LO shadowing depends on the rapidity interval considered. It produces additional suppression in the mid and forward rapidity regions but is compatible with unity in the backward interval accessible to experiment, see Fig. 20(b).
The 8.16 TeV results are compared to those from 5.02 TeV in Fig. 26. Note the additional suppression at the higher energy, due to the larger density of produced particles. The effect is particularly noticeable at backward rapidity, near the lead nucleus. At forward rapidity, in the proton-going direction, the difference is small.
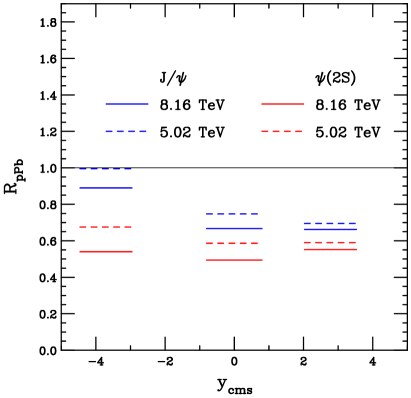
In Fig. 27, the double ratio for Pb collisions at TeV is presented and compared with those at [133]. The same three rapidity intervals are studied. The same trends as in Fig. 26 are seen. However, there is a stronger effect on the double ratio at backward rapidity than in more the forward rapidity intervals, away from the nucleus.

4.1.2 Saturation Approaches
Here results from two saturation approaches are presented. The first, using the rcBK approach in Sec. 2.1.1, by Ducloué, Lappi and Mäntysaari employs the color evaporation model of quarkonium production, also used in Sec. 4.1.1. The second, by Ma, Venugopalan and Zhang, employs nonrelativistic QCD, NRQCD, as the baseline quarkonium production model.
CGC+CEM (B. Ducloué, T. Lappi and H. Mäntysaari)
As discussed in more detail in Refs. [109, 145], the color evaporation model, where a fixed fraction of all pairs produced below the meson threshold are assumed to become mesons, is employed. The same CGC framework and same rcBK-evolved parameterization for the dipole amplitude obtained from DIS fits that is used when calculating single inclusive particle production in Sec. 2.1.1 and in Ref. [22] is also employed. Results here are referred to as CGC+CEM.
The CEM cross section for prompt production is written here as
| (25) |
where and are the transverse momentum and rapidity of the produced , is the charm mass, and is the meson mass. The fraction of pairs fragmenting into is given by which cancels in . The uncertainty on the calculation is determined by varying , GeV.
Only production at forward rapidities, where the Bjorken of the probe is large and the gluon density in the probe is given by the collinear parton distribution function , is considered. In this region, the target is probed at small and the production cross section can be written as
Here and the values for the projectile and target, and , are given by
| (27) |
The expression for the hard matrix element is given in Ref. [145]. The propagation of the quark-antiquark pair through the color field of the target is given by
| (28) |
Here the dipole amplitudes in the Fourier transforms and are evaluated at . In the case of proton-proton scattering, the impact parameter dependence is assumed to factorize and the replacement is made. In proton-nucleus collisions the impact parameter integral is performed using the optical Glauber model as described in Sec. 2.1.1.
CGC+NRQCD (Y.-Q. Ma, R. Venugopalan and H.-F. Zhang)
Here the production cross section in and collisions is calculated within the framework of the CGC [146, 147, 148, 149] and the nonrelativistic QCD approach to quarkonium production [150]. The calculations are based on Refs. [151, 152]. The production of in collisions within the framework of CGC+NRQCD was presented in Ref. [153].
In NRQCD factorization, the production cross section of a quarkonium state in the forward region of a collision is expressed as [150]
| (29) |
where denotes the quantum numbers of the intermediate -pair in the standard spectroscopic notation for angular momentum. The superscript denotes the color state of the pair, which can be either color singlet (CS) with or color octet (CO) with .
For production, the most important intermediate states are , , and . In Eq. (29), are nonperturbative universal long-distance matrix elements (LDMEs), which can be extracted from data and are short-distance coefficients (SDCs) for the production of a -pair, computed in perturbative QCD.
To calculate the SDCs in Eq. (29), CGC effective field theory [149, 154] is applied, resulting in [151, 153]
| (30) | ||||
for the color-singlet channel and
| (31) | ||||
for the color-octet channels. Here is the unintegrated gluon distribution of the proton,
| (32) |
The functions and are calculated perturbatively [151, 153]. () are the momentum-space dipole forward scattering amplitudes with Wilson lines in the fundamental (adjoint) representation and () is the effective transverse area of the dilute proton (dense nucleus). These formulas can be used to compute quarkonium production in collisions. When the nucleus is replaced by a proton, these expressions can also be used to compute quarkonium production in collisions [153]. Note that for d+Au collisions at RHIC, it is assumed that since gluon shadowing effects are weak for the deuteron.
In these calculations, the charm quark mass is set to , approximately half the mass. The CO LDMEs are taken from Ref. [155]: , , and . Further, as in Ref. [153], and are obtained by solving the rcBK equation [156, 157] in momentum space with MV initial conditions [146, 147] for the dipole amplitude at the initial rapidity scale (with ) for small evolution. In Ref. [153], a matching scheme was devised that allowed interpolation between the collinearly-factorized gluon distribution of the proton at large with the unintegrated distribution in Eq. (32). The matching also determined the scale in the collinear gluon distribution to be GeV and the effective gluon radius of the proton to be fm.
The initial saturation scale in the nucleus and the effective transverse nuclear radius need to be fixed in collisions. In this calculation, is adopted. The radius is determined from the condition in the high limit. This results in , giving for Pb and for Au.
model comparisons, saturation
The nuclear suppression factors for the two CGC models are shown in Fig. 28 as a function of rapidity (a) and transverse momentum (b). The calculation of the rapidity dependence by Ducloué et al is shown only in the rapidity range of the forward ALICE data, , while the Ma et al. calculation is shown for . The calculations as a function of rapidity are integrated over for while the -dependent results are obtained in the forward region, for both calculations. The preliminary ALICE [1] and LHCb [2] are also shown.
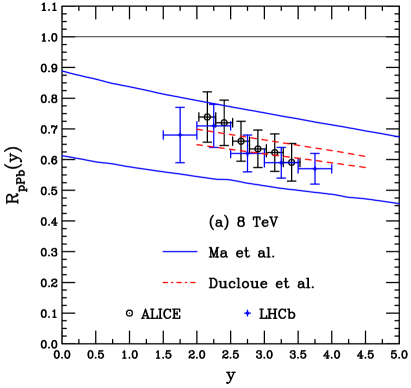
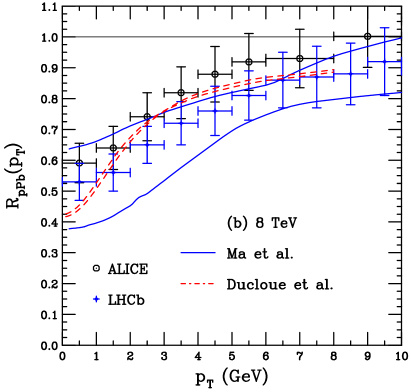
The calculation by Ducloué et al., which employs the CGC+CEM, includes uncertainties only due to the variation of the charm quark mass in the calculation. Thus the uncertainty band is rather narrow. On the other hand, the calculation by Ma and collaborators, based on CGC+NRQCD, has a broader band. That is because, in this calculation, the band corresponds to the range of predictions obtained by making the ratio for each of the color octet states separately. In this way, the rather large uncertainties on the individual color octet matrix elements cancel in the ratios.
In Ref. [152], the authors noted that if the CGC+NRQCD uncertainty band is based on the individual ratios of the color octet matrix elements, it should encompass any other calculations in a similar framework, such as the CGC+CEM calculation of Ref. [109]. As shown in Fig. 28, this does indeed seem to be the case. The rapidity dependence of the two calculations is nearly identical. While the -dependent curvature of the two results is somewhat different, the CGC+CEM calculation is still essentially within the bounds of the CGC+NRQCD result.
When these results are compared to the collinear factorization calculations with conventional shadowing and/or final-state energy loss, as in Figs. 20 and 22, it can be seen that the maximum CGC+NRQCD suppression as a function of rapidity is similar to that of the nCTEQ and EPS09 LO suppression factors at forward rapidity. The minimum saturation effect is similar to the minimum effect of nCTEQ. The energy loss calculation is within the uncertainty band of the CGC results.
The same general trend is seen as a function of for both CGC+NRQCD and the calculations with conventional shadowing. All calculations exhibit at forward rapidity but the CGC+NRQCD calculation shows a faster increase with than the conventional shadowing calculations. The curvature with CGC+NRQCD is also somewhat different with a narrowing of the band at GeV where there is a crossover of the -dependence of the color octet ratios. No such behavior is observed for the collinear factorization calculations. Nonetheless, the results from the two approaches are becoming more similar than earlier CGC calculations shown in Ref. [4].
Figure 28 also compares the CGC calculations with the LHCb data and the preliminary ALICE data at forward rapidity. The rapidity dependence of the two approaches agrees with the data, including the decreasing trend of the data with rapidity. In addition, the curvature of the dependence agrees quite well with the data for the range GeV. While the dependence is rather different for CGC+CEM and CGC+NRQCD, the data sets cannot distinguish between the two approaches at this point.
4.2 Heavy Flavors Hadrons (Z.-B. Kang, J.-P. Lansberg, H.-S. Shao, I. Vitev and H. Xing)
Here cold matter calculations by Vitev and collaborators are compared to the data-driven calculations of Lansberg and Shao with shadowing only. The preliminary calculations are also shown for .
4.2.1 mesons
The predictions for meson suppression in Pb collisions at TeV in the approaches discussed in this section are shown in Figs. 29-31.
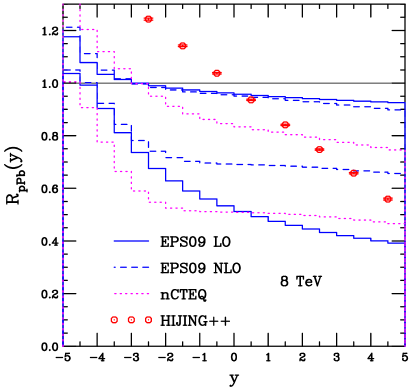
Figure 29, compares the data-driven calculations as a function of rapidity. In this case, the average parameter in Eq. (4.1.1) is also allowed to vary although is still fixed at . The values of , and are fixed for all rapidity and have a stronger dependence on proton parton density for mesons than for , perhaps because of the fixed, higher average , GeV. Here, for CT14 NLO and nCTEQ, , , and GeV, while for CT10 with EPS09 LO and EPS09 NLO, , , and GeV. The three results for mesons as a function of rapidity look similar to those of Fig. 20. However, a comparison of Fig. 29 with Fig. 20 shows that the shadowing effect on mesons is larger than for at forward rapidity. Recall that no other nuclear effects are included.
The calculation is also shown in Fig. 29. The statistics are much higher than in Fig. 20(b) since the calculation accounts for all and mesons produced in hard scatterings with none lost to decays. Note that while the results at forward rapidity lie within the large uncertainties of the shadowing calculations, the curvature is very different. Indeed, the result is essentially linearly rising as one goes from forward to backward rapidity, resulting in a relatively large enhancement at backward rapidity. This enhancement may be due to multiple scattering closer to the lead nucleus.
Figure 30 compares the shadowing calculations at backward rapidity, , as a function of . As was the case for , in this region there is antishadowing for GeV. The maximum shadowing effect is fairly strong in all three cases. Note also that here the calculations with EPS09 LO and EPS09 NLO are very similar and only become distinct at more forward rapidity, see Fig. 31.
A higher-twist multiple scattering calculation based on Refs. [54, 158], within the generalized higher-twist factorization formalism [159], is also shown. The prediction for incoherent multiple scattering on heavy meson production is given in the backward rapidity region. The double scattering contributions to the -meson differential cross sections are calculated explicitly by taking into account both initial-state and final-state interactions. The final result depends on both the parameterized twist-4 quark-gluon and gluon-gluon correlation functions. Only one parameter, , characterizing the strength of parton multiple scattering needs to be determined.
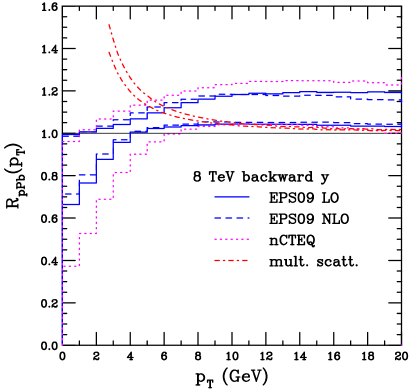
As shown in Fig. 30, the band corresponds to GeV2, extracted from DIS data [160]. The double scattering contribution at TeV in the backward rapidity region is predicted to lead to a Cronin-like enhancement in the intermediate range. This feature is understood as the incoherent multiple scattering of hard partons in the large nucleus [54, 158]. Such a feature has already been observed by the recent measurements at RHIC and the LHC. The backward rapidity measurements of heavy meson production in future LHC programs will provide an excellent opportunity to investigate perturbative QCD dynamics and test the predictive power of the higher-twist formalism, as well as further constrain the properties of cold nuclear matter.
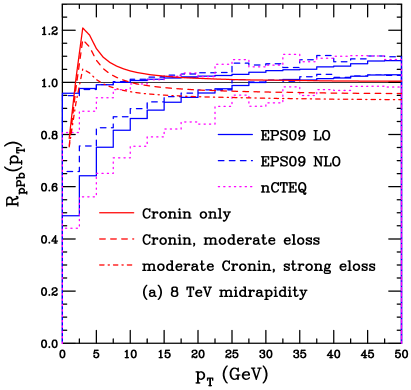
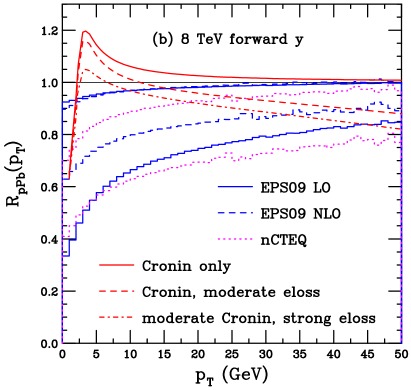
Figure 31 presents the results for cold nuclear matter calculated by Vitev et al. including Cronin broadening and cold matter energy loss along with the shadowing calculations by Lansberg and Shao. As was the case for backward rapidity, the shadowing calculations show a stronger dependence on than the . The effect is larger at lower due to the lower overall scale, at rather than . Note also the larger scale in Figs. 30 and 31. At midrapidity, there is some antishadowing seen for GeV. The Cronin effect included in the cold nuclear matter calculation by Vitev et al. results in a low enhancement. The chosen assumptions for the two different calculations (Cronin and energy loss vs. shadowing only) result in the largest difference for GeV. At higher , even very precise data can likely not distinguish between the approaches unless there is a clear trend with and, even in this case, it could be difficult.
The LHCb Collaboration has recently released data on in Pb collisions at 5 TeV [161]. They have determined the nuclear modification factor as a function of rapidity and as a function of transverse momentum at forward and backward rapidity. These data agree with the shadowing only calculations presented here and do not exhibit any low enhancement as might be expected from Cronin enhancement, see Ref. [161].
4.2.2 mesons
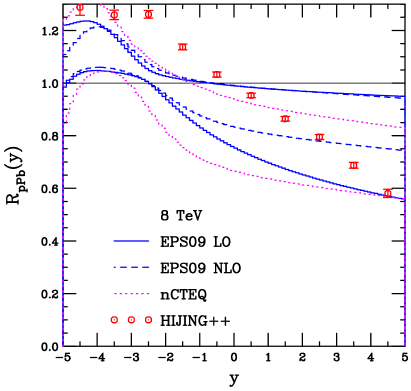
In Fig. 32, the data-driven calculations with EPS09 LO, EPS09 NLO and nCTEQ are compared. The parameters for these calculations were not included in Ref. [116] but were determined for this report. They were obtained by fitting the LHCb data at 7 TeV [162]. The power in Eq. (4.1.1) was again kept fixed at but , and were fit. The values were similar for the two proton parton densities: GeV, and for CT10 NLO and EPS09 LO, EPS09 NLO while GeV, and for for CT14 NLO and nCTEQ. There is significantly less suppression due to shadowing than for mesons but somewhat stronger shadowing than for production in Fig. 24.
The calculation is shown by the points in Fig. 32. As with the and results, the rapidity dependence of the ratio for is within the uncertainties of the nPDF results at forward rapidity. In this case, however, the enhancement at backward is not as large and, for , the result is compatible with the nCTEQ uncertainty.
A comparison of the calculations in Figs. 20(b), 29 and 32 shows that, at forward rapidity, the results are all compatible and exhibit a linear dependence on rapidity that is typically stronger than all the calculations with nPDF modifications alone. This is likely because of the strong low- shadowing of the parameterization used in . This parameterization does not yet include any scale evolution. Thus the only scale dependence in the calculation arises from that of the proton PDF. There are differences at more backward rapidity which likely arise from the hadronization model of and multiple scatterings near the target rapidity region.
Figure 33 compares all the shadowing calculations at midrapidity and forward rapidity as a function of with the Cronin and energy loss cold matter calculations by Vitev et al.. The suppression factor at is smaller than for and also has more curvature at midrapidity. The effect due to the nuclear parton density decreases faster with than for . The Cronin peak here is much smaller, less than 10% even at forward rapidity. Note that although these results show a small enhancement as a function of , the effect is reduced relative to mesons because the calculation uses a larger factorization scale.
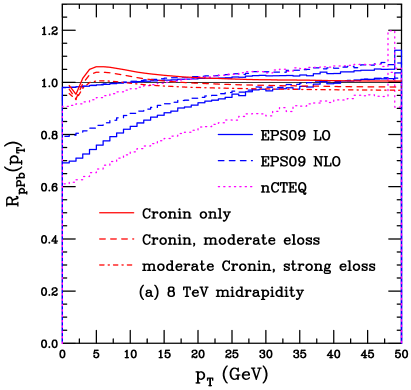
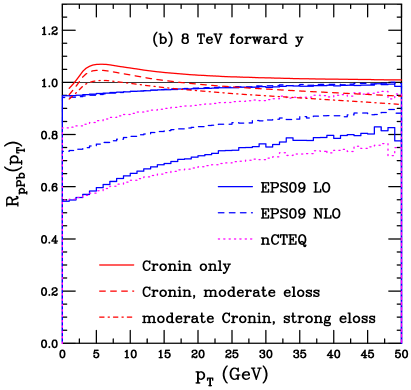
5 Drell-Yan Production (F. Arleo)
Measurements of production in Pb collisions at the LHC at TeV by ALICE [163] and LHCb [164] has triggered an intense debate on the origin of the reported nuclear suppression, which could be attributed to either modifications of the nuclear parton distribution [3, 115, 144] or coherent energy loss effects [121, 122, 123], see Sec. 4.1. It was suggested in Ref. [165] that the Drell-Yan process could play a key role in clarifying the origin of the quarkonium suppression reported in Pb collisions at the LHC since no coherent energy loss is expected on Drell-Yan production in this framework.
Predictions of the nuclear modification factor, , of low-mass Drell-Yan lepton pairs in Pb collisions at TeV are given. Using the [166, 167] Monte Carlo program, the NLO single differential cross section is computed in and Pb collisions at TeV and is calculated. The MSTW NLO [168] proton PDFs are used with factorization and renormalization scales equal to the lepton pair mass, . The Pb calculations were carried out using the NLO nPDF sets EPS09 [70], DSSZ [194] and nCTEQ15 [119]. For completeness, the DY cross section was also computed in Pb collisions assuming no nPDF corrections. The lepton pair mass range considered in this calculation is GeV.
The Drell-Yan suppression in Pb collisions is shown in Fig. 34 as a function of the lepton pair rapidity. In the most forward bins, (corresponding to using ), the suppression is quite strong, –, using nCTEQ15. It is less pronounced using DSSZ or EPS09, giving –. These calculations demonstrate the discriminating power of low-mass Drell-Yan production in Pb collisions at the LHC and could set tight constraints on antiquark shadowing at very small . In the backward region () the depletion of Drell-Yan production in Pb with respect to collisions is due to isospin effects [165].
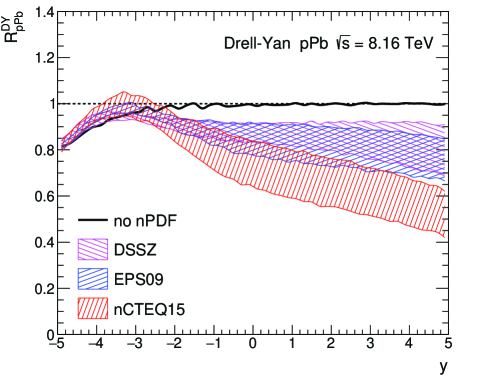
6 Jets
Two results are presented here. The first, by Vitev, focuses on cold matter energy loss. The second, by Kotko et al., discusses saturation in forward-forward dijet production.
6.1 Jet (I. Vitev)
Calculations with cold matter energy loss and Cronin broadening are shown in Fig. 35. The results are calculated at and . At forward rapidity, only the results for GeV are shown since they match those at lower . The results without energy loss are on top of each other over all . When energy loss is included, since the effect is stronger at high , the curves at and start to deviate at this value. By GeV, they differ by 20% for moderate energy loss and 33% for strong energy loss. Note also that the Cronin peak is large for ‘jets’ with GeV, even larger than for light hadrons due to the massless parton initiating the jet. Jets at low transverse momentum cannot be reliably reconstructed. The Cronin enhancement shown here will manifest itself in the Cronin enhancement of light hadrons which will be lower and shifted in due to fragmentation.
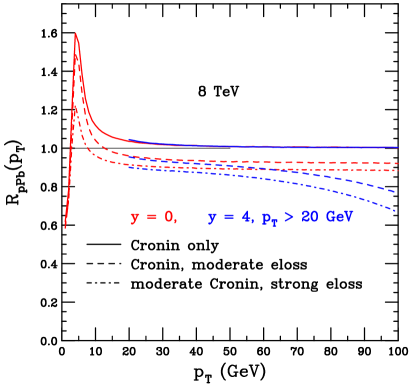
6.2 Forward jets (P. Kotko, K. Kutak and S. Sapeta)
A summary of results predicting [4] saturation [25] effects in production of forward-forward dijets in Pb scattering at the LHC at 8 TeV is presented here. In particular, the prescription proposed in Ref. [169] to include the hard scale dependence in the small gluon evolution equations using the Sudakov form factor is applied. (For other approaches, see Refs. [170, 171]). In these calculations, the high energy factorization formalism [172], which accounts for both the high energy scale of the scattering and the hard momentum scale provided by the produced hard system, is applied. Furthermore, the formalism is a very good approximation of the predictions of the nuclear modification factors obtained recently within the improved transverse momentum dependent formalism [173, 174]. In the asymmetric configuration, the high energy factorization formula is [175]
| (33) | |||||
where
| (34) |
It is assumed that and where is the azimuthal distance between the outgoing partons. The squared matrix element, , includes scattering with one off-shell initial state gluon, , and three on-shell partons, , and . On the side of the off-shell gluon in Eq. (33), the unintegrated gluon density, [176, 177, 178], is employed. It depends on the longitudinal momentum fraction, , the transverse momentum of the off-shell gluon, , and hard scale , taken to be, for example, the average transverse momentum of the two leading jets. On the side of the on-shell parton, probed at high values of , it is legitimate to use the collinear parton density .
l0.215b0.095(a)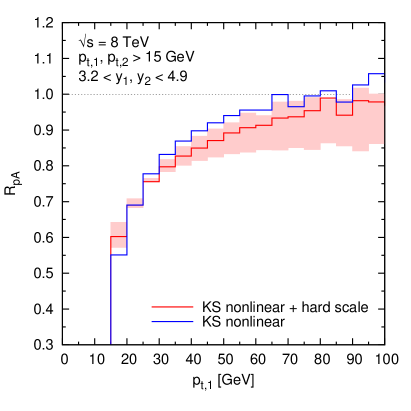 \stackinsetl0.1b0.18(b)
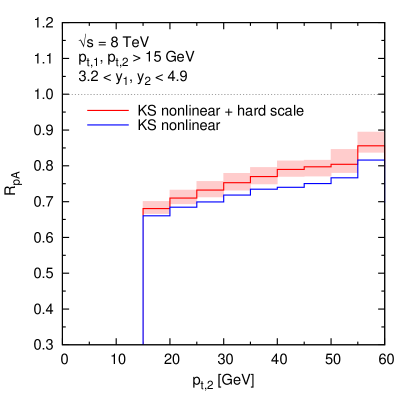 \stackinsetl0.12b0.085(c)
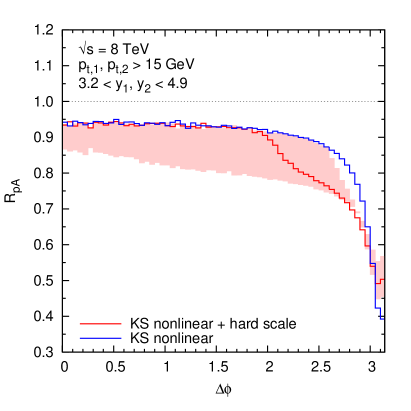
At 8 TeV, can be as low as in the forward-forward jet configuration so that fairly strong suppression at low for the hardest jet and large azimuthal separation may be observed.
In Fig. 36(a), the ratios of the differential cross sections for forward-forward dijet production in Pb relative to collisions is shown as a function of the of the hardest jet. Figure 36(b) shows the spectral ratio of the subleading (second hardest) jet.
All results were obtained with the CT10 NLO PDFs [97] on the side of the projectile. The blue histograms correspond to the KS gluon density [178] while the red histograms include Sudakov resummation effects as well as the KS gluon density [169]. The light red band around the hard scale result shows the effect of varying the scale, , by a factor of two on either side: and . The effect of the scale variation is negligible for the KS gluon density alone (blue curves).
7 Photons (I. Vitev)
The direct photon calculated by Vitev is shown in Fig. 37. The results are divided into two parts to emphasize the different regions: a low part, GeV, shown in (a) and a high part, GeV, shown in (b). Both results are shown at midrapidity.
At low , there is significant enhancement for GeV due to the Cronin effect. At high , isospin dominates the solid curve labeled Cronin only and is the main contribution to the decrease at high . The energy loss increases the high suppression, similar to the effect at low .
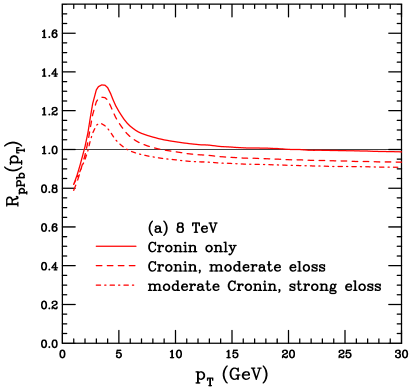
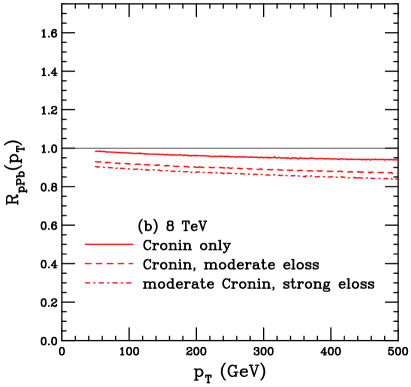
8 Gauge Bosons (P. Ru, S. A. Kulagin, R. Petti, E. Wang, B.-W. Zhang and W.-N. Zhang)
The predictions for weak gauge boson production in proton-lead collisions at TeV are made within the framework of pQCD. The numerical results, at NLO accuracy, are calculated using [166, 167], incorporating nuclear parton distribution functions. In this study, three sets of nPDFs are used in the numerical simulations: the central EPS09 NLO [70] and nCTEQ [179, 180] sets are both matched with the CT10 NLO [97, 200] proton PDFs while the KP [181, 182] set is matched with the ABMP15 [183] proton PDFs. The baseline results mentioned in the following refers to the results obtained with isospin alone, without any other cold nuclear matter effects. Thus the baseline results for the EPS09 and nCTEQ are calculated with CT10 proton PDFs and isospin while those for KP are calculated with ABMP15 and isospin. Both the factorization and renormalization scales are set to the gauge boson mass. More details of the calculations can be found in Refs. [4, 184, 185].
8.1 production
8.1.1 Charged lepton pseudorapidity distribution
The differential cross sections for and production are shown as a function of the charged lepton pseudorapidity in the center of mass frame. The final-state cut on the charged lepton transverse momentum, GeV, is used according to the CMS measurement at TeV [18]. The results are shown in Fig. 38(a) and (b) for and respectively. Obvious differences among the three nPDFs can be seen in the forward direction, especially for production.
To make a better comparison of the different nuclear modifications, Fig. 38(c) and (d) show the nuclear modification factors, as a function of charged lepton pseudorapidity. The points show the results including the nPDFs while the curves show the CT10 and ABMP15 sets with isospin effects alone. The shape of in the backward pseudorapidity region is dominated by the isospin effect since this is the region where the lead nucleon momentum fraction is large (the antishadowing region) while shadowing effects should dominate for small in the lead nucleus in the forward region.
The KP nPDF has very small antishadowing at these high scales since the ratio agrees well with the ABMP15 curve for . The EPS09 and nCTEQ sets exhibit antishadowing in this region so there is some deviation from the CT10 isospin curve. In the forward pseudorapidity region, however, there are clear deviations from the curves with isospin alone. Note that at forward rapidity, the CT10 ratios go to unity for both and production. However, the ABMP15 ratio is % enhanced for and % suppressed for . In the case of production, there is a clear separation between the three nPDFs with the KP set giving the smallest effect and nCTEQ the largest. With production, the difference in the isospin ratio at forward pseudorapidity for the two proton PDFs causes the KP and EPS09 ratios to overlap at while the nCTEQ result shows more suppression.
l0.21b0.4(a)\stackinsetl0.67b0.4(b)\stackinsetl0.21b0.065(c)\stackinsetl0.67b0.065(d)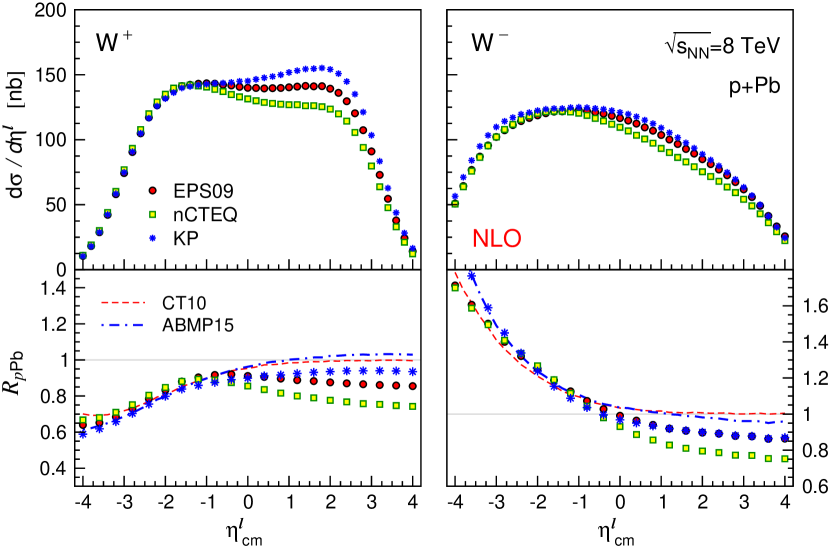
Note that the isospin effects are actually quite large at negative pseudorapidity and dominate the behavior of in that region. Thus a depletion of % is predicted for at and a % enhancement for at . This behavior can be expected because the neutron excess in the lead nucleus causes a relative reduction in quarks for production on the order of 0.7 in Pb collisions, relative to , near the edge of phase space at backward pseudorapidity. On the other hand, the enhancement of quarks in the lead nucleus gives an ehancement in production in the same direction by a factor of , as reflected by the isospin results shown in the curves in Fig. 38.
8.1.2 Charged lepton asymmetry
The asymmetry between and production is mainly due to the asymmetric and quark distributions in the proton and the lead nucleus, as can be seen in Fig. 38. The related observable, the charge asymmetry, shown in Fig. 39(a), is
| (35) |
The differences between the Pb result with shadowing and its corresponding baseline is shown in Fig. 39(b). The effect of shadowing for all three nPDFs is significantly reduced in the charge asymmetry. A slight suppression in the backward region is predicted by EPS09 NLO, likely the result of the asymmetric nuclear modifications of the valence and sea quarks [185]. The differences between the KP and nCTEQ results with respect to EPS09 NLO are shown in (c). This is done to illustrate where the nPDFs differ most since the difference between each set and its corresponding baseline is small. Relative to both EPS09 NLO and nCTEQ, the KP nPDFs predict a positive difference at forward rapidity and a negative difference at backward rapidity, largely due to the different large- ratio and small- ratio in the underlying proton PDFs [185].
l0.3b0.425(a)\stackinsetl0.3b0.225(b)\stackinsetl0.3b0.12(c)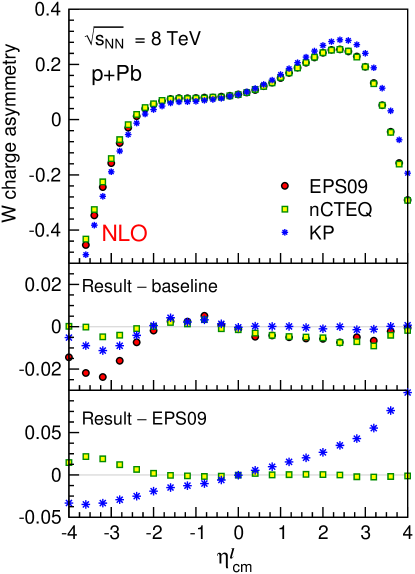
8.2 production
8.2.1 rapidity distribution
The differential cross section as a function of the rapidity is shown in Fig. 40(a). The mass interval, GeV [186], is used. Asymmetric forward-backward distributions are predicted by the three nPDFs.
The nuclear suppression factors are shown in Fig. 40(b). As in Fig. 38(c) and (d), the results are shown by the points for calculations with isospin and shadowing and by the lines for isospin alone. The isospin effect is very small for production with deviations from unity on the percent level or less over most of phase space. The isospin effect is small because production proceeds through both and quarks. Thus the suppression factors for the calculations with isospin and nPDF modifications more clearly reflect the shape of the shadowing parameterizations themselves. The higher scale, , and lower conspire to both lower the antishadowing peak and move it closer to midrapidity, compare Fig. 40(b) and Fig. 32 for mesons..
l0.2b0.40(a)\stackinsetl0.2b0.1(b)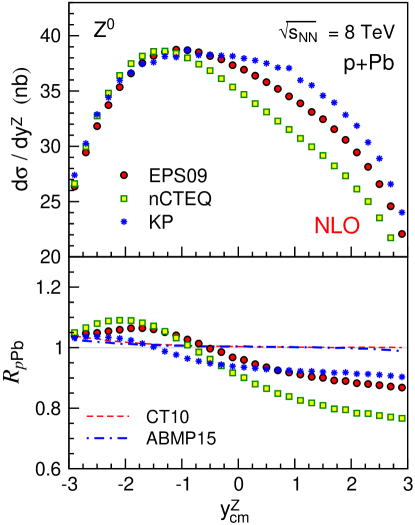
8.2.2 Forward-backward asymmetry
The forward-backward asymmetry, defined as
| (36) |
is given in Fig. 41. The baseline results with isospin alone, for both CT10 and ABMP15, show an almost symmetric forward-backward ratio. The deviation at forward rapidity in both cases is only %, due to the small enhancement in at negative rapidity seen in Fig. 40(b).
However, calculations with the three nPDFs predict different forward-backward asymmetries. The strongest predicted effect is with nCTEQ. The results demonstrate that the forward-backward asymmetry shows a strong sensitivity to the shadowing parameterization since the asymmetry due to the underlying proton PDFs is negligible. This measurement at the LHC may provide more valuable constraints on the nPDFs, especially the quark distributions [185].
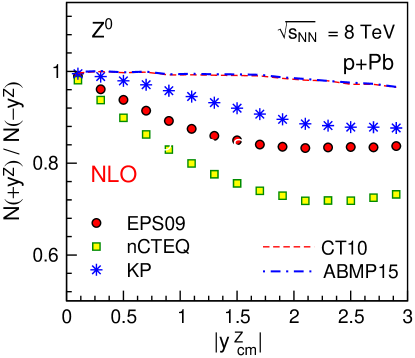
8.2.3 transverse momentum distribution
The differential cross section as a function of transverse momentum is shown in Fig. 42(a) for the mass window GeV and rapidity interval [186]. The nuclear suppression factors with nuclear PDFs, shown in Fig. 42(b), show some scatter but, overall, EPS09 and nCTEQ predict a small enhancement, %, at large due to antishadowing of the nuclear gluon distributions [187, 188]. The nuclear modification of the KP nPDFs shows a slight suppression at large relative to EPS09 NLO and nCTEQ. The results with isospin alone, shown in Fig. 42(c), display a relatively reduced amount of scatter consistent with unity.
l0.17b0.415(a)\stackinsetl0.17b0.22(b)\stackinsetl0.17b0.12(c)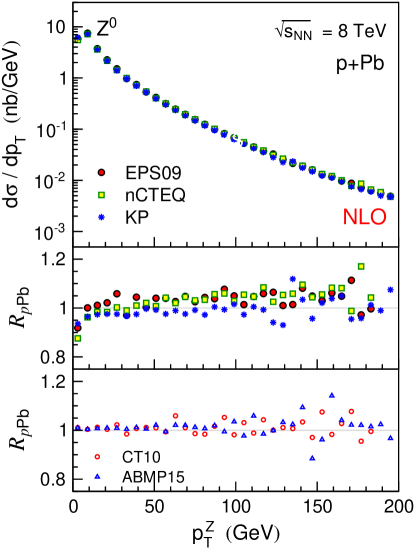
9 Top quark production cross sections (D. d’Enterria)
The top quark is the heaviest elementary particle in the Standard Model and remains unobserved so far in nuclear collisions. Its cross section in hadronic collisions is dominated by pair production in gluon-gluon fusion (), which is theoretically calculable today with great accuracy via perturbative quantum chromodynamics methods. (At NLO, more than 85% of the cross section at 8.16 TeV involves initial-state gluons from the colliding nucleons.) Calculations at next-to-next-to-leading-order (NNLO) including next-to-next-to-leading-log (NNLL) soft-gluon resummation are available using e.g. [190]. Differential cross sections are also available at NLO accuracy using the code [191, 192]. The study of the cross section modifications in proton-nucleus compared to collisions at the same nucleon-nucleon center-of-mass energy provides a novel, well-calibrated probe of the nuclear gluon density at the LHC [193], in particular in the unexplored high- region () where “antishadowing” and “EMC” effects are expected to modify its shape compared to the free proton case, see Fig. 43.
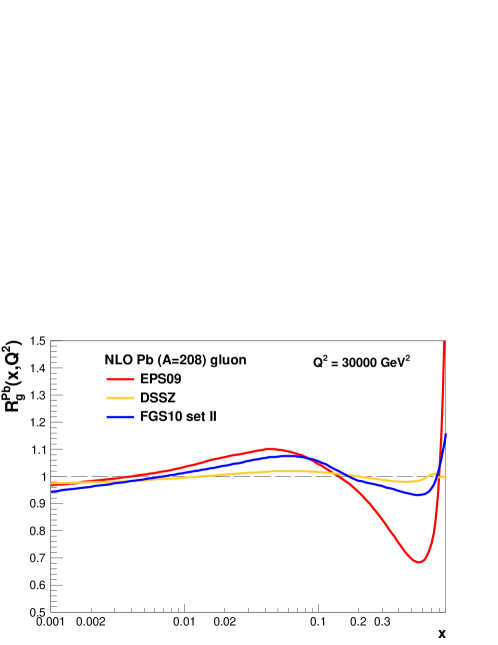
The study of top quark production in Pb collisions provides information on the nuclear PDF that is complementary to that from similar studies with electroweak bosons [18, 19, 20, 196]. The cross sections of the latter are more sensitive to quark, rather than gluon, densities, at values about a factor of two smaller. In addition, a good understanding of top quark production in proton-nucleus collisions is crucial as a baseline for upcoming studies of heavy-quark energy loss in the quark-gluon-plasma formed in nucleus-nucleus collisions [193, 197, 198].
The top quark decays very rapidly, fm, before hadronizing into with a % branching ratio, with the bosons themselves decaying either leptonically (, 1/3 of the time) or hadronically (, 2/3 of the time) [199]. In Pb+Pb collisions, the charged leptons from the fully-leptonic final-state () are totally unaffected by final-state interactions, thereby providing the cleanest channel for its observation in the complicated heavy-ion environment [193], though at the price of a relatively low branching ratio (BR 4% for the and modes combined). In the Pb case, thanks to the lower backgrounds and the absence of final-state effects for jets compared to Pb+Pb collisions, the leptons+jets final state () is easily measurable and has a much larger branching ratio (BR %) than the purely leptonic decay. Predictions are presented for the total, fiducial, and differential (for the +jets channel) cross sections for production in Pb at TeV.
9.1 Total and fiducial cross sections
The total and differential cross sections are computed first at NLO accuracy with v8.0 [191, 192], using the CT10 NLO [200] and CT14 NLO [120] proton parton distribution functions and the nuclear modifications for Pb given by the EPS09 [70] and EPPS16 [5] nPDF sets. A -factor, , is then computed with v2.0 [190] using the NNLO CT10 and CT14 PDFs alone, in order to scale up the NLO cross section to NNLO + NNLL accuracy. The and codes are run with flavors, the top pole mass set to GeV, default renormalization and factorization scales set to , and the strong coupling set to . All numerical results have been obtained with the latest standard model parameters for particle masses, widths and couplings [199]. The PDF uncertainties include those from the proton and nuclear PDFs combined in quadrature, as obtained from the corresponding 56 + 96 (52 + 32) eigenvalues of the CT14 + EPPS16 (CT10 + EPS09) sets. The theoretical uncertainty arising from the scale choice is estimated by modifying and within a factor of two with respect to their default values. In the case, such a NNLO+NNLL calculation yields predicted cross sections in very good agreement with the experimental data at , 8, and 13 TeV at the LHC [201, 202, 203, 204, 205, 206]. The computed nucleon-nucleon cross sections are then scaled by the Pb mass number () to obtain the corresponding Pb cross sections.
| total | fiducial | ||
| PDF sets | CT10 | CT14 | CT14 |
| 265.8 (PDF) pb | 272.6 (PDF) pb | 31.53 (PDF) pb | |
| PDF sets | CT10 + EPS09 | CT14 + EPPS16 | CT14 + EPPS16 |
| Pb | 57.5 (PDF) nb | 59.0 5.3(PDF) nb | 6.82 0.61(PDF) nb |
| 1.04 (PDF) | 1.04 0.07(PDF) | 1.04 0.07(PDF) | |
The total cross sections for and Pb collisions for various proton and lead PDFs are listed in the first two columns of Table 4, as well as the nuclear modification factor . For Pb, the CT14 + EPPS16 calculations give a central cross section 2.6% larger than that computed with CT10 + EPS09. The cross section uncertainties linked to the PDF choice are % for CT14 + EPPS16, and for CT10 + EPS09. The theoretical , and scale uncertainties amount to . Compared to the corresponding results, a small net overall antishadowing effect increases the total top-quark cross section by 4% for both the EPPS16 and EPS09 sets, , where the proton PDF and theoretical scale uncertainties cancel out in the ratio.
Fiducial top-pair production cross sections can be measured in the +jets channel at the LHC taking into account their decay branching ratio (BR %), the basic ATLAS/CMS detector acceptance constraints, and standard final-state selection criteria applied to remove +jets and QCD multijet backgrounds [201, 204, 205], such as:
-
1.
One isolated charged lepton () with GeV, , and ;
-
2.
Four jets (reconstructed employing the anti- algorithm with ) with GeV and ;
-
3.
Lepton-jets separation of .
Often such cuts are sufficient to carry out the measurement although, if needed, a threshold on the missing transverse momentum from the unobserved neutrino can be added.
The impact of such cuts, evaluated with , indicates a 39.5% acceptance for the total cross section with a very small dependence on the underlying PDF (the maximum difference in acceptances using the proton and ion PDFs amounts to % on the final cross section). The events that pass such selection criteria are then often required in addition to having two -tagged jets. For an intermediate -tagging efficiency of 70%, this results in a final combined acceptanceefficiency of % for a -enriched sample consisting of one isolated charged lepton, two light-quark jets, and two -jets. Taking into account the +jets branching ratio (BR ), the aforementioned acceptance and efficiency, and the 180 nb-1 integrated luminosities collected by ATLAS and CMS in Pb collisions at 8.16 TeV, top-quark pair events may be expected to be reconstructed in the decay channel.
9.2 Differential distributions
As seen in the previous section, the total integrated cross sections are modified by only a few percent by nPDF effects in Pb compared to collisions at 8.16 TeV, giving . However, Fig. 43 indicates that processes at different values, i.e. probed at different rapidities and/or transverse momenta of the produced top quarks, should be much more sensitive to the underlying positive (antishadowing) and negative (EMC and shadowing) modifications. This was quantitatively confirmed in Ref. [193] which showed that rapidity distributions of the isolated leptons in the fully-leptonic decay mode are indeed sensitive to the underlying nPDF and can be used to reduce the uncertainties of the EPS09 nuclear gluon density. A similar study is presented here, but for the +jets channel, , and using the recent EPPS16 nPDF set. Figure 44 shows the nuclear modification factors, , as a function of transverse momentum (, left panels) and rapidity (, right panels) for the produced top quarks, (a) and (b), their isolated decay leptons, (c) and (d), and their -jet decays, (e) and (f) as obtained with EPPS16 (dotted curves) and EPS09 (solid curves). Any effect related to the choice of the proton PDF (CT10 or CT14) mostly cancels in the Pb/ ratio. This ratio is then most sensitive to modifications of the nuclear gluon densities alone. The effect of antishadowing (shadowing or EMC) in the nPDF results in small enhancements (deficits) in the distributions at lower (higher) as well as at central (forward and backward) rapidities (). In general, the effects are larger for the initially-produced top quarks than for their decay products (isolated leptons and -jets), but are nonetheless also visible for the latter.
l0.65inb1.425in(a)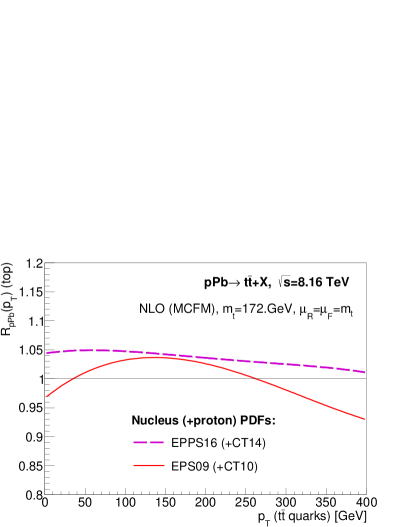 \stackinsetl0.65inb1.45in(b)
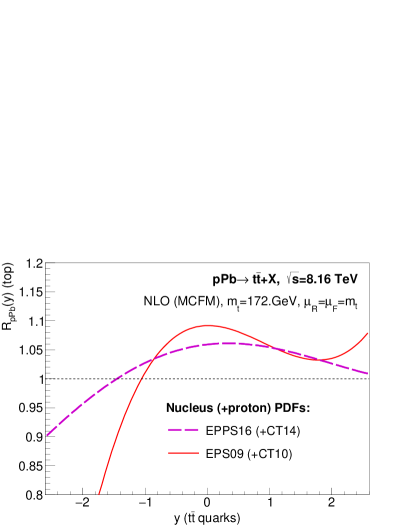 \stackinsetl0.65inb1.45in(c)
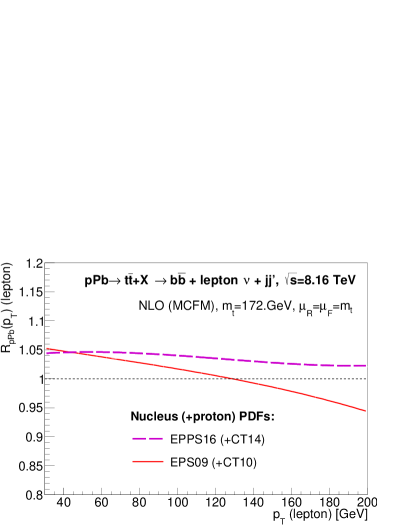 \stackinsetl0.65inb1.45in(d)
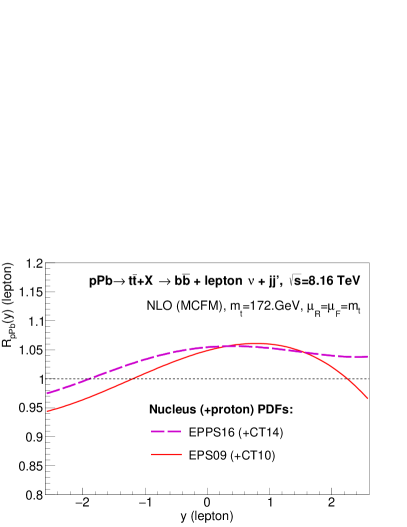 \stackinsetl0.65inb1.45in(e)
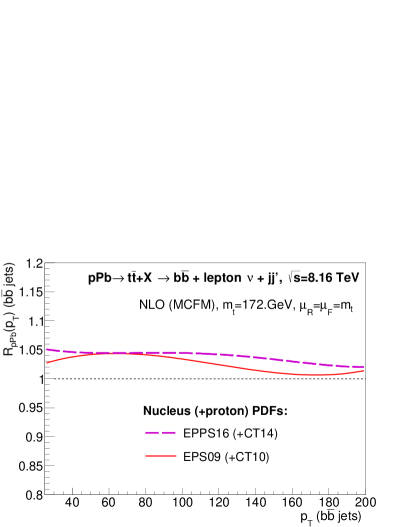 \stackinsetl0.65inb1.46in(f)
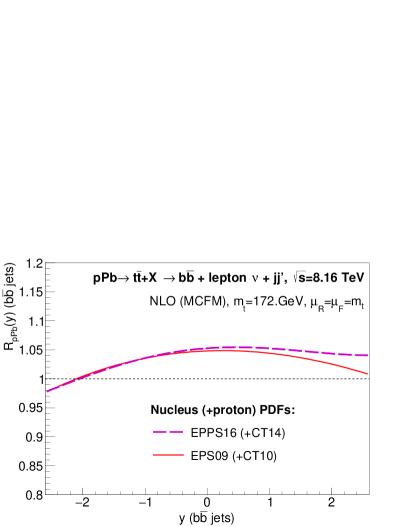
9.3 Summary of top quark production
The total, fiducial, and differential cross sections for top-quark pair production in Pb collisions at TeV have been computed at up to NNLO+NNLL accuracy using the CT14 and CT10 proton PDFs and the EPPS16 and EPS09 nuclear PDFs. The total cross sections are (CT14+EPPS16) (scale) nb and (CT10+EPS09) (scale) nb, a few percent modification with respect to the result obtained using only the free proton PDFs, . In the lepton+jets decay mode, , one expects 600 events in the 180 nb-1 integrated luminosity collected at the LHC, after typical ATLAS/CMS acceptance cuts and efficiency losses. The ratios of the differential cross sections in Pb relative to those in collisions as functions of the and rapidity of the charged decay leptons and of the -jets are sensitive to the antishadowing and EMC gluon density modifications at high virtualities in the nucleus. Precise differential measurements of top-quark pair production thus provide a novel tool for studying the nuclear parton distribution functions in a so-far unexplored kinematic regime.
10 Summary
Theoretical predictions for the production cross sections and yields of charged hadrons, identified light hadrons, quarkonium and heavy-flavor hadrons, Drell-Yan dileptons, jets, photons, gauge bosons, and top quarks in Pb collisions at TeV, of relevance for the November 2016 Pb run at the LHC, have been compiled. The corresponding predictions of the normalized Pb to cross section ratios have been presented for most of the observables, providing new insights on the expected role of cold nuclear matter effects over a wider region of phase space than ever before available.
When multiple predictions for the same observable are presented, the results are compared. These results are generally compatible with each other. Exceptions include the charged hadron multiplicity distributions in Sec. 3.1 and the and meson calculations in Sec. 4.2. The main difference between the heavy flavor results is the inclusion of the Cronin effect in the calculations by Vitev et al. and its absence in the data-driven shadowing only calculations by Lansberg and Shao.
The data so far available from ALICE and LHCb in Sec. 4.1.1 highlight the need for measurements that can more directly and more stringently constrain the low gluon distribution in the nucleus. A future electron-ion collider can only provide a partial answer since the low reach is not as great at the proposed US facilities as that covered by the LHC experiments. Future global analyses that employ the 5.02 and 8.16 TeV Pb lead results will be helpful but perhaps not sufficient to provide a definitive answer.
The predictions shown here, in large part, focus on minimum bias collisions and hard processes. It is worth noting that the high multiplicity Pb and data show very interesting results suggesting collective phenomena akin to that observed in nucleus-nucleus collisions in these much smaller systems. While the phenomenology of these systems is still in development and not as mature as the cold matter effects discussed here, many exciting results in this area can be expected in the future. For example, double (and even triple) parton interactions, although not discussed here, have been shown to play a role at the LHC, for example, in like-sign charm production, as observed by LHCb [189]. Since these are included in , they will also be part of .
11 Acknowledgments
T. L. and B. D. are supported by the European Research Council grant ERC-2015-CoG-681707 and by the Academy of Finland, Grants No. 267321, No. 273464 and No. 303756. The research of K. J. E. and H. P. was supported by the Academy of Finland, Project 297058. The work of K. K. has been supported by Narodowe Centrum Nauki with Sonata Bis grant DEC-2013/10/E/ST2/00656. P. K. acknowledges the support of grants DE-SC-0002145 and DE-FG02-93ER40771. H. M., B. P. S., P. T. and R. Venugopalan are supported under DOE Contract No. DE-SC0012704. S. S. is supported by DOE Award No. DE-FG02-97ER410014. The research of B. P. S., S. S., P. T. and R. Venugopalan used resources of the National Energy Research Scientific Computing Center, supported by the Office of Science of the U. S. Department of Energy under Contract No. DE-AC02-05CH11231. The research of B. D., T. L. and H. M. used the computing resources of CSC—IT Center for Science in Espoo, Finland. The work of E. G. F. is supported by the Ministerio de Ciencia e Innovacion of Spain under project FPA2014-58293-C2-1-P. The work of J. P. L. is supported in part by the French CNRS via the LIA FCPPL (Quarkonium4AFTER) and the Défi Inphyniti-Théorie LHC France. The work of A. R. was supported in part by Fondecyt grant 1150135, Anillo ACT1406, Conicyt PIA/Basal FB0821 and ECOS- Conicyt C14E01. Z. W. L. acknowledges the support of the NSFC of China under grant no. 11628508. H. S. S. is supported by the ILP Labex (ANR-11-IDEX-0004-02, ANR-10-LABX-63). The research of R. Vogt was supported in part by the U. S. Department of Energy under Contract No. DE-AC52-07NA27344. The work of P. R., B.-W. Z, and E. W. is supported in part by the Ministry of Science and Technology in China under Project Nos. 2014CB845404, 2014DFG02050, and by NSFC of China with Project Nos. 11322546, 11435004, and 11521064. The work on and was supported by the Hungarian-Chinese cooperation grant No TéT 12 CN-1-2012-0016 and No. MOST 2014DFG02050, Hungarian National Research Fund (OTKA) grants K123815 and K120660. G. G. B. also thanks the János Bolyai Research Scholarship of the Hungarian Academy of Sciences and acknowledges the support of the Wigner GPU laboratory. I. V. is supported by the U.S. Department of Energy, Office of Science under Contract No. DE-AC52-06NA25396 and by the DOE Early Career Program. The research of Z. K. is funded by the DOE Office of Science Contract No. DE-AC52-06NA25396. H. X. is supported under Contract DE-FG02-91ER40684 of the DOE Office of Science. D. d’E. acknowledges discussions with H. Paukkunen on the interface of EPPS16 to .
References
- [1] ALICE Collaboration, CERN-ALICE-PUBLIC-2017-001.
- [2] R. Aaij et al. [LHCb Collaboration], arXiv:1706.07122 [hep-ex].
- [3] J. L. Albacete et al., Int. J. Mod. Phys. E 22 (2013) 1330007.
- [4] J. L. Albacete et al., Int. J. Mod. Phys. E 25 (2016) 1630005.
- [5] K. J. Eskola, P. Paakkinen, H. Paukkunen and C. A. Salgado, Eur. Phys. J. C 77 (2017) 163.
- [6] C. Loizides, Nucl. Phys. A 956 (2016) 200.
- [7] K. Dusling, W. Li and B. Schenke, Int. J. Mod. Phys. E 25 (2016) 1630002.
- [8] P. Romatschke, Eur. Phys. J. C 77 (2017) 21.
- [9] J. Berges, K. Reygers, N. Tanji and R. Venugopalan, Phys. Rev. C 95 (2017) 054904.
- [10] H. Mäntysaari and B. Schenke, Phys. Rev. Lett. 117 (2016) 052301.
- [11] H. Mäntysaari, B. Schenke, C. Shen and P. Tribedy, Phys. Lett. B 772 (2017) 681.
- [12] B. Schenke, Nucl. Phys. A 967 (2017) 105.
- [13] A. Adare et al. [PHENIX Collaboration], Phys. Rev. Lett. 114 (2015) 192301.
- [14] A. Adare et al. [PHENIX Collaboration], Phys. Rev. Lett. 115 (2015) 142301.
- [15] B. Schenke and R. Venugopalan, Nucl. Phys. A 931 (2014) 1039.
- [16] P. Romatschke, Eur. Phys. J. C 75 (2015) 305.
- [17] S. Chatrchyan et al. [CMS Collaboration], Eur. Phys. J. C 74 (2014) 2951.
- [18] V. Khachatryan et al. [CMS Collaboration], Phys. Lett. B 750 (2015) 565.
- [19] V. Khachatryan et al. [CMS Collaboration], Phys. Lett. B 759 (2016) 36.
- [20] G. Aad et al. [ATLAS Collaboration], Phys. Rev. C 92 (2015) 044915.
- [21] G. Onengut et al. [CHORUS Collaboration], Phys. Lett. B 632 (2006) 65.
- [22] T. Lappi and H. Mäntysaari, Phys. Rev. D 88 (2013) 114020.
- [23] J. L. Albacete, N. Armesto, J. G. Milhano, P. Quiroga-Arias and C. A. Salgado, Eur. Phys. J. C 71 (2011) 1705.
- [24] F. Aaron et. al. [H1 and ZEUS Collaborations], JHEP 1001 (2010) 109.
- [25] L. Gribov, E. Levin and M. Ryskin, Phys. Rept. 100 (1983) 1.
- [26] Y. V. Kovchegov and K. Tuchin, Phys. Rev. D 65 (2002) 074026.
- [27] D. de Florian, R. Sassot and M. Stratmann, Phys. Rev. D 75 (2007) 114010.
- [28] F. Gelis, T. Lappi and L. McLerran, Nucl. Phys. A 828 (2009) 149.
- [29] B. Schenke, P. Tribedy and R. Venugopalan, Phys. Rev. Lett. 108 (2012) 252301.
- [30] B. Schenke, P. Tribedy and R. Venugopalan, Phys. Rev. C 89 (2014) 024901.
- [31] L. McLerran and P. Tribedy, Nucl. Phys. A 945 (2016) 216.
- [32] H. Kowalski and D. Teaney, Phys. Rev. D 68 (2003) 114005.
- [33] A. H. Rezaeian, M. Siddikov, M. Van de Klundert and R. Venugopalan, Phys. Rev. D 87 (2013) 034002.
- [34] B. Schenke, S. Schlichting and R. Venugopalan, Phys. Lett. B 747 (2015) 76.
- [35] B. Schenke, S. Schlichting, P. Tribedy and R. Venugopalan, Phys. Rev. Lett. 117 (2016) 162301.
- [36] X. N. Wang and M. Gyulassy, Phys. Rev. D 44 (1991) 3501.
- [37] G. G. Barnaföldi et al., arXiv:1701.08496 [hep-ph].
- [38] T. Sjostrand, Comput. Phys. Commun. 82 (1994) 74.
- [39] B. Nilsson-Almqvist and E. Stenlund, Comput. Phys. Commun. 43 (1987) 387.
- [40] L. Lonnblad, Comput. Phys. Commun. 71 (1992) 15.
- [41] CERNLib: https://cernlib.web.cern.ch/cernlib/ (2017)
- [42] W. T. Deng, X. N. Wang and R. Xu, Phys. Rev. C 83 (2011) 014915.
- [43] X. N. Wang, Phys. Rev. C 61 (2000) 064910.
- [44] T. Sjöstrand et al., Comput. Phys. Commun. 191 (2015) 159.
- [45] A. Buckley et al., Eur. Phys. J. C 75 (2015) 132; http://lhapdf.hepforge.org/ (2017)
- [46] P. Skands, S. Carrazza and J. Rojo, Eur. Phys. J. C 74 (2014) 3024.
- [47] P. Z. Skands, Phys. Rev. D 82 (2010) 074018.
- [48] This and previous versions of the codes are available at http://myweb.ecu.edu/linz/ampt
- [49] Z. W. Lin, C. M. Ko, B. -A. Li, B. Zhang and S. Pal, Phys. Rev. C 72 (2005) 064901.
- [50] Z. W. Lin, Phys. Rev. C 90 (2014) 014904.
- [51] G. L. Ma and Z. W. Lin, Phys. Rev. C 93 (2016) 054911.
- [52] M. Gyulassy, I. Vitev, X. -N. Wang and B. -W. Zhang, In *Hwa, R.C. (ed.) et al.: Quark gluon plasma* 123-191 [nucl-th/0302077].
- [53] I. Vitev and M. Gyulassy, Phys. Rev. Lett. 89 (2002) 252301.
- [54] Z. B. Kang, I. Vitev, E. Wang, H. Xing and C. Zhang, Phys. Lett. B 740 (2015) 23.
- [55] J. w. Qiu and I. Vitev, Phys. Lett. B 570 (2003) 161,
- [56] I. Vitev, Phys. Lett. B 606 (2005) 303.
- [57] I. Vitev and B.-W. Zhang, Phys. Lett. B 669 (2008) 337.
- [58] I. Vitev, Phys. Rev. C 75 (2007) 064906.
- [59] R. B. Neufeld, I. Vitev and B.-W. Zhang, Phys. Lett. B 704 (2011) 590.
- [60] Z. B. Kang, I. Vitev and H. Xing, Phys. Rev. C 92 (2015) 054911.
- [61] J. -W. Qiu and I. Vitev, Phys. Lett. B 587 (2004) 52.
- [62] Y. Zhang, G. I. Fai, G. Papp, G. G. Barnafoldi and P. Levai, Phys. Rev. C 65 (2002) 034903.
- [63] G. Papp, G. G. Barnafoldi, P. Levai and G. I. Fai, hep-ph/0212249.
- [64] A. D. Martin, R. G. Roberts, W. J. Stirling and R. S. Thorne, Eur. Phys. J. C 28 (2003) 455.
- [65] S. Albino, B. A. Kniehl, G. Kramer and W. Ochs, Eur. Phys. J. C 36 (2004) 49.
- [66] A. Adeluyi, G. G. Barnafoldi, G. Fai and P. Levai, Phys. Rev. C 80 (2009) 014903.
- [67] G. G. Barnafoldi, J. Barrette, M. Gyulassy, P. Levai and V. Topor Pop, Phys. Rev. C 85 (2012) 024903.
- [68] J. W. Cronin et al. [CP Collaboration], Phys. Rev. D 11 (1975) 3105.
- [69] D. Antreasyan, J. W. Cronin, H. J. Frisch, M. J. Shochet, L. Kluberg, P. A. Piroue and R. L. Sumner, Phys. Rev. D 19 (1979) 764.
- [70] K. J. Eskola, H. Paukkunen and C. A. Salgado, JHEP 0904 (2009) 065.
- [71] A. H. Rezaeian, Phys. Rev. D 85 (2012) 014028.
- [72] J. L. Albacete, A. Dumitru, H. Fujii and Y. Nara, Nucl. Phys. A 897 (2013) 1.
- [73] A. H. Rezaeian, Phys. Lett. B 718 (2013) 1058.
- [74] E. Levin and A. H. Rezaeian, Phys. Rev. D 82 (2010) 014022.
- [75] E. Levin and A. H. Rezaeian, AIP Conf. Proc. 1350 (2011) 243 [arXiv:1011.3591 [hep-ph]].
- [76] E. Levin and A. H. Rezaeian, Phys. Rev. D 82 (2010) 054003.
- [77] E. Levin and A. H. Rezaeian, Phys. Rev. D 83 (2011) 114001.
- [78] A. H. Rezaeian, Phys. Lett. B 727 (2013) 218.
- [79] A. H. Rezaeian and I. Schmidt, Phys. Rev. D 88 (2013) 074016.
- [80] N. Armesto and A. H. Rezaeian, Phys. Rev. D 90 (2014) 054003.
- [81] B. B. Back et al. [PHOBOS Collaboration], Phys. Rev. Lett. 93 (2004) 082301.
- [82] I. Arsene et al. [BRAHMS Collaboration], Phys. Rev. Lett. 94 (2005) 032301.
- [83] T. Lappi, Phys. Rev. C 67 (2003) 054903.
- [84] A. Krasnitz, Y. Nara and R. Venugopalan, Phys. Rev. Lett. 87 (2001) 192302.
- [85] K. Aamodt et al. [ALICE Collaboration], Eur. Phys. J. C 68 (2010) 345.
- [86] S. Chatrchyan et al. [CMS Collaboration], Phys. Lett. B 718 (2013) 705.
- [87] G. Aad et al. [ATLAS Collaboration], Eur. Phys. J. C 76 (2016) 199.
- [88] J. Adam et al. [ALICE Collaboration], Phys. Rev. C 91 (2015) 064905.
- [89] V. Khachatryan et al. [CMS Collaboration], Eur. Phys. J. C 75 (2015) 237.
- [90] The ATLAS collaboration [ATLAS Collaboration], ATLAS-CONF-2014-029, ATLAS-COM-CONF-2014-031.
- [91] G. Aad et al. [ATLAS Collaboration], Phys. Lett. B 763 (2016) 313.
- [92] B. B. Abelev et al. [ALICE Collaboration], Eur. Phys. J. C 74 (2014) 3054.
- [93] V. Khachatryan et al. [CMS Collaboration], 5.02 TeV,” arXiv:1611.01664 [nucl-ex].
- [94] D. d’Enterria, K. J. Eskola, I. Helenius and H. Paukkunen, Nucl. Phys. B 883 (2014) 615.
- [95] I. Helenius, K. J. Eskola, H. Honkanen and C. A. Salgado, JHEP 1207 (2012) 073
- [96] P. Aurenche, M. Fontannaz, J. P. Guillet, B. A. Kniehl and M. Werlen, Eur. Phys. J. C 13 (2000) 347.
- [97] H. L. Lai, M. Guzzi, J. Huston, Z. Li, P. M. Nadolsky, J. Pumplin and C.-P. Yuan, Phys. Rev. D 82 (2010) 074024.
- [98] S. Kretzer, Phys. Rev. D 62 (2000) 054001.
- [99] B. A. Kniehl, G. Kramer and B. Potter, Nucl. Phys. B 582 (2000) 514.
- [100] D. de Florian, R. Sassot and M. Stratmann, Phys. Rev. D 76 (2007) 074033.
- [101] A. Dumitru, A. Hayashigaki and J. Jalilian-Marian, Nucl. Phys. A 765 (2006) 464.
- [102] J. L. Albacete and A. Dumitru, arXiv:1011.5161.
- [103] J. Jalilian-Marian and A. H. Rezaeian, Phys. Rev. D 85 (2012) 014017.
- [104] D. G. d’Enterria, nucl-ex/0302016.
- [105] B. B. Abelev et al. [ALICE Collaboration], Phys. Lett. B 728 (2014) 25.
- [106] S. Chatrchyan et al. [CMS Collaboration], Eur. Phys. J. C 74(2014) 2847.
- [107] E. Schnedermann, J. Sollfrank and U. W. Heinz, Phys. Rev. C 48 (1993) 2462.
- [108] K. Werner, B. Guiot, I. Karpenko and T. Pierog, Phys. Rev. C 89 (2014) 064903.
- [109] B. Ducloué, T. Lappi and H. Mäntysaari, Phys. Rev. D 94 (2016) 074031.
- [110] W. Li [CMS Collaboration], Ann. Phys. 352 (2015) 35.
- [111] S. Chatrchyan et al. [CMS Collaboration], JHEP 1402 (2014) 088.
- [112] A. Bzdak and G. L. Ma, Phys. Rev. Lett. 113 (2014) 252301.
- [113] S. Chatrchyan et al. [CMS Collaboration], Phys. Lett. B 724 (2013) 213.
- [114] R. E. Nelson, R. Vogt and A. D. Frawley, Phys. Rev. C, 87 (2013) 014908.
- [115] R. Vogt, Phys. Rev. C 92 (2015) 034909.
- [116] J. P. Lansberg and H. S. Shao, Eur. Phys. J. C 77 (2017) 1.
- [117] M. R. Whalley, D. Bourilkov, and R. C. Group, arXiv:hep-ph/0508110.
- [118] H. S. Shao, Comput. Phys. Commun. 198 (2016) 238.
- [119] K. Kovarik et al., Phys. Rev. D 93 (2016) 085037.
- [120] S. Dulat et al., Phys. Rev. D 93 (2016) 033006.
- [121] F. Arleo and S. Peigné, Phys. Rev. Lett. 109 (2012) 122301.
- [122] F. Arleo and S. Peigné, JHEP 1303 (2013) 122.
- [123] S. Peigné, F. Arleo, and R. Kolevatov, Phys. Rev. D 98 (2016) 014006.
- [124] M. J. Leitch et al. [NuSea Collaboration], Phys. Rev. Lett. 84 (2000) 3256.
- [125] F. Arleo, S. Peigné, and T. Sami, Phys. Rev. D 83 (2011) 114036,
- [126] B. Abelev et al. [ALICE Collaboration], JHEP 1402 (2014) 073.
- [127] R. Aaij et al. [LHCb Collaboration], JHEP 1402 (2014) 072.
- [128] J. Adam et al. [ALICE Collaboration], JHEP 1506 (2015) 055.
- [129] A. Adare et al. [PHENIX Collaboration], Phys. Rev. Lett. 111 (2013) 202301.
- [130] B. B. Abelev et al. [ALICE Collaboration], JHEP 1412 (2014) 073.
- [131] R. Arnaldi [ALICE Collaboration], Nucl. Phys. A 931 (2014) 628.
- [132] R. Aaij et al. [LHCb Collaboration], JHEP 1603 (2016) 133.
- [133] E. G. Ferreiro, Phys. Lett. B 749 (2015) 98.
- [134] S. Gavin and R. Vogt, Phys. Rev. Lett. 78 (1997) 1006.
- [135] A. Capella, A. Kaidalov, A. Kouider Akil and C. Gerschel, Phys. Lett. B 393 (1997) 431.
- [136] N. Armesto and A. Capella, Phys. Lett. B 430 (1998) 23.
- [137] N. Armesto, A. Capella and E. G. Ferreiro, Phys. Rev. C 59 (1999) 395.
- [138] A. Capella, E. G. Ferreiro and A. B. Kaidalov, Phys. Rev. Lett. 85 (2000) 2080.
- [139] A. Capella and E. G. Ferreiro, Eur. Phys. J. C 42 (2005) 419.
- [140] A. Capella and E. G. Ferreiro, Phys. Rev. C 76 (2007) 064906.
- [141] A. Capella, L. Bravina, E. G. Ferreiro, A. B. Kaidalov, K. Tywoniuk and E. Zabrodin, Eur. Phys. J. C 58 (2008) 437.
- [142] E. G. Ferreiro, Phys. Lett. B 731 (2014) 57.
- [143] E. G. Ferreiro, F. Fleuret, J. P. Lansberg and A. Rakotozafindrabe, J. Phys. Conf. Ser. 422 (2013) 012018.
- [144] E. G. Ferreiro, F. Fleuret, J. P. Lansberg and A. Rakotozafindrabe, Phys. Rev. C 88 (2013) 047901.
- [145] B. Ducloué, T. Lappi and H. Mäntysaari, Phys. Rev. D 91 (2015) 114005.
- [146] L. D. McLerran and R. Venugopalan Phys. Rev. D 49 (1994) 2233.
- [147] L. D. McLerran and R. Venugopalan Phys. Rev. D 49 (1994) 3352.
- [148] E. Iancu and R. Venugopalan arXiv:hep-ph/0303204 [hep-ph].
- [149] F. Gelis, E. Iancu, J. Jalilian-Marian, and R. Venugopalan, Ann. Rev. Nucl. Part. Sci. 60 (2010) 463.
- [150] G. T. Bodwin, E. Braaten, and G. P. Lepage, Phys. Rev. D 51 (1995) 1125.
- [151] Z.-B. Kang, Y.-Q. Ma, and R. Venugopalan, JHEP 1401 (2014) 056.
- [152] Y.-Q. Ma, R. Venugopalan and H.-F. Zhang, Phys. Rev. D 92 (2015) 071901.
- [153] Y.-Q. Ma and R. Venugopalan Phys. Rev. Lett. 113 (2014) 192301.
- [154] J. P. Blaizot, F. Gelis, and R. Venugopalan, Nucl. Phys. A 743 (2004) 57.
- [155] K.-T. Chao, Y.-Q. Ma, H.-S. Shao, K. Wang, and Y.-J. Zhang, Phys. Rev. Lett. 108 (2012) 242004.
- [156] I. Balitsky Nucl. Phys. B 463 (1996) 99.
- [157] Y. V. Kovchegov, Phys. Rev. D 60 (1999) 034008.
- [158] Z. B. Kang, I. Vitev and H. Xing, Phys. Rev. D 88 (2013) 054010.
- [159] M. Luo, J. w. Qiu and G. F. Sterman, Phys. Rev. D 50 (1994) 1951.
- [160] J. w. Qiu and I. Vitev, Phys. Rev. Lett. 93 (2004) 262301.
- [161] R. Aaij et al. [LHCb Collaboration], arXiv:1707.02750 [hep-ex].
- [162] R. Aaij et al. [LHCb Collaboration], JHEP 1308 (2013) 117.
- [163] B. B. Abelev et al. [ALICE Collaboration], JHEP 1402 (2014) 073.
- [164] R. Aaij et al. [LHCb Collaboration], JHEP 1402 (2014) 072.
- [165] F. Arleo and S. Peigné, Phys. Rev. D 95 (2017) 011502.
- [166] S. Catani and M. Grazzini, Phys. Rev. Lett. 98 (2007) 222002.
- [167] S. Catani, L. Cieri, G. Ferrera, D. de Florian and M. Grazzini, Phys. Rev. Lett. 103 (2009) 082001
- [168] A. D. Martin, W. J. Stirling, R. S. Thorne and G. Watt, Eur. Phys. J. C 63 (2009) 189.
- [169] K. Kutak, Phys. Rev. D 91 (2015) 034021.
- [170] A. van Hameren, P. Kotko, K. Kutak and S. Sapeta, Phys. Lett. B 737 (2014) 335.
- [171] A. H. Mueller, B. W. Xiao and F. Yuan, Phys. Rev. D 88 (2013) 114010.
- [172] S. Catani, M. Ciafaloni, F. Hautmann, Nucl. Phys. B 366 (1991) 135.
- [173] P. Kotko, K. Kutak, C. Marquet, E. Petreska, S. Sapeta and A. van Hameren, JHEP 1509 (2015) 106.
- [174] A. van Hameren, P. Kotko, K. Kutak, C. Marquet, E. Petreska and S. Sapeta, JHEP 1612 (2016) 034.
- [175] M. Deak, F. Hautmann, H. Jung and K. Kutak, arXiv:1012.6037 [hep-ph].
- [176] K. Kutak and J. Kwiecinski, Eur. Phys. J. C 29 (2003) 521.
- [177] K. Kutak and A. M. Stasto, Eur. Phys. J. C 41 (2005) 343.
- [178] K. Kutak and S. Sapeta, Phys. Rev. D 86 (2012) 094043.
- [179] I. Schienbein, J. Y. Yu, K. Kovarik, C. Keppel, J. G. Morfin, F. Olness and J. F. Owens, Phys. Rev. D 80 (2009) 094004.
- [180] K. Kovarik, I. Schienbein, F. I. Olness, J. Y. Yu, C. Keppel, J. G. Morfin, J. F. Owens and T. Stavreva, Phys. Rev. Lett. 106 (2011) 122301.
- [181] S. A. Kulagin and R. Petti, Nucl. Phys. A 765 (2006) 126.
- [182] S. A. Kulagin and R. Petti, Phys. Rev. C 90 (2014) 045204.
- [183] S. Alekhin, J. Bluemlein, S. Moch and R. Placakyte, Phys. Rev. D 94 (2016) 114038.
- [184] P. Ru, B. W. Zhang, L. Cheng, E. Wang and W. N. Zhang, J. Phys. G 42 (2015) 085104.
- [185] P. Ru, S. A. Kulagin, R. Petti and B. W. Zhang, Phys. Rev. D 94 (2016) 113013.
- [186] A. J. Zsigmond et al. [CMS Collaboration], Nucl. Phys. A 931 (2014) 718.
- [187] Z. B. Kang and J. W. Qiu, Phys. Lett. B 721 (2013) 277.
- [188] P. Ru, B. W. Zhang, E. Wang and W. N. Zhang, Eur. Phys. J. C 75 (2015) 426.
- [189] R. Aaij et al. [LHCb Collaboration], JHEP 1206 (2012) 141. Addendum: [JHEP 1403 (2014) 108].
- [190] M. Czakon, P. Fiedler and A. Mitov, Phys. Rev. Lett. 110 (2013) 252004.
- [191] J. M. Campbell and R. K. Ellis, Nucl. Phys. Proc. Suppl. 205-206 (2010) 10.
- [192] J. M. Campbell and R. K. Ellis, J. Phys. G 42 (2015) 015005.
- [193] D. d’Enterria, K. Krajczár and H. Paukkunen, Phys. Lett. B 746 (2015) 64.
- [194] D. de Florian, R. Sassot, P. Zurita and M. Stratmann, Phys. Rev. D 85 (2012) 074028.
- [195] L. Frankfurt, V. Guzey and M. Strikman, Phys. Rept. 512 (2012) 255.
- [196] J. Adam et al. [ALICE Collaboration], JHEP 1702 (2017) 077.
- [197] A. Dainese, U. A. Wiedemann, N. Armesto, D. d’Enterria, J. M. Jowett et al., CERN Yellow Report (2017) 635; [arXiv:1605.01389 [hep-ph]].
- [198] L. Apolinário, N. Armesto, G. Milhano, G. Salam and C.A. Salgado, in progress.
- [199] C. Patrignani et al. [Particle Data Group], Chin. Phys. C 40 (2016) 100001.
- [200] J. Gao et al., Phys. Rev. D 89 (2014) 033009.
- [201] S. Chatrchyan et al. [CMS Collaboration], Eur. Phys. J. C 71 (2011) 1721.
- [202] S. Chatrchyan et al. [CMS Collaboration], JHEP 1107 (2011) 049.
- [203] G. Aad et al. [ATLAS Collaboration], JHEP 1205 (2012) 059.
- [204] S. Chatrchyan et al. [CMS Collaboration], Eur. Phys. J. C 73 (2013) 2386.
- [205] G. Aad et al. [ATLAS Collaboration], Phys. Rev. D 91 (2015) 112013.
- [206] V. Khachatryan et al. [CMS Collaboration], Phys. Rev. Lett. 116 (2016) 052002.