Abstract
We report on recent results from a target-of-opportunity program to obtain spectropolarimetry observations with the Southern African Large Telescope (SALT) on flaring gamma-ray blazars. SALT spectropolarimetry and contemporaneous multi-wavelength spectral energy distribution (SED) data are being modelled self-consistently with a leptonic single-zone model. Such modeling provides an accurate estimate of the degree of order of the magnetic field in the emission region and the thermal contributions (from the host galaxy and the accretion disk) to the SED, thus putting strong constraints on the physical parameters of the gamma-ray emitting region. For the specific case of the -ray blazar 4C+01.02, we demonstrate that the combined SED and spectropolarimetry modeling constrains the mass of the central black hole in this blazar to .
keywords:
active galaxies — blazars; gamma-rays; polarization — optical; spectropolarimetryx \doinum10.3390/—— \pubvolumexx \externaleditorAcademic Editor: name \historyReceived: date; Accepted: date; Published: date \TitleSALT Spectropolarimetry and Self-Consistent SED and Polarization Modeling of Blazars111based on observations made with the Southern African Large Telescope (SALT) under programme 2016-2-LSP-001 (PI: D. A. H. Buckley) \orcidauthorONE0000-0002-8434-5692 \AuthorMarkus Böttcher1\orcidONE0000-0002-8434-5692, Brian van Soelen2, Richard J. Britto2222for the Fermi-LAT collaboration, David A. H. Buckley3, Johannes P. Marais2 and Hester Schutte1 \AuthorNamesMarkus Böttcher, Brian van Soelen, Richard J. Britto, David A. H. Buckley, Johannes P. Marais and Hester Schutte \corresCorrespondence: Markus.Bottcher@nwu.ac.za; Tel.: +27-18-299-2418
1 Introduction
Blazars are a class of radio-loud, jet-dominated active galactic nuclei whose jets are closely aligned with our line of sight. Due to relativistic Doppler boosting, they are bright and often rapidly variable sources across the entire electromagnetic spectrum. Their spectral energy distribution (SED) is dominated by two broad non-thermal components. The low-frequency component (radio through optical – X-rays) is well understood as synchrotron radiation from relativistic electrons, while for the high-energy component (X-rays through -rays) both leptonic and hadronic emission mechanisms are possible (e.g., Böttcher, 2007; Böttcher et al., 2013; Romero et al., 2017). In leptonic models, the high-energy emission is produced by Compton scattering of soft radiation fields off the same relativistic electrons producing the synchrotron emission. A variety of target photon fields are possible, including the co-spatially produced synchrotron radiation and external photon fields from the accretion disk, the broad-line region, and/or the infrared-emitting dust torus around the central engine (Böttcher, 2007; Ghisellini et al., 2010; Böttcher et al., 2013). In the infrared through UV, also thermal components from the host galaxy and the accretion-disk + dust-torus system add to the SED. Due to the multitude of plausibly contributing radiation components and our lack of knowledge of the dominant particle acceleration mechanism, there is significant ambiguity concerning the underlying particle distributions and the location of and physical conditions within the -ray emission zone (e.g., Ghisellini et al., 2010; Böttcher et al., 2013). These degeneracies can generally not be broken by SED modeling alone.
An additional aspect of radiation, which provides important information, is polarization. While radio polarization is routinely employed to diagnose magnetic-field topologies in the large-scale jets of radio-loud AGN (one of the main topics of this conference), the utility of optical and high-energy (X-ray / -ray) polarimetry as a disgnostic for the physical conditions in the high-energy emission region has only recently begun to be considered (e.g., Zhang & Böttcher, 2013; Marscher, 2014; Zhang et al., 2014, 2015). In view of a multitude of on-going optical polarimetric blazar monitoring programs, this provides a promising avenue for progress in our understanding of the physical conditions in AGN jets. Specifically, the optical emission from blazars is often dominated by synchrotron emission from the jet, which is well-known to be polarized at a degree related to the spectral index of the underlying non-thermal electron distribution (resulting in a synchrotron radiation spectral index ) and the degree of order of the magnetic field through
| (1) |
Additional contributions to the optical spectrum may arise from the host galaxy and a dust torus, which may be dominant towards the red, and from the accretion disk, which may contribute significantly towards the blue end of the spectrum. These thermal contributions are expected to be unpolarized and will reveal their presence through a decline of the degree of polarization (compared to pure synchrotron emission) in spectropolarimetric observations.
The above considerations motivated us to use the Southern African Large Telescope (SALT — see Section 2.2) for spectropolarimetry of flaring Fermi-detected -ray blazars in order to constrain the degree of ordering of the magnetic field in the emission region and the contribution of thermal radiation components to the optical spectrum. We focus on the specific example of the high-redshift () blazar 4C+01.02, which underwent a large -ray flare in July 2016. The resulting SEDs and spectropolarimetry results were modelled with a leptonic single-zone model that self-consistently calculates the SEDs along with the expected optical spectropolarimetry signatures (see Section 3). Results from this combined fitting procedure for the case of 4C+01.02 are presented and discussed in Sections 4 and 5.
2 Observations
Our observations were conducted in the framework of a SALT Large Program on high-energy transients (PI: D. Buckley). This program aims at target-of-opportunity (ToO) spectroscopy and spectropolarimetry observations of various transients, including cataclysmic variables, novae, microlensing events, X-ray binaries, tidal disruption events, gamma-ray bursts, and flaring blazars. In the case of blazars, ToO observations are triggered by flaring activity detected by Fermi-LAT and, when possible, complemented by optical photometry using the Las Cumbres Observatory (LCO) network and X-ray observations with Swift. Within the first year of this program (April 2016 – May 2017), 14 ToO spectropolarimetry observations targeting 7 different blazars (5 Flat Spectrum Radio Quasars [FSRQs] and 2 BL Lac objects) were conducted, revealing generally frequency-dependent polarization degrees in the range – %. In the following we focus on the particularly interesting case of the FSRQ 4C +01.02 (PKS B0106+013; ), which underwent a large -ray flare in July 2016.
2.1 Fermi-LAT
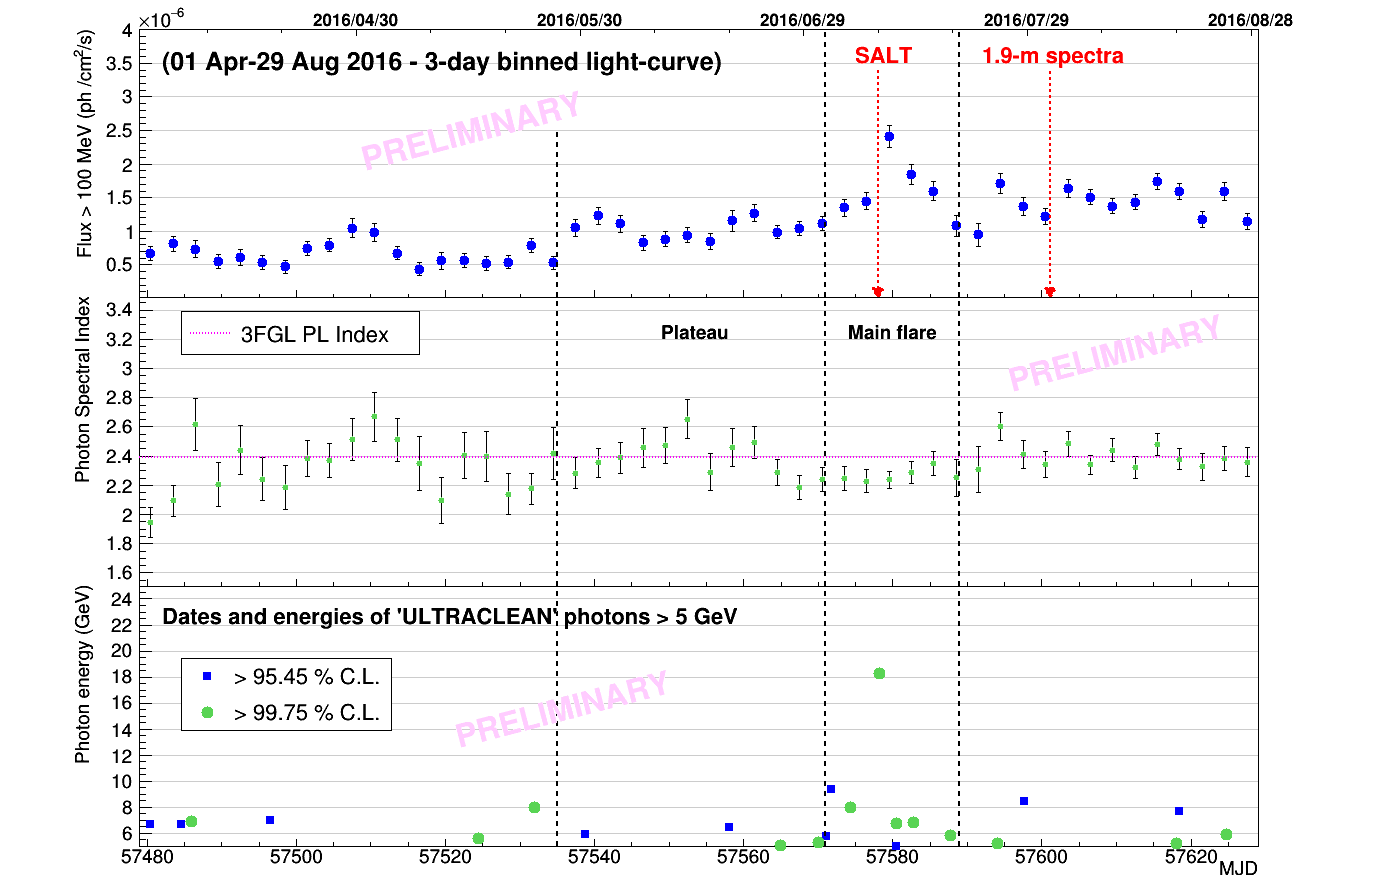
The Fermi Large Area Telescope (LAT), is observing the whole sky every 3 hr, which enables an almost continuous monitoring of the flux variability of bright sources. Fermi-LAT is sensitive to photons from 20 MeV to 300 GeV (Atwood et al., 2009). We analysed data from 4C+01.02 between 100 MeV and 300 GeV during its high state in 2016, using the Pass 8 data representation (Atwood et al., 2013) and the Fermi Science Tools version v10r0p5.111http://fermi.gsfc.nasa.gov/ssc/data/analysis/ We applied the following standard analysis cuts: radius of the Region of interest (ROI)=; Source region=ROI; source class; front + back event type; zenith angle ; DATA_QUAL=1, LAT_CONFIG=1; Diffuse emission: gll_iem_v06.fits (Galactic) and iso_P8R2_SOURCE_V6_v06.txt (extragalactic) templates. In the light-curve processing, we used the unbinned likelihood gtlike/pyLikelihood tool, and modeled the source of interest by a single power law spectrum of photon index . In the SED processing, we used the binned likelihood analysis from the same tool, within the Enrico Python package Sanchez & Deil (2013), for a preliminary SED construction. Fig. 1 shows the light curve of 4C+01.02 during 11 April – 29 August, 2016. We labeled the July 2 – 20 period as “Main flare" as it contains the highest peak in flux for the considered high state, which also was the highest flux ever detected with Fermi-LAT for this source to date ( ph cm-2 s-1 100 MeV on 10 July [MJD 57579], daily average). The SED of the main flare is plotted in Fig. 3 along with multiwavelength data.
2.2 SALT
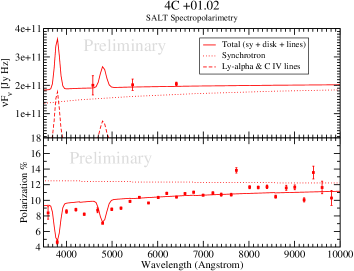
The Southern African Large Telescope (SALT) is a 10-m class telescope, located at the South African Astronomical Observatory (SAAO), near Sutherland, South Africa (buckley06, ). One of its main instruments is the Robert Stobie Spectrograph (RSS), located at the telescope’s prime focus. The RSS is capable of performing spectroscopy in various modes, including long-slit, multi-object slit, polarimetry, and Fabry-Pérot, and is sensitive to wavelengths from 3200 Å to 9000 Å RSS1 ; RSS2 . The results presented in Fig. 2 were obtained using RSS in the spectropolarimetry “LINEAR” mode RSS_pol on 2016 July 9 and November 27, 28 and 29. Each spectrum, along with the polarization degree and polarization angle as a function of wavelength, was obtained through four exposures of 600 s, one for each of the four orientations of the half-wave plates (0∘, 45∘, 22.5∘ and 67.5∘ respectively). Data reduction was performed using the polsalt reduction pipeline.222https://github.com/saltastro/polsalt
![[Uncaptioned image]](/html/1707.09764/assets/4C_SALT.png) Figure 2.
Top panel: SALT RSS count spectra of 4C+01.02 during four observing
windows, including the 2016 July 9 flare indicated in Fig. 1 (blue). Dashed vertical
lines indicate the positions of the following lines: Ly 1216 Å, Si IV 1400 Å,
C IV 1549 Å, C III] 1909 Å and a telluric absorption line. Middle
panel: Linear polarization degree as function of wavelength from SALT spectropolarimetry for the
four SALT observing windows, as in the top panel. Bottom panel: Polarization angle as a
function of wavelength for the four SALT observations.
Figure 2.
Top panel: SALT RSS count spectra of 4C+01.02 during four observing
windows, including the 2016 July 9 flare indicated in Fig. 1 (blue). Dashed vertical
lines indicate the positions of the following lines: Ly 1216 Å, Si IV 1400 Å,
C IV 1549 Å, C III] 1909 Å and a telluric absorption line. Middle
panel: Linear polarization degree as function of wavelength from SALT spectropolarimetry for the
four SALT observing windows, as in the top panel. Bottom panel: Polarization angle as a
function of wavelength for the four SALT observations.
2.3 LCO
The Las Cumbres Observatory (LCO) is a global network of 18 telescopes located at eight different locations brown13 . Observations were undertaken with the 1-m class telescopes using the SBIG CCD. Data reduction followed the standard procedures using the iraf/noao packages. Differential photometry was performed using four nearby comparison stars whose magnitudes were taken from the NOMAD catalog Zacharias et al. (2004). The photometric data points included in Fig. 3 were taken on 2016, August 2.
3 SED and Spectropolarimetry Modeling
The SEDs of blazars are often successfully modelled with simple single-zone leptonic radiation models. In this paper, we adopt the time-independent leptonic blazar emission model described in detail in Böttcher et al. (2013). The code evaluates the non-thermal synchrotron + Compton radiation spectrum based on an equilibrium solution for the electron spectrum, assuming a rapid acceleration mechanism that provides a power-law injection spectrum with index between cut-off energies and that is balanced by self-consistent radiative losses and escape on a time scale where is the size of the spherical emission region. The non-thermal jet emission, direct accretion-disk emission, plus the dominant Ly and C IV emission lines from the BLR (see Fig. 2, top panel), are added up to yield the total SED.
The degree of polarization of the synchrotron emission is evaluated based on the local synchrotron spectral index through Equ. (1). The frequency-dependent degree of polarization of the total observed optical spectrum is then calculated assuming that the direct accretion-disk () + BLR line () emissions are unpolarized, so that
| (2) |
Our fitting procedure consists of adjusting parameters of the model to obtain simultaneous agreement with the SED and spectropolarimetry data of 4C+01.02 during the -ray flare of July 2016. Since only the optical and -ray data are contemporaneous, we include the archival Swift-XRT X-ray spectrum from summed observations in 2007 and 2008 (Ghisellini et al., 2011) as a guide for our spectral fit since they also correspond to a moderately high -ray flux state of the source.
4 Results
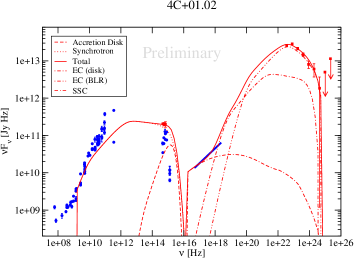
Fig. 3 shows the result of our combined SED + spectropolarimetry fit to 4C+01.02 in July 2016. The parameters used for this fit are listed in Table 1.
| Parameter | Value |
|---|---|
| Electron injection | 230 |
| Electron injection | |
| Electron injection index | 2.1 |
| Kinetic power in radiating electrons | erg/s |
| Doppler factor | 35 |
| Magnetic field | 1 G |
| Magnetic-field order | 0.16 |
| Energy partition ratio | 0.45 |
| Escape time-scale parameter | 1 |
| Emission-region radius | cm |
| Emission-region distance from BH | 0.2 pc |
| Black-hole mass | |
| Accretion-disk luminosity | erg/s = |
| External radiation field | erg/cm3 |
The chosen parameters result in a minimum allowed variability time scale from causality arguments of hr, consistent with the lack of evidence for intra-day variability.
The peak of the accretion-disk emission is well constrained by the spectropolarimetry results to be located near or beyond the blue end of the optical spectrum, requiring a central black-hole mass of . On the other hand, its significant contribution to the observed spectrum requires a luminosity of the order of the Eddington luminosity for a black hole. Thus, the mass of the central black hole in 4C+01.02 is well constrained to be .
5 Summary and Conclusions
We have presented results of ToO spectropolarimetry observations using the SALT RSS, focusing on the case of the high-redshift FSRQ 4C+01.02 during a large -ray flare in July 2016. The contemporaneous SED and spectropolarimetry data were fitted in a consistent way with a single-zone leptonic model. This combined fitting constrained the accretion-disk contribution to the SED and, in particular, the black-hole mass in the center of 4C+01.02 to . This is in tension with the claim by Ghisellini et al. (2011) who modelled the entire optical – UV spectrum of the source to be dominated by direct accretion-disk emission, requiring a black-hole mass of . If such an interpretation of the optical – UV emission from 4C+01.02 is correct, the degree of polarization in the optical should be close to zero. This contradicts our SALT spectropolarimetry results which indicate that even in the moderate-activity state in November 2016, the optical polarization is still of the order of – 10 %. Our combined SED + spectropolarimetry modeling therefore strongly favours a synchrotron-dominated optical emission scenario with the accretion-disk contributing only towards the blue end of the spectrum, requiring a black-hole mass of .
Acknowledgements.
The work of M.B. is supported through the South African Research Chairs Initiative (SARChI) of the South African Department of Science and Technology (DST) and National Research Foundation333Any opinion, finding and conclusion or recommendation expressed in this material is that of the authors, and the NRF does not accept any liability in this regard.. The authors acknowledge further support by the South African DST through the South African Gamma-Ray Astronomy Programme. The authors are grateful for the support provided by S. Crawford and K.H. Nordsieck with reducing the spectropolarimetry observations. This work makes use of observations from the LCO network. Some of the observations reported in this paper were obtained with the Southern African Large Telescope (SALT). The Fermi-LAT Collaboration acknowledges support for LAT development, operation and data analysis from NASA and DOE (United States), CEA/Irfu and IN2P3/CNRS (France), ASI and INFN (Italy), MEXT, KEK, and JAXA (Japan), and the K.A. Wallenberg Foundation, the Swedish Research Council and the National Space Board (Sweden). Science analysis support in the operations phase from INAF (Italy) and CNES (France) is also gratefully acknowledged.References
- Atwood et al. (2009) Atwood, W. B., et al., ApJ, 2009, 697, 1071.
- Atwood et al. (2013) Atwood, W. B., et al., 2012 Fermi Symposium proceedings, eprint arXiv:1303.3514.
- Böttcher (2007) Böttcher, M., Ap&SS, 2007, 309, 95.
- Böttcher et al. (2013) Böttcher, M., Reimer, A., Sweeney, K., & Prakash, A., ApJ, 2013, 768, 54.
- Britto et al. (2017) Britto, R. J., et al., Proceedings of (HEASA2016), Cape Town, South Africa, 2017, PoS(HEASA 2016)021.
- (6) Brown, T.M., et al., PASP, 2013, 125, 1031
- (7) Buckley, D. A. H., Swart, G. P. & Meiring, J. G., SPIE, 2006 6267, 32
- (8) Burgh, E. B., et al., Proceedings of the SPIE, 4841 (2003), pp. 1463–1471
- Ghisellini et al. (2011) Ghisellini, G., et al., MNRAS, 2011, 411, 901.
- Ghisellini et al. (2010) Ghisellini, G., et al., MNRAS, 2010, 402, 497.
- (11) Kobulnicky, H. A.. et al., Proceedings of the SPIE, 4841 (2003), pp. 1634–1644.
- Marscher (2014) Marscher, A. P., ApJ, 2014, 780, 87.
- (13) Potter, S. B., et al.,Proceedings of SPIE 9908 99082K (August 9, 2016), DOI: 10.1117/12.2232391
- Romero et al. (2017) Romero, G. E., Böttcher, M., Markoff, S., & Tavecchio, F., SSRv, 2017, 207, 5.
- Sanchez & Deil (2013) Sanchez, D. A. & Deil, C., In Proceedings of the 33rd ICRC, Rio de Janeiro (Brazil), eprint arXiv:1307.4534.
- Zacharias et al. (2004) Zacharias, N. et al., American Astronomical Society Meeting Abstracts, 2004, 36, 1418
- Zhang & Böttcher (2013) Zhang, H., & Böttcher, M., ApJ, 2013, 774, 18.
- Zhang et al. (2014) Zhang, H., Chen, X., & Böttcher, M., ApJ, 2014, 789, 66.
- Zhang et al. (2015) Zhang, H., et al., ApJ, 2015, 804, 58.