Statistical Modeling of Propagation Channels for Terahertz Band††thanks: This paper is accepted for publication in 2017 IEEE Conference on Standards for Communications & Networking (CSCN 2017).
Abstract
Digital revolution and recent advances in telecommunications technology enable to design communication systems which operate within the regions close to the theoretical capacity limits. Ever–increasing demand for wireless communications and emerging numerous high–capacity services and applications mandate providers to employ more bandwidth–oriented solutions to meet the requirements. Trend and predictions point out that marketplace targets data rates around Gbps or even more within the upcoming decade. It is clear that such rates could only be achieved by employing more bandwidth with the state–of–the–art technology. Considering the fact that bands in the range of GHz–GHz, which are known as Terahertz (THz) bands, are not allocated yet for specific active services around the globe, there is an enormous potential to achieve the desired data rates. Although THz bands look promising to achieve data rates on the order of several tens of Gbps, realization of fully operational THz communications systems obliges to carry out a multi–disciplinary effort including statistical propagation and channel characterizations, adaptive transceiver designs, reconfigurable platforms, advanced signal processing algorithms and techniques along with upper layer protocols equipped with various security and privacy levels. Therefore, in this study, several important statistical parameters for line–of–sight (LOS) channels are measured. High resolution frequency domain measurements are carried out at single–sweep within a span of GHz. Impact of antenna misalignment under LOS conditions is also investigated. By validating exponential decay of the received power in both time and frequency domain, path loss exponent is examined for different frequencies along with the frequency–dependent path loss phenomenon. Furthermore, impact of humidity is also tested under LOS scenario. Measurement results are presented along with relevant discussions and future directions are provided as well.
I Introduction
Wireless data traffic has grown tremendously in the past years. According to the data analysis reports, total Internet traffic will reach ZB whose % will be generated by wireless devices [1]. It should be noted here that not only the volume of data increases exponentially, but also the number of users –and therefore– devices escalate. Short–term predictions reveal that there will be seven billion people with seven trillion nodes/devices connected with each other via various forms of wireless communications technologies [2]. Moreover, it is believed that marketplace targets data rates approaching multi–Gbps even Tbps within ten to fifteen years [3, 4]. Evidently, such rates could only be achieved by either extremely spectral efficient modulations or expanding the transmission bandwidth dramatically. Considering the fact that bands in the range of GHz–GHz, which are known as Terahertz (THz) bands, are not allocated yet for specific active services around the globe, there is an enormous potential to achieve the desired data rates.
Systems operating at THz frequencies are attracting great interest and expected to meet the ever–increasing demand for high–capacity wireless communications as well as consumer expectations. Technological progress towards designing the electronic components operating at THz frequencies will lead to a wide range of applications especially for short–range communications such as chip–to–chip communications, kiosk downloading, device–to–device (D2D) communications, and wireless backhauling [5, 6, 4]. Although THz bands look promising to achieve data rates on the order of several tens of Gbps, realization of fully operational THz communications systems obliges to carry out a multi–disciplinary effort including statistical propagation and channel characterizations, adaptive transceiver designs (including both baseband and radio frequency (RF) front–end portions), reconfigurable platforms, advanced signal processing algorithms and techniques along with upper layer protocols equipped with various security and privacy levels. As in traditional wireless communications systems design process, realization of high–performance and reliable THz communications systems should start with obtaining detailed knowledge about the statistical properties of the propagation channel. Next, these properties are incorporated into various channel characterizations and models. Upon verification and validation of the characterizations and models under different scenarios, system design stage is initiated at the end.
I-A Related Work
Studies that focus on modeling the channel for THz bands in the literature could be categorized in various ways. Measurement methodology; bandwidth; temporal, frequency, and spatial domain behaviors; and application–specific scenarios are some of them among others. Each and every measurement set concentrates on a specific scenario with some parameter changes. For instance, channel measurement results at GHz are described in [7] for different scenarios focusing on path loss measurements under LOS.
Ray tracing is also employed in the literature to characterize the channel from the perspective of several parameters including regarding path loss, delay, angle of arrival, polarization, and angle of departure [8]. But ray tracing approach suffers from the following two problems: (i) A minuscule change in the propagation environment mandates to redo the calculations. Each scenario should be treated separately. Therefore, no insight into fundamental statistics of the channel is provided. (ii) Calculations are computationally intensive and any increase in the area/volume causes the computation time to increase exponentially.
Bearing in mind that THz bands allow vast amount of spectrum to be exploited, certain measurement and processing strategies should be devised due to the practical concerns. For instance, in [9], entire THz region measurement data set is split into relatively smaller chunks and then post–processed. Note that such a “divide–and–conquer” approach is not safe, since there always exists a risk of creating artifacts during compilation. Spatial diversity through the use of multiple–input multiple–output (MIMO) measurements are studied in literature as well. In [10], a –MIMO LOS system operating at THz region with GHz bandwidth is presented. However, there is a significant discrepancy between measurement data presented and the theoretical rates, which needs further research, verification, and validation. Apart from the traditional channel measurements, scenario–specific measurement results are presented in the literature as well. In [11], a D geometrical propagation model for short–range D2D desktop communication channels and multipath fading channels are considered.
Having a brief overview of the measurement studies at hand,111Interested readers may refer to [12, and references therein] for further measurement results and campaigns present in the literature. one could conclude that a systematic and comprehensive channel modeling strategy for THz bands has not been established yet. Although THz bands manifest many intrinsic propagation characteristics and mechanisms, LOS state is preeminent among others because of the following reasons: First, LOS is desired in THz bands for high–performance operation. Second, LOS presents the elementary propagation characteristics. In this regard, a detailed investigation of LOS measurements should be the first step towards acquiring a systematic and comprehensive statistical channel model.
I-B Contributions
Contribution of this study is three–fold considering the statistical channel characterization for THz scenarios: (i) To the best knowledge of authors’, this work provides one of the first single–sweep THz measurement results within GHz–GHz band and relevant statistical analysis. (ii) Detailed statistical analyses of antenna–tilt measurement results under LOS conditions within large–volume anechoic chamber are provided. (iii) In addition, impact of humidity is also considered under LOS scenarios and relevant results are given.
I-C Paper Organization
II Statistical Characterization of Terahertz Channel
II-A System and Signal Model
II-A1 System Model
In this study, LOS transmission scenario for THz channels is investigated. As will be described in Section III, a LOS transmission scenario is established within an anechoic chamber along with very well–isolated setup through the use of absorbers.
In order to characterize the THz channels, several factors and parameters such as channel geometry, relative motion, antenna directivity and radiation patterns along with environmental conditions (e. g., humidity, vapor, dust, etc.) and so on should all be taken into account accordingly. On the other hand, both analysis and transceiver design at further stages should be simplified as well. From this point of view, traditional linear, time–invariant channel model approach will be adopted.
II-A2 Signal Model
Any signal arriving at the receiver antenna at passband could be represented as:
| (1) |
where ; is the real part of its complex input; and represent the in–phase and quadrature components of the complex baseband equivalent of the transmitted signal, respectively; denotes the transmission frequency. Considering a static, general propagation environment, the received signal is modeled as a superposition of multiple copies of the transmitted signal with different delays and attenuation levels. Therefore, the channel at passband could be modeled with:
where denotes the channel impulse response at baseband; is the number of resolvable multipath components; and represent attenuation factor and delay corresponding to –th path, respectively; and represents the Dirac delta function. Complex baseband equivalent of the channel is given by
Static LOS channels are a special sub–class of the multipath channels where . Therefore, the complex baseband equivalent channel can be described as:
| (2) |
where represents the LOS path amplitude with respect to the specular power affected by the environment geometry; is the phase; denotes the propagation delay as a deterministic value of with denoting the transmitter–receiver separation and is the speed of light (m/s). It is important to note here that in case directional antennas used, which is the common practice in THz communications, the impact of misalignment of the antennae; frequency–dependent loss; and frequency dispersion index could all be absorbed by the term, .
In the literature, stochastic description of multipath components in a static environment is generally considered to be superposition of both specular and diffused components such that [13]:
| (3) |
In (3),
| (4) |
and
| (5) |
where denotes the magnitude; is the angle of arrival (AoA); and is the phase of the specular component, respectively. Similarly, is the magnitude of the diffused component; represents the number; is the amplitude; is the AoA; and is the phase of the incoming waves forming the diffused component, respectively. Without loss of generality, both and could be assumed to be unity under idealized conditions. Therefore, could theoretically be represented with Rayleigh distributed in the absence of LOS component under uniform AoA assumption. In case LOS is present, Rice and Nakagami distributions are employed to describe the first–order statistics of .
Because LOS is a special case among all other general wireless propagation scenarios, both large– and small–scale fading mechanisms exhibit intrinsic characteristics. As will be discussed in Section III, fully isolated measurement setup with absorbers in an anechoic chamber guarantees the LOS transmission. This implies that the losses introduced by propagation channel are limited to distance–dependent path loss, possible antenna misalignment(s), and equipment imperfections along with non–ideal behaviors due to operating around/above ideal regions. In this regard, signal model could be deduced down to a direct path experiencing a distant–dependent path loss without shadowing with a possible misalignment. This implies that the contribution of path loss to the term in (2) could be given by:
| (6) |
where denotes the path loss at a reference distance in the antenna far–field; is the path loss exponent whose value depends on the propagation environment and conditions within; is the transmitter–receiver separation; and is the random variable representing the impact of misalignment as a random antenna gain. In the literature, due to its tractability and plausibility, misalignment is considered only from the transmitter or receiver antenna perspective as a zero–mean Gaussian random variable with certain standard deviation, , representing the misalignment.
III Terahertz Measurement Experiment Setup
III-A Description of Measurement Setup
We constructed an experimental measurement setup in the Millimeter Wave and Terahertz Technologies Research Laboratories (MİLTAL) at the Scientific and Technological Research Council of Turkey (TÜBİTAK) in Gebze, Turkey and it can be seen in Figure 1. The dimensions of the anechoic chamber used in the measurements are mmm (lengthwidthheight).
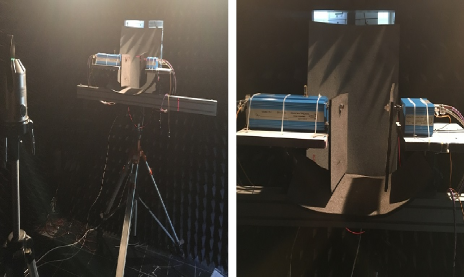
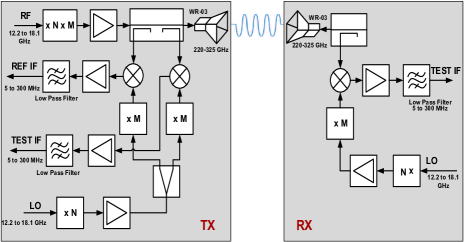
The measurement setup consists of four major parts: Agilent performance network analyzer (PNA) vector network analyzer (VNA) EA, Oleson Microwave Labs (OML) VVNA–T and VVNA–T/R–A millimeter wave extender modules and NA extender controller. Since the upper limit of the VNA is GHz, the GHz to GHz extender modules are attached to the VNA using the controller to measure channel characteristics at THz frequencies. VVNA–T/R–A extender module contains multipliers () that extends GHz to GHz RF input signal to GHz to GHz frequency range. Test intermediate frequency (IF) and reference IF signals for VNA are obtained by using downconversion mixers before transmiting. After passing through the channel, the received signal is downconverted at the receiver module, VVNA–T, by using downconversion mixers and the resulting test IF (MHz to MHz) is fed back to the VNA. Difference in the transmitted and received signal is analyzed to find channel characteristics. The corresponding block diagram of our setup is shown in Figure 2.
The GHz to GHz source modules include balanced multipliers, which are driven by an extended band WR– multiplier chain with a WR– waveguide output interface. The output source match of the modules is typically dB. The RF drive signal may be either continuous wave (CW) or swept frequency. The required RF or local oscillator (LO) signal power to operate OML modules is dBm. The dynamic range is typically dB (min. dB) and the WR– waveguide output power of the VVNA–T/R–A is around dBm. The magnitude and phase stability of the extender modules are dB and , respectively.
In this study, GHz to GHz is specially used to get better performance from the extender modules, in terms of magnitude and phase stability. Channel transfer function is acquired by recording scattering parameters (s–parameter) using the measurement setup shown in Figure 1 and Figure 2. For channel modeling, calibration is performed with direct interconnection of the transmitting and receiving extender module’s waveguide ports. All the later measurements are taken with standard gain horn antenna, with the gain of dBi at the center frequency, attached at both the transmitter and the receiver. Full GHz band measurements are recorded with points averaging and Hz IF bandwidth (BW). These parameters significantly reduce noise floor and improves dynamic range.
III-B Measurement Methodology
VNA measurements are performed for the frequency interval of GHz to GHz. This interval is measured using standard gain horn antennas which are attached to OML extenders. Each spectral measurement is represented with equally spaced frequency points (data points) within the interval specified by the VNA. Therefore, a spectral resolution of MHz is obtained. The measurement system including connectors and cables is calibrated to remove the impairment caused by the components. The calibration data is saved both into the internal memory of the Agilent PNA VNA EA and an external universal serial bus (USB) storage device. Then, the calibration data is removed from the measurement by using its internal memory and provided parameter in complex number format with real and imaginary parts for each data point.
IV Measurement Results
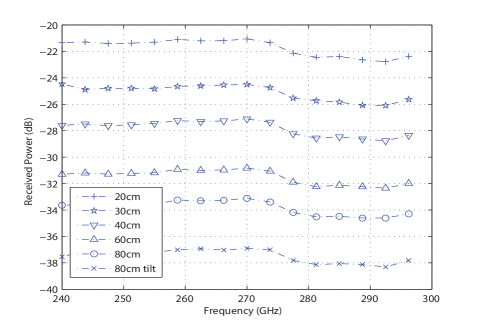
As stated before, channel magnitude response for THz channels is an important qualitative tool. Especially wideband measurements reveal different mechanisms whose effects are obscured in traditional channel characterizations due to relatively narrower band measurements. Frequency–dependent loss is one of them. In this regard, channel magnitude response could be used to analyze the frequency dependency of the loss in frequency domain very easily. In Figure 3, averaged magnitude responses are given. However, first it is appropriate to evaluate the distance–dependent path loss. Based on the measurement data, the path loss coefficients for specific frequencies are given in Table I. Overall mean path loss exponent is found to be based on –point resolution with a variance of by taking into account entire GHz span. This result is in conformity with the LOS argument and with the measurement results reported in the literature [14, 15]. Assuming that the path loss exponent distributed normally, the maximum likelihood estimate of the parameters of the distribution match with the mean perfectly, whereas .
Another important aspect of wideband measurements is to be able to observe the impact of frequency–dependent path loss. Note that frequency dependency stems from the antenna not from the transmission path itself in . This dependency is clearly seen in Figure 3 between –THz as a slight collapse.
| Freq. (GHz) | |||||||
|---|---|---|---|---|---|---|---|
| PL. Exp. () | |||||||
| Overall Statistics | |||||||
| Mean () | , based on points | ||||||
| Variance () | , based on points | ||||||
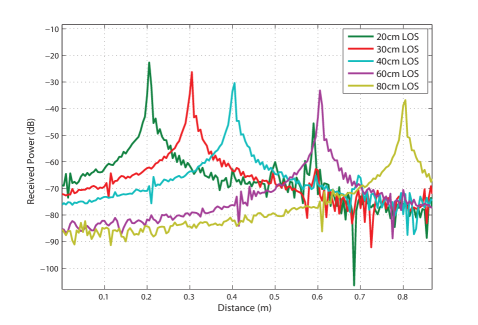
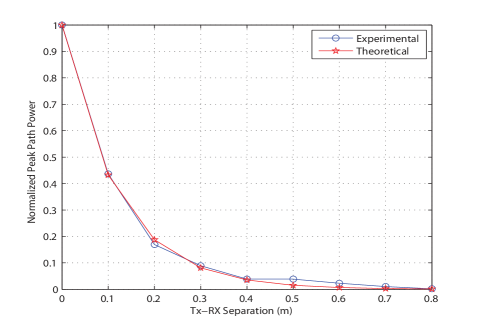
In order to validate the frequency domain results, time domain analysis is carried out as well. By applying inverse fast Fourier Transform (IFFT) operation, time domain data are obtained. Raw time data are plotted in Figure 4. In Figure 4, it is seen that the delay is given in terms of corresponding distance matching with the experimental setup values. After validating the post–processing stage by delay–distance match, raw time data are post–processed further by removing the propagation delay and normalizing the power with respect to the reference power. Results of this procedure are given in Figure 5. As a cross–check for the tabulated results given in Table I, exponential decay in the received power is validated through the use of the impulse responses obtained. Here, it is assumed that the underlying distribution is of exponential form with where is the parameter to be estimated for candidate exponentially distributed random variable where . In addition, assuming that the underlying distribution of the power levels of paths observed/measured is the same exponential distribution with the parameter and that all measurements are independent of each other, the likelihood function, , for the observed/measured data becomes
Applying logarithm on each side reads . Finally, differentiating the –likelihood function with respect to and equating it to zero yields . Therefore, the maximum likelihood estimate of the parameter is obtained by
Both the measured data and corresponding maximum likelihood estimated theoretical curve are plotted in Figure 5. Almost perfect match between the measured and maximum likelihood estimation (MLE)–driven values could be recognized easily in the figure.
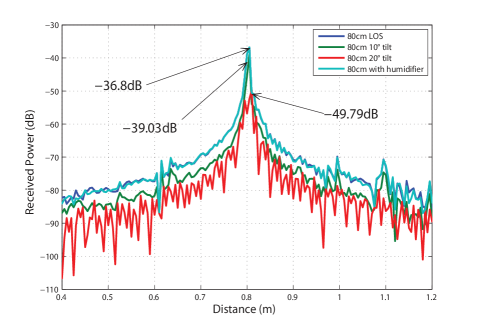
As discussed in Section II-A, antenna misalignment is an important problem for THz communication channels. In this regard, how antenna misalignment affects the received power is evaluated in time domain. The results are given in Figure 6. As can be seen from the figure, antenna misalignment causes a significant drop in the peak power corresponding to LOS path. Measurement results demonstrate that tilt leads to dB, whereas tilt causes dB degradation for the peak power. Note that degradation in power level due to antenna misalignment could also be verified in frequency domain as plotted in Figure 3.
One of the main factors that affects the propagation behavior of THz band signals is the presence of water vapor within the environment. It is known that water vapor molecules introduce not only attenuation but also colored noise [16, 17]. In this regard, the impact of the humidity is also investigated for THz communication channels. Channel impulse response obtained under a humid environment is appended into Figure 6 as well. It is seen that peak power level of the LOS path does not exhibit a significant drop in parallel with the measurement results reported in the literature [18].
V Concluding Remarks and Future Directions
Deploying communication systems operating within THz bands is considered to be an alternative strategy to meet the ever–increasing data rate demands along with escalating number of devices subscribing wireless networks. Due to the technical limitations and propagation loss concerns, THz bands have not attracted a significant attention up until the last couple of years. However, with the technological advances, it is possible to migrate up to THz region. Nevertheless, a successful and reliable communication system relies heavily on well–established propagation channel models and appropriate transceiver designs.
In this study, single–sweep band measurement data for GHz–GHz band are collected in frequency domain with a very high resolution within an anechoic chamber along with a very well isolated setup to emulate the propagation. Behavior of the channel within a GHz span (i.e., GHz–GHz interval) is captured at once. In addition, high–resolution measurement data are collected so that finer temporal details are obtained to help design reliable transceiver systems including antenna misalignment problem. Since scenario provides a theoretical borderline, collected data could be used to validate other results obtained in different measurement campaigns.
Practical applications for THz communications are generally envisioned to operate in short–range such as infotainment systems. This implies that locations and spatial orientations of THz devices could be random especially in residential scenarios.In this regard, non line–of–sight (NLOS) behavior of the channels especially for indoor applications should be examined in detail. Even though there are several studies focusing on LOS and NLOS in the literature, more results are required in order to have a more comprehensive understanding of the channels. Finally, how mobility affects the channel behavior should be studied under different conditions with various measurement campaigns.
Acknowledgment
The authors would like to thank Mr. Mustafa Kılıç from MİLTAL, TÜBİTAK for his help during the measurements.
References
- [1] Cisco, “White Paper: The Zettabyte Era-Trends and Analysis,” Available: http://www.cisco.com/c/en/us/solutions/collateral/service-provider/visual-networking-index-vni/vni-hyperconnectivity-wp.pdf, Accessed: Apr. 18, 2017.
- [2] W. W. R. Forum, “Visions and Research Directions for The Wireless World: Multi–RAT Network Architecture,” Available: http://www.wwrf.ch/files/wwrf/content/files/publications/outlook/Outlook9.pdf, Accessed: Apr. 18, 2017.
- [3] T. Schneider, “Ultrahigh-Bitrate Wireless Data Communications via THz-Links; Possibilities and Challenges,” J. Infrared Milli. Terahz. Waves, vol. 36, no. 2, pp. 159–179, Feb. 2015.
- [4] I. F. Akyıldız, J. M. Jornet, and C. Hana, “Terahertz band: Next frontier for wireless communications,” Physical Communication, vol. 12, pp. 16–32, Sep. 2014.
- [5] T. Kürner and S. Priebe, “Towards THz Communications - Status in Research, Standardization and Regulation,” J. Infrared Milli. Terahz. Waves, vol. 35, no. 1, pp. 53–62, Jan. 2014.
- [6] T. Tajima, T. Kosugi, H.-J. Song, H. Hamada, A. E. Moutaouakil, H. Sugiyama, H. Matsuzaki, M. Yaita, and O. Kagami, “Terahertz MMICs and Antenna-in-Package Technology at 300 GHz for KIOSK Download System,” J. Infrared Milli. Terahz. Waves, vol. 37, no. 2, pp. 1213–1224, Dec. 2016.
- [7] S. Priebe, C. Jastrow, M. Jacob, T. Kleine-Ostmann, T. Schrader, and T. Kürner, “Channel and Propagation Measurements at 300 GHz,” IEEE Trans. Antennas Propag., vol. AP-59, no. 5, pp. 1688–1698, May 2011.
- [8] S. Priebe and T. Kürner, “Stochastic Modeling of THz Indoor Radio Channels,” IEEE Trans. Wireless Commun., vol. WC-12, no. 9, pp. 4445–4455, Sep. 2013.
- [9] N. Khalid and O. B. Akan, “Wideband THz Communication Channel Measurements for 5G Indoor Wireless Networks,” in Proc. IEEE 2016 ICC Int. Conf. Commun., Kuala Lumpur, Malaysia, Jul. 2016, pp. 1–6.
- [10] ——, “Experimental Throughput Analysis of Low-THz MIMO Communication Channel in 5G Wireless Networks,” IEEE Wireless Commun. Lett., vol. WCL-5, no. 6, pp. 616–619, Dec. 2016.
- [11] S. Kim and A. Zajic, “Statistical Modeling and Simulation of Short-Range Device-to-Device Communication Channels at Sub-THz Frequencies,” IEEE Trans. Wireless Commun., vol. WC-15, no. 9, pp. 6423–6433, Sep. 2016.
- [12] T. Kürner, “Towards future THz communications systems,” Terahertz Science and Technology, vol. 5, no. 1, pp. 11–17, Mar. 2012.
- [13] S. Yarkan and H. Arslan, “Identification of LOS in Time-varying, Frequency Selective Radio Channels,” EURASIP J. Wirel. Commun. Netw., vol. 2008, pp. 8:1–8:14, Jan. 2008. [Online]. Available: http://dx.doi.org/10.1155/2008/195948
- [14] S. Kim and A. G. Zajic, “Statistical characterization of 300-ghz propagation on a desktop,” IEEE Transactions on Vehicular Technology, vol. 64, no. 8, pp. 3330–3338, Aug 2015.
- [15] H. Sawada, K. Fujii, A. Kasamatsu, H. Ogawa, K. Ishizu, and F. Kojima, “Path loss model at 300 ghz for indoor mobile service applications,” IEICE Communications Express, vol. 5, no. 11, pp. 424–428, 2016.
- [16] J. M. Jornet and I. F. Akyildiz, “Channel capacity of electromagnetic nanonetworks in the terahertz band,” in 2010 IEEE International Conference on Communications, May 2010, pp. 1–6.
- [17] ——, “Channel modeling and capacity analysis for electromagnetic wireless nanonetworks in the terahertz band,” IEEE Transactions on Wireless Communications, vol. 10, no. 10, pp. 3211–3221, October 2011.
- [18] G. A. Siles, J. M. Riera, and P. G. del Pino, “Atmospheric Attenuation in Wireless Communication Systems at Millimeter and THz Frequencies,” IEEE Antennas Propag. Mag., vol. 57, no. 1, pp. 48–61, Feb. 2015.