Flat optical conductivity in ZrSiS due to two-dimensional Dirac bands
Abstract
ZrSiS exhibits a frequency-independent interband conductivity in a broad range from 250 to 2500 cm-1 (30 – 300 meV). This makes ZrSiS similar to (quasi)two-dimensional Dirac electron systems, such as graphite and graphene. We assign the flat optical conductivity to the transitions between quasi-two-dimensional Dirac bands near the Fermi level. In contrast to graphene, is not supposed to be universal but related to the length of the nodal line in the reciprocal space, . When and are connected by a simple model, we find good agreement between experiment and theory. Due to the spin-orbit coupling, the discussed Dirac bands in ZrSiS possess a small gap , for which we determine an upper bound max() = 30 meV from our optical measurements. At low temperatures the momentum-relaxation rate collapses, and the characteristic length scale of momentum relaxation is of the order of microns below 50 K.
Additionally to the three-dimensional (3D) Dirac and Weyl semimetal phases, the line-node semimetals (LNSM) proposed in 2011 Burkov2011 attract more and more attention Kim2015 ; Ramamurthy2017 ; Fang2015 ; Bian2016 ; Wu2016 ; Yu2015 ; Chen2015 ; Okamoto2016 ; Xie2015 ; Xu2015 ; Schoop2016 ; Neupane2016 ; Topp2016 ; CChen2017 . Unlike the point nodes in Dirac and Weyl semimetals, the linear-band crossings in LNSMs form continuous lines (loops) in reciprocal space. Most recently, it has been shown theoretically that in general the topology of nodal lines within a Brillouin zone (BZ) may be very complex, e.g., nodal lines may be linked and knotted in different ways WChen2017 ; Yan2017 ; Ezawa2017 . The presence of line nodes effectively reduces the dimensionality of the Dirac bands. Thus, a (3D) LNSM is supposed to host 2D Dirac electrons. Such 3D materials with 2D Dirac electrons (i.e. the 3D analogues of graphene) are appealing for both, basic and applied, research, as they are supposed to demonstrate a number of unusual electronic properties that can be useful for potential applications Burkov2011 ; Kim2015 ; Ramamurthy2017 . It is worth noting that the LNSM state can arise in materials with as well as without spin-orbit coupling (SOC) Fang2015 .
An evidence for possible realization of a LNSM state has been recently obtained via angle-resolved photoemission spectroscopy (ARPES) in PbTaSe2 Bian2016 . A state similar to LNSM, but with Dirac arcs instead of closed loops, is reported in PtSn4 Wu2016 . Also, many theoretical propositions are around for materials realizing the LNSM phase, including Cu3PdN Yu2015 , SrIrO3 Chen2015 , CaAgP and CaAgAs Okamoto2016 , as well as a new crystallographic form of Ca3P2 Xie2015 .
Much attention is currently paid to ZrSiS Xu2015 ; Schoop2016 ; CChen2017 ; Neupane2016 and its structural analogues, such as, e.g., HfSiS CChen2017 ; Takane2016 , ZrSiTe Topp2016 ; Hu2016 , and GdSbTe Hosen2017 . The presence of Dirac bands in ZrSiS and its family is well established by several experimental methods, including ARPES Schoop2016 ; Topp2016 ; Wang2016 ; Neupane2016 ; CChen2017 , Hall measurements Singha2016 ; Sankar2017 , and quantum oscillations Wang2016 ; Ali2016 ; Hu2016 ; Singha2016 ; Pezzini2017 ; Sankar2017 ; Matusiak2017 ; Hu2017 , as well as by electronic-structure calculations Schoop2016 ; Topp2016 ; Wang2016 ; Neupane2016 ; CChen2017 . These studies demonstrate that ZrSiS possesses two types of line nodes. The line nodes of the first type are situated far away ( eV) from the Fermi level; we dub them as high-energy nodes. Turning on the SOC opens a gap along certain portions of this nodal line Schoop2016 ; CChen2017 . The line nodes of the second type appear close to the Fermi level (low-energy nodes), but are believed to be fully gapped due to SOC, similarly to such LNSM candidates as Cu3PdN Yu2015 and SrIrO3 Chen2015 . The gap, however, is calculated to be very small, of the order of 10 meV Schoop2016 . Such a small value has indeed been confirmed by recent ARPES measurements CChen2017 , although the resolution was not sufficient to accurately determine the gap size. At higher energies (up to a few hundreds meV), the linearity of the line-node Dirac bands in ZrSiS remains uncompromised Schoop2016 ; CChen2017 . These low-energy line nodes are in focus of the present study.
Dirac electrons in solids are known to manifest themselves in peculiar ways in different experiments Neto2009 ; Hasan2010 ; Wehling2014 ; Vafek2014 ; Armitage2017 . One of such manifestations is in their optical response (i.e., the ac transport), usually expressed in terms of the complex optical conductivity, . For example, in the simplest case of electron-hole symmetric -dimensional ungapped Dirac (Weyl) bands, is supposed to follow a power law, Hosur2012 ; Bacsi2013 .
This optical-conductivity behavior – unusual for conventional materials – has indeed been confirmed for quasi-2D electrons in graphite and graphene, where Kuzmenko2008 ; Mak2008 , and for 3D Dirac electrons in such point-node Dirac/Weyl semimetals as ZrTe5 Chen2015ZrTe5 , Cd3As2 Neubauer2016 , and TaAs Xu2016 , where was reported. As mentioned above, the Dirac electrons in a (3D) LNSM live effectively in two dimensions. Thus, the optical conductivity of a LNSM should be similar to the one of graphene, i.e. frequency-independent. Such flat optical conductivity in LNSMs has indeed been predicted by theory recently Carbotte2017 ; Mukherjee2017 ; Ahn2017 .
Here, we report observation of frequency-independent optical conductivity in ZrSiS. This evidences the existence of quasi-2D Dirac states and a quasi-2D electronic ac transport in this material. From our optical measurements, we extract the length of the nodal line (the node is understood here as the Dirac point of the gapped Dirac band) and estimate the size of the gap in this band.
The investigated single crystals were grown by loading equimolar amounts of Zr, Si, and S together with a small amount of iodine in a sealed quartz tube, which was kept at 1100 ∘C for 1 week. A temperature gradient of 100 ∘C was applied and the crystals were collected at the cold end of the tube. The crystal structure (tetragonal, space group P4/mmm) was confirmed with x-ray and electron diffraction similarly to Ref. Schoop2016 .
The optical reflectivity was measured at 10 to 300 K over a broad frequency range from to 25000 cm-1 using commercial Fourier-transform infrared spectrometers. All measurements were performed on freshly cleaved (001) surfaces. In accordance with the tetragonal structure, no in-plane optical anisotropy was detected. At low frequencies, an in-situ gold evaporation technique was utilized for reference measurements, while above 1000 cm-1 gold and protected silver mirrors served as references. The high-frequency range was extended by room-temperature ellipsometry measurements up to 45 000 cm-1 in order to obtain more accurate results for the Kramers-Kronig analysis Dressel2002 . The Kramers-Kronig analysis was made involving the x-ray atomic scattering functions for high-frequency extrapolations Tanner2015 and dc-conductivity values, , and the reflectivity-fitting procedure Schilling2017 for zero-frequency extrapolations. Important to note, that our optical measurements reflect the bulk material properties, since the penetration depth is above 40 nm for any measurement frequency.
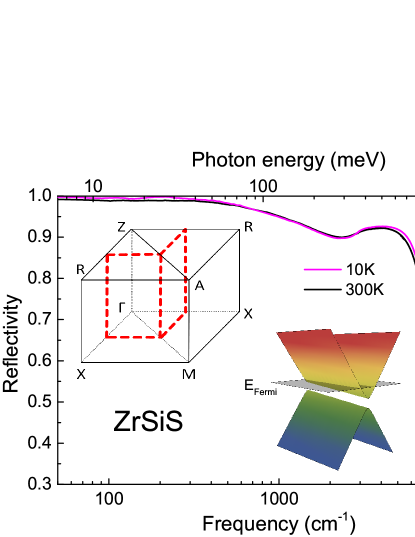
The measured frequency-dependent reflectivity is shown in Fig. 1 for selected temperatures. Above 1000 cm-1, the temperature has only a minor influence on the spectra. In the low-frequency range, the reflectivity is rather high (above ), in agreement with the very low dc resistivity Singha2016 ; Ali2016 . The results of the Kramers-Kronig analysis are shown in Figs. 2 – 4 in terms of the real and imaginary parts of optical conductivity, as well as the real part of permittivity, .
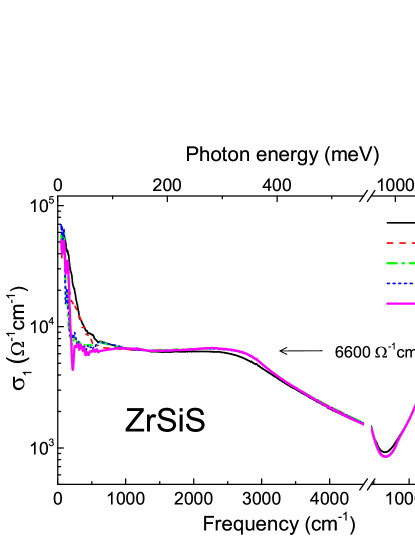
An important result of this work is presented in Fig. 2: the real part of optical conductivity is almost frequency-independent, 6600 cm-1, in the range from 250 to 2500 cm-1 [30 – 300 meV] basically at all temperatures investigated (at K, the flat region starts at a bit higher frequencies because of a rather broad free-electron contribution). Such frequency-independent behavior of is similar to what has been predicted Ando2002 and observed Mak2008 in graphene and matches the theory for the optical response due to transitions between the 2D Dirac states in LNSMs Carbotte2017 ; Ahn2017 ; Mukherjee2017 . In contrast to graphene, in LNSMs no universal sheet conductance is expected and is related instead to the length of the nodal line in a BZ. For a circular nodal line, one has:
| (1) |
It is assumed here that the plane of the nodal circle is perpendicular to the electric-field component of the probing radiation and that there is no particle-hole asymmetry Carbotte2017 ; Ahn2017 ; Mukherjee2017 . In ZrSiS, the low-energy nodal line is not circular and not even flat; instead the BZ contains a 3D “cage” of nodal lines Schoop2016 . Thus, a straightforward application of this formula is not rigourously validated. Nevertheless, having no better model at hand, we use Eq. (1) for a rough estimate of Å-1. This value seems to be reasonable: according to the band-structure calculations, the total lengths of the nodal line projections on the [100] and [001] directions are about 3.5 and 6 Å-1 per BZ, respectively.
At cm-1, is not frequency-independent anymore; it decreases with frequency. This is likely because the 2D Dirac band looses its linearity at such large energies Schoop2016 . At even higher frequencies, starts to rise as increases. It would be of interest to detect the transitions between the high-energy Dirac bands above approximately 1.3 eV = 10 500 cm-1, but we do not see any clear signatures of such transitions: as discussed above, these Dirac bands are partly gapped by SOC and for bands of such complex shapes the optical conductivity is not expected to be flat or linear in frequency. Additionally, non-Dirac bands above the Fermi level also contribute to the absorption processes at these frequencies, as one can see from the band structure calculations of Refs. Schoop2016 ; CChen2017 .
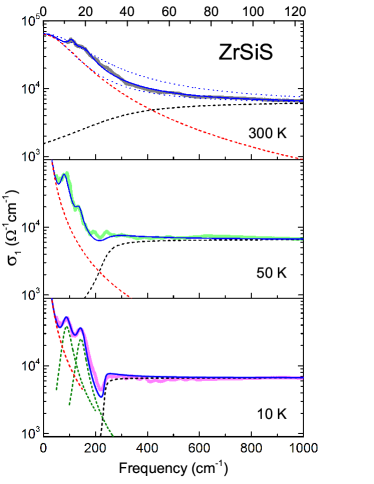
At the lowest frequencies measured, cm-1, also deviates from the flat behavior, as can be seen in Figs. 2 and 3, and exhibit several features. The contribution of free carriers (so-called Drude response) is present at all temperatures, but best seen at 100 and 300 K. A free-electron component is expected in the optical response because the Fermi level in ZrSiS is slightly above the nodal line Schoop2016 ; CChen2017 . As the temperature drops, the Drude band narrows, revealing two distinct modes at around 100 and 150 cm-1, which may be explained by some sort of electron localization; an elaborate discussion of the modes is outside the scope of this paper. The narrowing of the Drude band reflects the strong suppression of the dc resistivity Singha2016 ; Ali2016 and of the carrier scattering rate (or, more accurately, the momentum-relaxation rate) as .
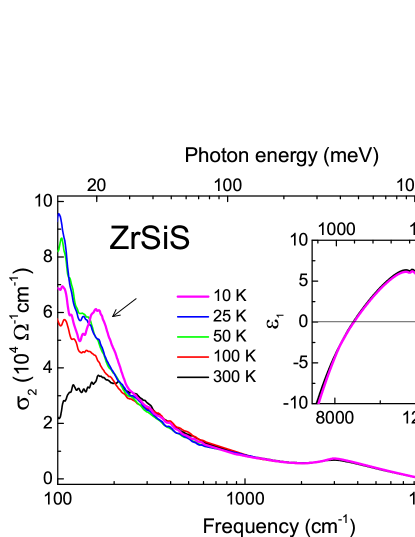
At the lowest temperatures, develops a minimum around 200 cm-1 (bottom panel of Fig. 3). We relate this dip and the corresponding feature in , see Fig. 4, to the Pauli blocking of the transitions in the 2D band. Such features, related to the position of the Fermi level, are well known in semiconductors Yu2010 and have recently been discussed in relation to graphene and Dirac/Weyl semimetals Gusynin2007 ; Kotov2016 ; Jenkins2016 . As already mentioned, band-structure calculations and ARPES measurements locate the Fermi level in ZrSiS in the upper (conduction) Dirac band Schoop2016 ; CChen2017 , see the sketch in Fig. 1. Thus, the Pauli edge must be seen in the interband portion of optical conductivity. An onset of the interband transitions commonly shows up at the frequency equal to Ahn2017 ; Mukherjee2017 ; Neubauer2016 ; Gusynin2007 ; Kotov2016 ; Jenkins2016 , with being the band gap and the position of the Fermi level relative to the Dirac point. Thus, Eq. (1) can be modified to:
| (2) |
where is the Heaviside step function. From Eq. (2) and the bottom panel of Fig. 3, one can conclude that must be smaller than approximately 250 cm-1 or some 30 meV and, hence meV.
This estimate of the upper limit of from optical data is in good agreement with the value obtained from band-structure calculations (15 meV, Schoop2016 ). The ARPES value of 60 meV CChen2017 likely overestimates the gap due to relatively low ARPES resolution. The fact that the relative position of the Dirac points and the Fermi level is slightly k-dependent Schoop2016 ; CChen2017 might lead to a broadening of the optical Pauli-edge feature observed. Importantly, even if the Fermi level appears within the gap for some values of k, our conclusion on the upper limit of still holds.
To get some more quantitative estimates of the parameters determining the optical response, we fit the optical conductivity with a model consisting of a Drude term, two Lorentzians, and a term describing the Pauli edge. Scattering and other processes, leading to broadening of the sharp step in Eq. (2), may be taken into account by replacing the Heaviside function with
| (3) |
for example, where represents a broadening parameter due to k-dependent gap, impurity scattering, or temperature. At K, reasonable fits can be obtained with a very sharp Pauli edge, i.e. with of a few cm-1. We set for all temperatures, since smaller values seem not to be physical. This yields , 35, and 210 cm-1 for 10, 50, and 300 K, respectively, see Fig. 3.
In all our fits we keep the zero-frequency limit of the Drude term equal to at all temperatures. Owed to the broad Drude tail, the description of the 300-K data is straightforward. It provides the momentum-relaxation rate of free carriers, cm-1 ( is the corresponding relaxation time), and a plasma frequency, cm-1 Lorentzian . On the other hand, the screened plasma frequency, ( is the contribution of the higher-frequency optical transitions to ), can be directly determined from optical measurements as the zero-crossing point of Dressel2002 . We find to be temperature independent and situated at 8900 cm-1, cf. the inset of Fig. 4. Hence, , which is in good agrement with the optical measurements, presented in same figure.
As one can see from Figs. 2 – 4, the Drude term becomes narrower as . At low temperatures, is below our measurement window and our fits thus might become ambiguous. To avoid this, we first tried to keep the plasma frequency of the Drude term constant as a function of ; but this turned out to be unsatisfactory. Some spectral weight had to be redistributed between the Drude term and the Lorentzians. Nevertheless, we tried to have this spectral weight transfer as small as possible and the total plasma frequency of the three terms (Drude plus two Lorentzians) to be temperature-independent in accordance with the temperature-independent . Examples of the fits obtained in this way are shown in Fig.3. At K, we found that to 2.5 cm-1 and the momentum-relaxing is 2.1 to 2.7 ps.
Interestingly, at low temperatures the momentum-relaxation length, , obtained from our estimate of , becomes macroscopically large. Using m/s as an average Fermi velocity in the low-energy Dirac bands Singha2016 , we obtain m for K. This implies that the hydrodynamic behavior of electrons, reported recently in clean samples of graphene Bandurin2016 ; Crossno2016 and the Weyl semimetal WP2 Gooth2017 , might also be realized in ZrSiS. This proposition seems reasonable, because only linear bands with highly mobile carriers (typical mobilities are to cm2/Vs Singha2016 ; Sankar2017 ; Hu2017 ) cross the Fermi level in ZrSiS.
Summarizing, the real part of the optical conductivity of ZrSiS was found to be independent of frequency in a rather broad range from 250 to 2500 cm-1 (30 – 300 meV). Our observations are supported by recent theoretical predictions for the optical response of LNSMs, and constitute and independent confirmation of 2D Dirac bands in ZrSiS near the Fermi level. The characteristic features of the Pauli edge, appearing in the low-frequency spectra, provide the upper limit (250 cm-1, 30 meV) for the gap between the 2D Dirac bands. The momentum-relaxation length is at the micrometer scale at K. Overall, our optical measurements reveal that ZrSiS is a gapped line-node semimetal with the electronic properties determined primarily by 2D Dirac electrons with rather slow momentum relaxation at low temperatures.
We thank Jules P. Carbotte, David Neubauer, and Raquel Queiroz for fruitful discussions and Gabriele Untereiner and Ievgen Voloshenko for technical support. This work was funded by the Deutsche Forschungsgesellschaft (DFG) via grant No. DR228/51-1. L. M. S. was supported by Minerva fast track scholarship from Max Planck Society.
References
- (1) A. A. Burkov, M. D. Hook, and L. Balents, Phys. Rev. B 84, 235126 (2011).
- (2) Y. Kim, B. J. Wieder, C. L. Kane, and A. M. Rappe, Phys. Rev. Lett. 115, 036806 (2015).
- (3) S. T. Ramamurthy and T. L. Hughes, Phys. Rev. B 95, 075138 (2017).
- (4) C. Fang, Y. Chen, H.-Y. Kee, and L. Fu, Phys. Rev. B 92, 081201 (2015).
- (5) G. Bian et al., Nat. Commun. 7, 10556 (2016).
- (6) Y. Wu et al., Nat. Phys. 12, 667 (2016).
- (7) R. Yu, H. Weng, Z. Fang, X. Dai, and X. Hu, Phys. Rev. Lett. 115, 036807 (2015).
- (8) Y. Chen, Y.-M. Lu, and H.-Y. Kee, Nat. Commun. 6, 6593 (2015).
- (9) Y. Okamoto, T. Inohara, A. Yamakage, Y. Yamakawa, and K. Takenaka, J. Phys. Soc. Jpn. 85, 123701 (2016).
- (10) L. S. Xie, L. M. Schoop, E. M. Seibel, Q. D. Gibson, W. Xie, R. J. Cava, APL Mater. 3, 083602 (2015).
- (11) Q. Xu, Z. Song, S. Nie, H. Weng, Z. Fang, and X. Dai, Phys. Rev. B 92, 205310 (2015).
- (12) L. M. Schoop et al., Nat. Commun. 7, 11696 (2016).
- (13) M. Neupane et al., Phys. Rev. B 93, 201104 (2016).
- (14) A. Topp, J. M. Lippmann, A. Varykhalov, V. Duppel, B. V. Lotsch, C. R. Ast, L. M. Schoop, New J. Phys. 18, 125014 (2016).
- (15) C. Chen et al., Phys. Rev. B 95, 125126 (2017).
- (16) W. Chen, H.-Z. Lu, and J.-M. Hou, Phys. Rev. B 96, 041102 (2017).
- (17) Z. Yan, R. Bi, H. Shen, L. Lu, S.-C. Zhang, and Z. Wang, Phys. Rev. B 96, 041103 (2017).
- (18) M. Ezawa, Phys. Rev. B 96, 041202 (2017).
- (19) D. Takane, Z. Wang, S. Souma, K. Nakayama, C. X. Trang, T. Sato, T. Takahashi, and Y. Ando, Phys. Rev. B 94, 121108 (2016).
- (20) J. Hu et al., Phys. Rev. Lett. 117, 016602 (2016).
- (21) M. M. Hosen et al., arXiv:1707.05292 (2017).
- (22) X. Wang et al., Adv. Electron. Mater. 2, 1600228 (2016).
- (23) R. Singha, A. Pariari, B. Satpati, P. Mandal, Proc. Natl. Acad. Sci. U.S.A. 114, 2468 (2017).
- (24) R. Sankar, P. Ganesan, I. P. Muthuselvam, C. Butler, N. Rao, K. Dimitri, M. Neupane, M.-T. Lin, and F. C. Chou, Sci. Rep. 7, 40603 (2017).
- (25) M. N. Ali, L. M. Schoop, C. Garg, J. M. Lippmann, E. Lara, B. Lotsch, and S. Parkin, Sci. Adv. 2, e1601742 (2016).
- (26) S. Pezzini, M. R. van Delft, L. M. Schoop, B. Lotsch, A. Carrington, M. I. Katsnelson, N. E. Hussey, S. Wiedmann, arXiv:1701.09119 (2017).
- (27) M. Matusiak, J. R. Cooper, and D. Kaczorowski, Nat. Commun. 8, 15219 (2017).
- (28) J. Hu, Z. Tang, J. Liu, Y. Zhu, J. Wei, and Z. Mao, Phys. Rev. B 96, 045127 (2017).
- (29) A. C. Neto, F. Guinea, N. Peres, K. S. Novoselov, and A. K. Geim, Rev. Mod. Phys. 81, 109 (2009).
- (30) M. Z. Hasan and C. L. Kane, Rev. Mod. Phys. 82, 3045 (2010).
- (31) T. O. Wehling, A. M. Black-Schaffer, and A. V.Balatsky, Adv. Phys. 63, 1 (2014).
- (32) O. Vafek and A. Vishwanath, Annu. Rev. Condens. 5, 83 (2014).
- (33) N. P. Armitage, E. J. Mele, and A. Vishwanath, arXiv:1705.01111 (2017).
- (34) P. Hosur, S. A. Parameswaran, and A. Vishwanath, Phys. Rev. Lett. 108, 046602 (2012).
- (35) Á. Bácsi and A. Virosztek, Phys. Rev. B 87, 125425 (2013).
- (36) A. B. Kuzmenko, E. van Heumen, F. Carbone, D. van der Marel, Phys. Rev. Lett. 100, 117401 (2008).
- (37) K. F. Mak, M. Y. Sfeir, Y. Wu, C. H. Lui, J. A. Misewich, and T. F. Heinz, Phys. Rev. Lett. 101, 196405 (2008).
- (38) R. Y. Chen, S. J. Zhang, J. A. Schneeloch, C. Zhang, Q. Li, G. D. Gu, and N. L. Wang, Phys. Rev. B 92, 075107 (2015).
- (39) D. Neubauer, J. P. Carbotte, A. A. Nateprov, A. Löhle, M. Dressel, and A. V. Pronin, Phys. Rev. B 93, 121202 (2016).
- (40) B. Xu et al., Phys. Rev. B 93, 121110 (2016).
- (41) J. P. Carbotte, J. Phys. Condens. Matter 29, 045301 (2017).
- (42) S. P. Mukherjee and J. P. Carbotte, Phys. Rev. B 95, 214203 (2017).
- (43) S. Ahn, E. J. Mele, and H. Min, arXiv:1703.00130 (2017).
- (44) M. Dressel and G. Grüner, George, Electrodynamics of Solids (Cambridge University Press, Cambridge, 2002).
- (45) D. B. Tanner, Phys. Rev. B 91, 035123 (2015).
- (46) M. B. Schilling, A. Löhle, D. Neubauer, C. Shekhar, C. Felser, M. Dressel, and A. V. Pronin, Phys. Rev. B 95, 155201 (2017).
- (47) T. Ando, Y. Zheng, and H. Suzuura, J. Phys. Soc. Japan 71, 1318 (2002).
- (48) P. Y. Yu and M. Cardona, Fundamentals of Semiconductors: Physics and Materials Properties (Springer, Berlin, 2010).
- (49) V. P. Gusynin, S. G. Sharapov, and J. P. Carbotte, Int. J. Mod. Phys. B 21, 4611 (2007).
- (50) O. V. Kotov and Yu. E. Lozovik, Phys. Rev. B 93, 235417 (2016).
- (51) G. S. Jenkins et al., Phys. Rev. B 94, 085121 (2016).
- (52) Note, even at K, the Lorentzians in our model improve the fit, see Fig. 3(a).
- (53) D. A. Bandurin et al., Science 351, 1055 (2016).
- (54) J. Crossno et al., Science 351, 1058 (2016).
- (55) J. Gooth, F. Menges, C. Shekhar, V. Süß, N. Kumar, Y. Sun, U. Drechsler, R. Zierold, C. Felser, and B. Gotsmann, arXiv:1706.05925 (2017).