Mapping the Curricular Structure and Contents of Network Science Courses
Abstract
As network science has matured as an established field of research, there are already a number of courses on this topic developed and offered at various higher education institutions, often at postgraduate levels. In those courses, instructors adopted different approaches with different focus areas and curricular designs. We collected information about 30 existing network science courses from various online sources, and analyzed the contents of their syllabi or course schedules. The topics and their curricular sequences were extracted from the course syllabi/schedules and represented as a directed weighted graph, which we call the topic network. Community detection in the topic network revealed seven topic clusters, which matched reasonably with the concept list previously generated by students and educators through the Network Literacy initiative. The minimum spanning tree of the topic network revealed typical flows of curricular contents, starting with examples of networks, moving onto random networks and small-world networks, then branching off to various subtopics from there. These results illustrate the current state of consensus formation (including variations and disagreements) among the network science community on what should be taught about networks and how, which may also be informative for K–12 education and informal education.
1 Introduction
Network science has grown at a rapid pace over the last few decades, producing several major international conferences, scientific journals, research communities, and even academic degree programs barabasi2016network . As it has matured as an established field of research, there are already a number of courses on this topic developed and offered at various higher education institutions, often at postgraduate levels. Those courses are delivered in several different departments/disciplines with their respective emphases, such as mathematics, computer science, physics, sociology, political science, management science, systems science, biology, medicine, and in other more interdisciplinary settings as well.
In those recently developed network science courses, instructors adopted different approaches with different focus areas and curricular designs, depending on their backgrounds, knowledge, and objectives. It should be of particular interest to the network science community to investigate what are agreed or disagreed upon among those instructors on the choices of topics and the curricular flows that go through those topics in a sequential instruction. To the best of our knowledge, there is no prior literature on such a systematic analysis of network science course contents.
The study presented in this chapter aims to collect and organize the information about a number of existing network science courses, generate “maps” of their curricular structures, and identify a set of commonly used curricular contents and typical flows of instruction that connect those contents. Information about course contents were extracted from the online syllabi or schedules of the network science courses and were modeled as a directed weighted graph, to which several network analysis methods were applied to reveal underlying curricular structure. Potential directions of further improvement of network science curriculum design are also discussed based on the results.
2 Data Collection
We gathered information about existing network science courses from online sources, using the following two websites as the main starting points:
-
•
Complexity Explorer
https://www.complexityexplorer.org/ -
•
Awesome Network Analysis
https://github.com/briatte/awesome-network-analysis
From these websites we collected the syllabi or course schedules of several dozens of English-based courses that included topics related to networks. As our objective was to analyze the curricular structure of “network science” as an interdisciplinary field of research, we excluded the following types of courses from our analysis:
-
1.
Purely mathematical graph theory courses
-
2.
Statistics courses that included network analysis only briefly
-
3.
Courses on narrowly defined applications (e.g., political analysis, genomic analysis)
-
4.
Special topics/seminar courses
As a result, we selected the 30 courses shown in Table 1 as the data sources for our study.
- 1.
- 2.
- 3.
- 4.
- 5.
- 6.
- 7.
- 8.
- 9.
- 10.
- 11.
- 12.
- 13.
- 14.
- 15.
- 16.
- 17.
- 18.
- 19.
- 20.
- 21.
- 22.
- 23.
- 24.
- 25.
- 26.
- 27.
- 28.
- 29.
- 30.
Data collection was conducted manually by the author in April–May 2016. Network science-related topics were extracted from each of the data sources and were grouped by instructional modules shown in the syllabi/schedule. All of the extracted topics were converted to lowercase letters without diacritics to facilitate text processing. The topics were also often normalized/edited/reworded/aggregated at the discretion of the author, to make the vocabulary consistent throughout the analysis. The cleaned final data set (including the rewording rules used in this study) is available from figshare figshare .
3 Methods of Analysis
The topics and their curricular sequences extracted from the course syllabi/schedules were initially represented as a directed multigraph by the following procedure (also see Fig. 1):
-
1.
Connect topics that appear in the same curricular module to each other with bidirectional edges, to form a fully connected cluster of topics.
-
2.
Connect topics covered in the previous module to those covered in the subsequent module with directed edges, to represent curricular flows.
These steps were repeated for all curricular modules in all of the courses. After this edge construction process was over, multiple edges that shared the same origin-destination pair were replaced by a single directed weighted edge with the multiplicity of the original edges as the weight. The result was obtained as a single large directed weighted graph, which we call the topic network hereafter. This topic network was analyzed using several different methods.

First, the distribution of instructional attention/emphasis in the current network science courses was characterized by measuring the absolute frequencies of appearance of topics in the original data set. We did not use degree or other centrality measures in the topic network for this purpose, because, according to the procedure of network construction used in this study (Fig. 1), each topic’s in- and out-degrees are greatly influenced by the numbers of other topics in previous and next curricular modules, respectively.
Next, all of the edges whose weight was two or below were removed from the topic network and only the largest strongly connected component was kept for the rest of the analysis, in order to improve the robustness of the findings by focusing on the essential main body of the topic network. Communities of topics were detected by applying the modularity maximization method blondel2008fast ; fortunato2016community to the topic network. Finally, the edge weights were inverted from the original ones so they would represent distance (not strength) of connections, and then the minimum spanning tree (i.e., a tree that reaches all of the nodes with the minimal sum of edge weights) graham1985history of this weight-inverted topic network was computed to reveal typical flows of instruction going through various network science topics.
For all of these analyses and visualizations, we used Wolfram Research Mathematica 11.1.1.
4 Results
Figure 2 shows the top 20 topics that appeared most frequently in the collected course syllabi/schedules. The topic “small-world networks” appeared most frequently in our analysis, probably because this topic was covered widely in various disciplines, including math/physics/computer science, social/economic/political sciences, psychology/neuroscience, and some others. “Random networks”, “centrality”, and other well-known topics are also represented in this list. A larger set of topics is visualized as a word cloud in Fig. 3.
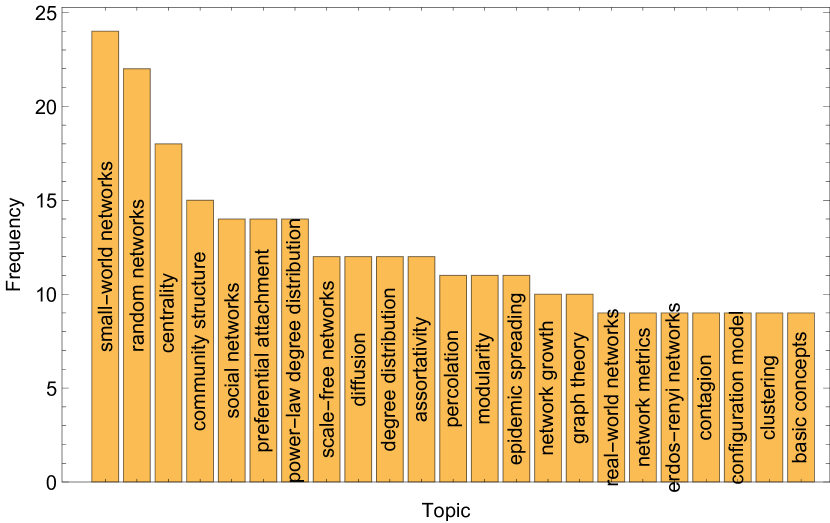
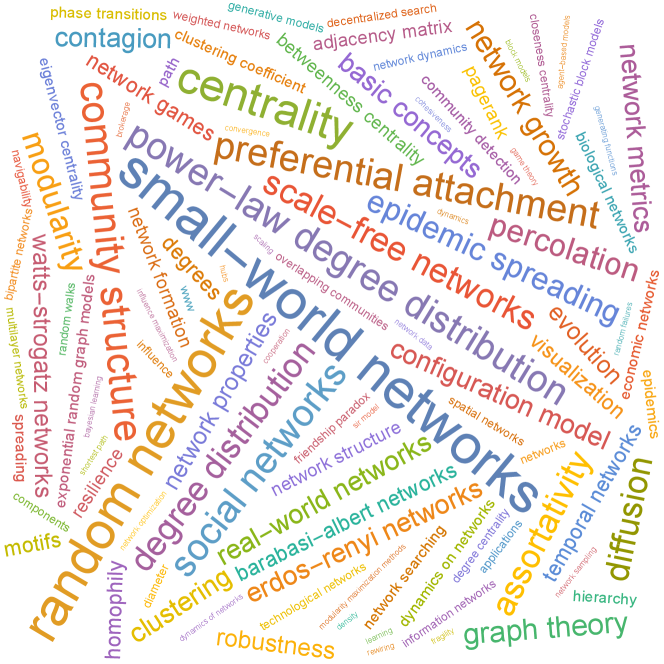
Figure 4 shows a visualization of the filtered topic network after edge weight thresholding and extraction of the largest strongly connected component. High-resolution versions of this and other visualizations are available from figshare figshare . While the original topic network included 505 topics, the filtered one included 121. The latter was more focused on essential, frequently covered topics than the original, and thus we used the filtered one for the rest of the analysis.
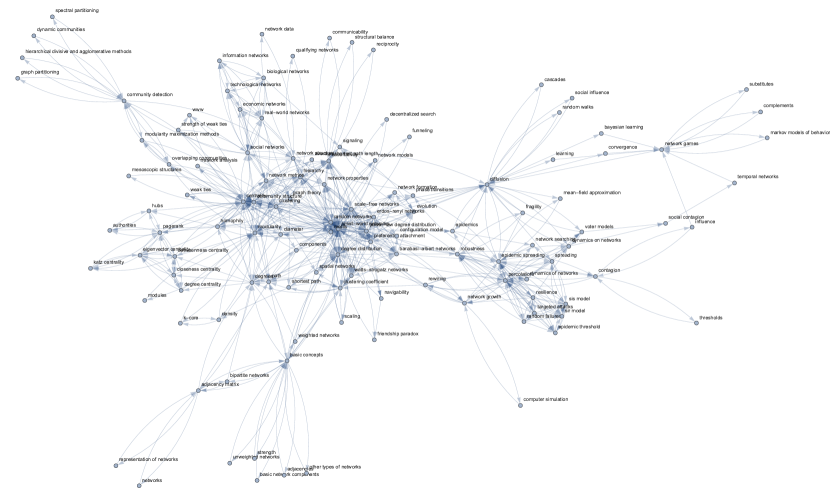
Figure 5 shows the communities of topics detected by applying the modularity maximization method to the filtered topic network. Seven topic clusters were detected. Although characterizing each cluster with an appropriate label was a challenging task, we reviewed the content of each cluster and came up with the following characterization of the seven clusters:
-
1.
Examples of networks (middle-right). This cluster includes concrete examples of networks, such as social networks, economic networks, biological networks, technological networks, and information networks.
-
2.
Network representation (bottom-right). This cluster includes fundamental concepts and terminologies about representation of networks, such as basic network components, adjacencies, path, degree, strength, etc.
-
3.
Random networks (bottom-center). This cluster is the most dense and the most difficult to label. It includes a wide variety of topics, and many of them had strong connections to other communities. However, it uniquely includes several major random network models (e.g., Erdős–Rényi networks, small-world networks, Barabási–Albert networks, preferential attachment, etc.). Therefore we tentatively call this cluster “random networks”. It is clearly the core part of this topic community map.
-
4.
Network structure (top-center). This cluster includes concepts about network structure and tools to analyze it, such as clustering, path length, modularity, community detection, k-core, etc.
-
5.
Centralities (top-right). This relatively small cluster has a clear focus on centrality measures.
-
6.
Network dynamics (top-left). This cluster includes various dynamical concepts that are typically discussed in dynamical systems, stochastic/probabilistic systems, and statistical physics, such as spreading/contagion, influence, and dynamics on/of networks.
-
7.
Others (bottom-left). This small cluster includes miscellaneous topics that do not appear to have a common theme (e.g., learning, network games, temporal networks).
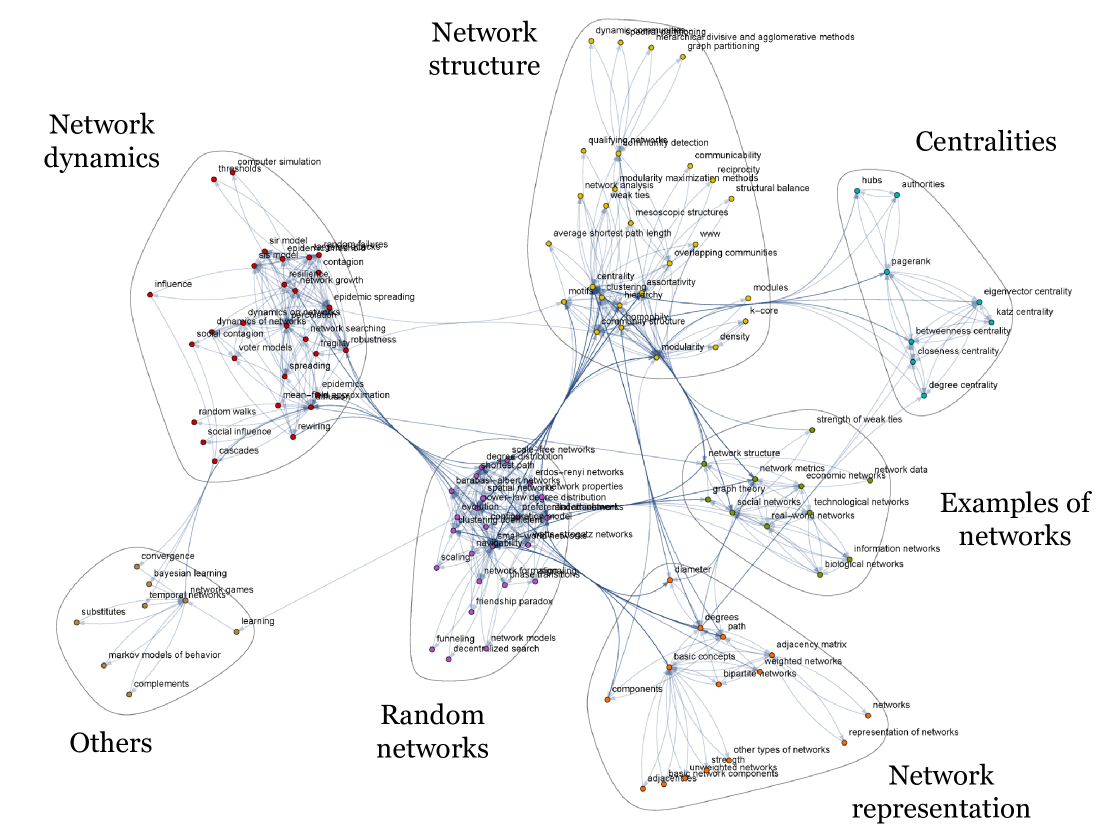
The cluster of random networks occupies a central position in this map, to which most other clusters are attached with varying degrees of connection strength. The connections are particularly strong between random networks and network structure, as well as between random networks and network dynamics, indicating their strong linkages in the core curricula of network science courses.
We compared the topic clusters identified above with the essential concepts generated by students and educators through the Network Literacy initiative networkliteracy ; sayama2016essential (Table 2). They matched reasonably regarding examples of networks, network representation, network structure/centralities, and network dynamics. In the meantime, the cluster of random networks does not have a counterpart in the essential concepts list, probably because the topics covered in this cluster are somewhat at advanced levels and may not be suitable for secondary education or general public. On the other hand, the essential concepts about visualization and computer technology (4 and 5 in the second column of Table 2) were not well represented in the topic communities seen in Fig. 5. This finding coincides with the fact that those two essential concepts were suggested and emphasized by NetSci High cramer2015netsci students, not by network science researchers, when the Network Literacy booklet was developed sayama2016essential . This may indicate that the current curricular structure of network science courses are likely not spending sufficient time or resource to cover computational tools and visualization methods, even though they could be essential for students’ learning of networks. A potential factor contributing to this gap may be that many of the courses analyzed here are at advanced graduate levels, where computational methods and visualization tools may not be part of the core curricular content.
| Topic cluster detected | Essential concept given in Network Literacy | Matched? |
|---|---|---|
| 1. Examples of networks | 1. Networks are everywhere. | Yes |
| 2. Network representation | 2. Networks describe how things connect and interact. | Yes |
| 3. Random networks | (missing) | No |
| 4. Network structure | 3. Networks can help reveal patterns. | Yes |
| 5. Centralities | (covered in 3) | Yes |
| (missing) | 4. Visualizations can help provide an understanding of networks. | No |
| (missing) | 5. Today’s computer technology allows you to study real-world networks. | No |
| (covered in 1?) | 6. Networks help you to compare a wide variety of systems. | Yes? |
| 6. Network dynamics | 7. The structure of a network can influence its state and vice versa. | Yes |
| 7. Others | (covered in 7?) | Yes? |
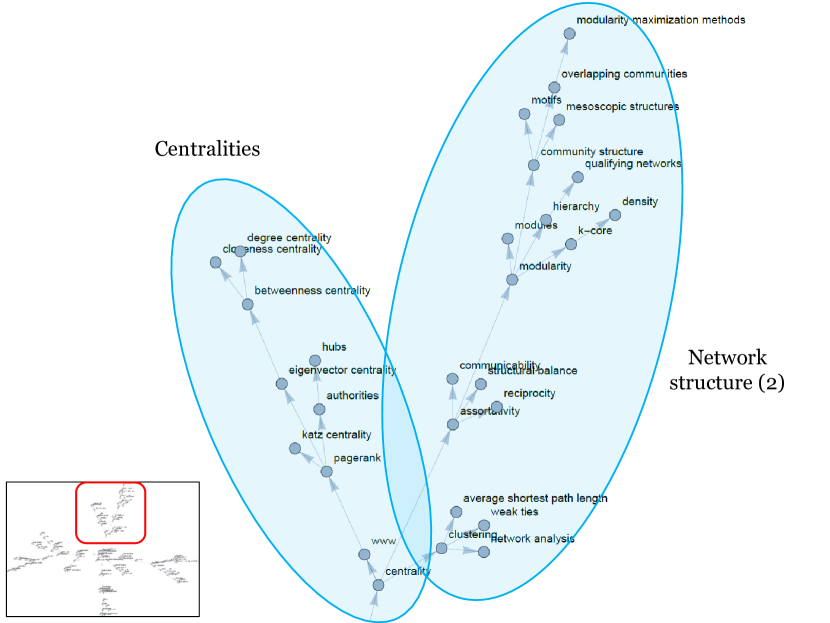
Finally, Figure 6 presents the minimum spanning tree of the topic network with inverted edge weights. This map shows the curricular structure of network science courses in greater detail with sequential relationships, revealing a possible “backbone” of curricular flows among various network science concepts. The root of the tree is located near the right side of the map, starting with social networks. From there, several curricular flows can be identified on this map. Details are explained below with enlarged portions of the map, which turn out to bear a good correspondence with the topic clusters detected in Fig. 5.
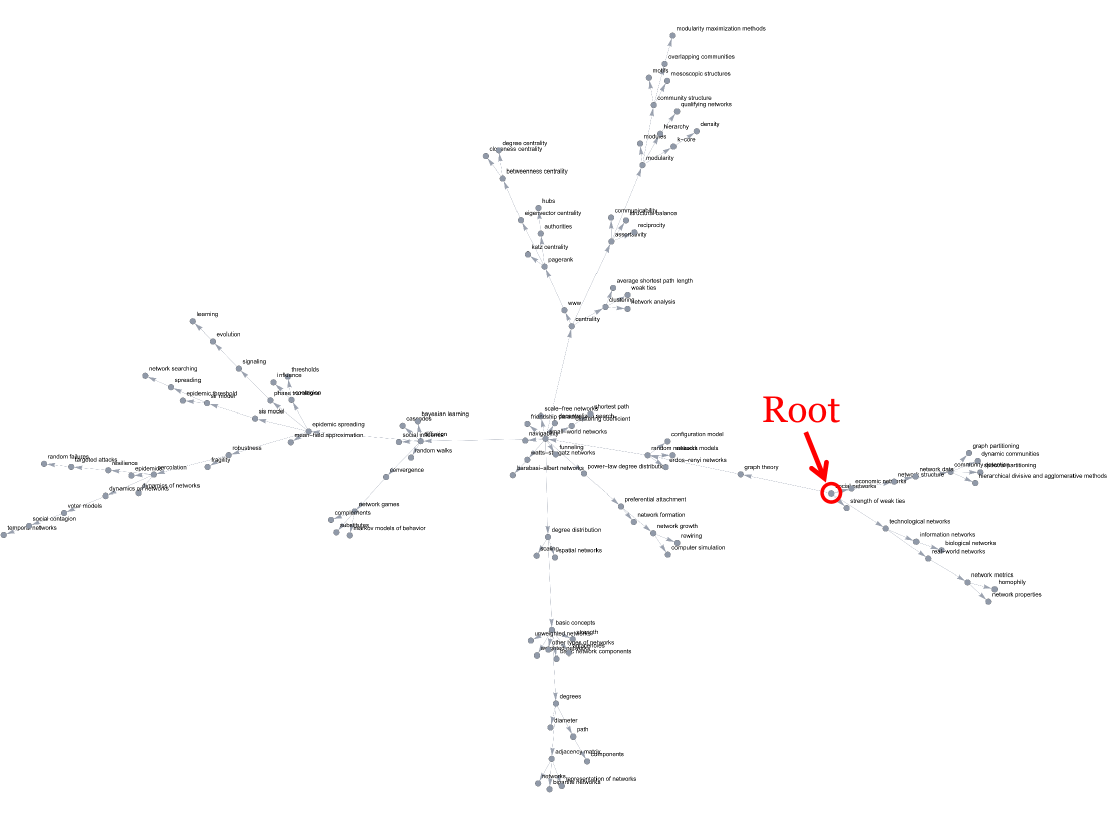
Figure 7 shows the right portion of Fig. 6, in which the root of the spanning tree, social networks, is located in the middle. Two branches are shown in this figure, in addition to another path going from the root leftward. The first branch (lower one) includes topics such as technological networks, information networks, biological networks, and real-world networks, which clearly correspond to the topic cluster of examples of networks. The other branch (upper one) includes network data, community detection, partitioning, and other related topics, which could be summarized as network structure, together with a few other topics that show up at the tip of the first branch. This area of the tree appears to be an introductory part of the curricular structure.
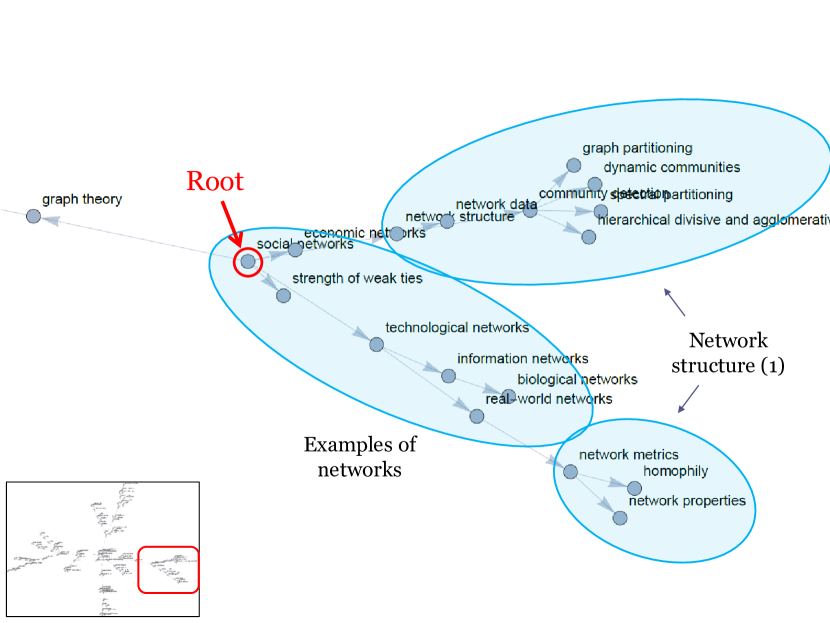
Figure 8 shows the central portion of Fig. 6, which is the busiest area in the spanning tree where a number of new concepts and models are introduced. The curricular flow that originated in the root comes from the right, and first goes through random networks, where purely random network models such as Erdős–Rényi models and configuration models are introduced. Then it reaches small-world networks that serves as the crux of the whole spanning tree. The observed importance of the small-world networks in the curricular flow agrees with its highest frequency seen in Fig. 2. From there, several different flows branch off toward various subtopics, most notably scale-free networks & network growth that goes down to the right. Other topics shown in this figure are diffusion & influence and network games to the left.
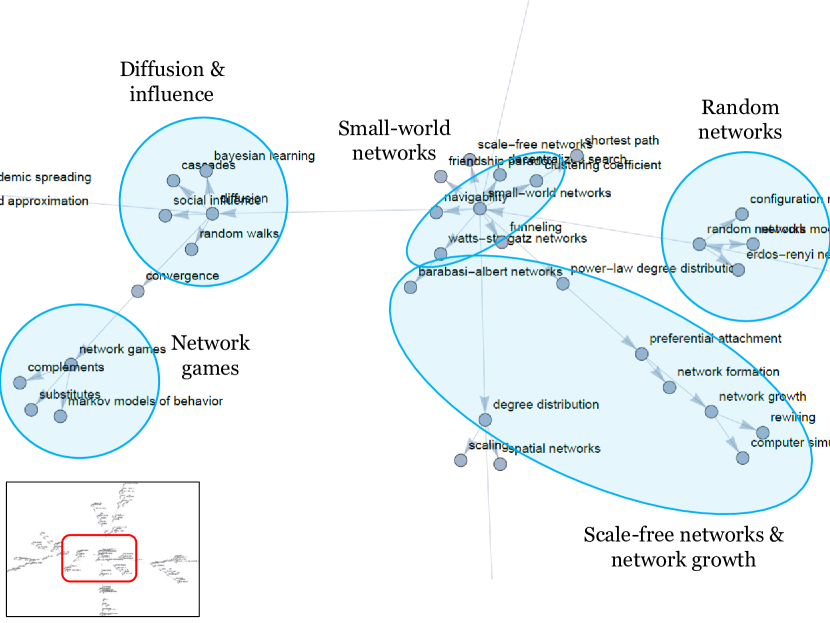
Figure 9 shows the bottom portion of Fig. 6 that can be summarized as a single branch about network representation, where fundamental concepts and terminologies about representation of networks are covered, such as degrees, strengths, adjacencies, unweighted/weighted networks, path, diameter, and bipartite networks.
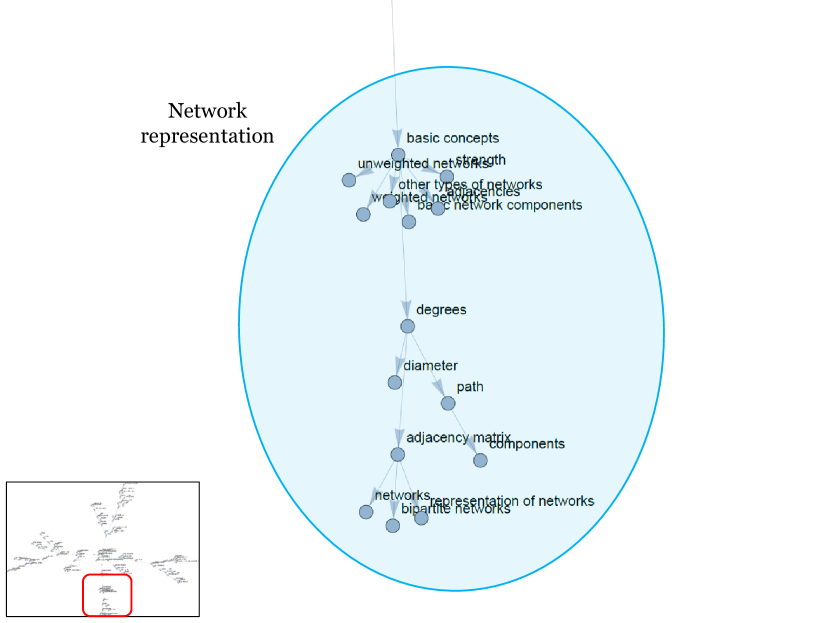
Figure 10 shows the top portion of Fig. 6, which includes a branch for centralities and another branch for network structure. Together with the bottom branch shown in Fig. 9, these three branches cover various topics about theories and methods of structural analysis of networks.
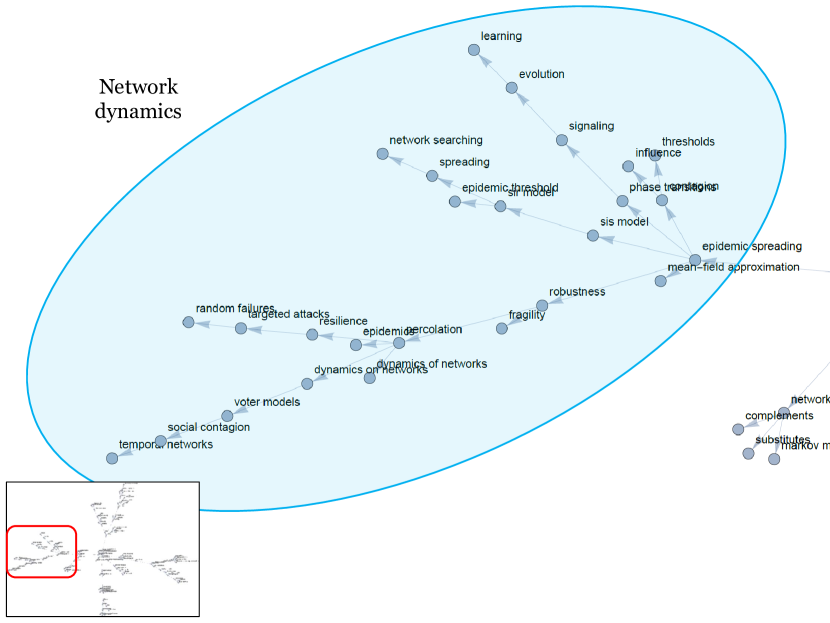
Finally, Figure 11 shows the left portion of Fig. 6, which can be considered a large branch of network dynamics. Extending from diffusion & influence in Fig. 8, this branch covers topics such as epidemic spreading, phase transitions, robustness, percolation, and dynamics on/of networks. It is apparent that this area is predominantly oriented to dynamical systems, stochastic/probabilistic systems, and statistical physics, where many advanced concepts, theoretical models, and analytical methods are discussed.
Overall, the examination of the spanning tree illustrated the following steps as a potential curricular flow of network science courses:
-
1.
Start with examples of networks (e.g., social networks), with some basics of network structure.
-
2.
Introduce random networks and small-world networks.
-
3.
From there, take any of the following subtopic paths depending on the objective and need of the course:
-
(a)
Scale-free networks and network growth
-
(b)
Network representation
-
(c)
Centralities
-
(d)
Other topics on network structure
-
(e)
Network dynamics
-
(a)
Needless to say, this presents nothing more than just one example of a number of possible instruction designs in teaching network science. Many of the courses included in the dataset of this study adopted a curricular flow substantially different from the one shown above (for example, see porter2017course ). The curricular flow of a specific course should be carefully custom-designed according to the objective and scope of the course, the academic level and background of students, time/resource constraints, and many other variables.
5 Conclusions
In this study, we constructed and analyzed networked maps of topics covered in 30 existing network science courses. The communities identified in the topic network revealed seven major topic clusters: examples of networks, network representation, random networks, network structure, centralities, network dynamics, and others. These detected clusters showed a reasonable level of agreement with the essential concepts identified in the Network Literacy initiative, although the importance of visualization and computer technology was not well represented in the current network science courses. This presents a potential room for instructional redesign; increasing the time and resource allocated for visualization and computer technology may improve students’ learning of networks.
We also computed the minimum spanning tree of the topic network to elucidate instructional flows of curricular contents. This analysis revealed a more fine-grained, directed structure of the topic network, in which a typical flow of instruction starts with examples of networks, moves onto random networks and small-world networks, and then branches off to various subtopics from there. This directed topic map will be useful for instructors to navigate through various network science topics and design their own curricula when teaching network science. We hope that the results presented in this chapter offers the first step to illustrate the current state of consensus formation (including variations and disagreements) in the network science community, on what should be taught about networks and how. They may also be informative for K–12 education and informal education as well, when educators and students explore network science topics to choose relevant teaching/learning materials for their needs.
It should be noted that our results depend on the specific choices we made about data sources and data cleaning/analysis methods, which were not fully validated in an objective manner. Conducting a similar analysis using different sources and methods may thus produce significantly different maps of curricular contents. Moreover, as the educational effort of network science has been growing rapidly sayama2017netscied , new courses are continuously created and offered with new topics, instructional designs, and methodologies each year. We suggest that the network science community should continue modeling and analyzing the curricular structure of network science courses in the coming decades, to develop, assess and adjust effective teaching strategies and methods for this quickly evolving field of interdisciplinary research.
Acknowledgments
The author thanks Mason Porter for reviewing the earlier version of this chapter and providing many valuable comments and suggestions, which have significantly helped improve the content.
References
- (1) Barabási, A.L.: Network Science. Cambridge University Press (2016). Available online at http://networksciencebook.com/
- (2) Blondel, V.D., Guillaume, J.L., Lambiotte, R., Lefebvre, E.: Fast unfolding of communities in large networks. Journal of Statistical Mechanics: Theory and Experiment 2008(10), P10,008 (2008)
- (3) Cramer, C., Sheetz, L., Sayama, H., Trunfio, P., Stanley, H.E., Uzzo, S.: NetSci High: Bringing network science research to high schools. In: Complex Networks VI, pp. 209–218. Springer (2015)
- (4) Fortunato, S., Hric, D.: Community detection in networks: A user guide. Physics Reports 659, 1–44 (2016)
- (5) Graham, R.L., Hell, P.: On the history of the minimum spanning tree problem. Annals of the History of Computing 7(1), 43–57 (1985)
- (6) NetSciEd: Network Literacy: Essential Concepts and Core Ideas. http://tinyurl.com/networkliteracy (2015). [Online; accessed July-30-2017]
- (7) Porter, M.A.: An undergraduate mathematics course on networks. In: C. Cramer, H. Sayama, L. Sheetz, S. Uzzo, M. Porter (eds.) Network Science in Education – Tools and Techniques for Transforming Teaching and Learning. Springer (2017). In press; available online at https://www.math.ucla.edu/~mason/papers/net_course04-clean.pdf
- (8) Sayama, H.: “Mapping the curricular structure and contents of network science courses”: Dataset and high resolution figures. https://doi.org/10.6084/m9.figshare.5500843.v1 (2017). figshare [Online; accessed October-14-2017]
- (9) Sayama, H., Cramer, C., Porter, M.A., Sheetz, L., Uzzo, S.: What are essential concepts about networks? Journal of Complex Networks 4(3), 457–474 (2016)
- (10) Sayama, H., Cramer, C., Sheetz, L., Uzzo, S.: NetSciEd: Network science and education for the interconnected world. Complicity: An International of Complexity and Education 14(2), 104–115 (2017). Available online at https://journals.library.ualberta.ca/complicity/index.php/complicity/article/view/29339