The 12C(n, 2n)11C cross section from threshold to 26.5 MeV
Abstract
The 12C(n, 2n)11C cross section was measured from just below threshold to 26.5 MeV using the Pelletron accelerator at Ohio University. Monoenergetic neutrons, produced via the 3H(d,n)4He reaction, were allowed to strike targets of polyethylene and graphite. Activation of both targets was measured by counting positron annihilations resulting from the decay of 11C. Annihilation gamma rays were detected, both in coincidence and singly, using back-to-back NaI detectors. The incident neutron flux was determined indirectly via 1H(n,p) protons elastically scattered from the polyethylene target. Previous measurements fall into upper and lower bands; the results of the present measurement are consistent with the upper band.
pacs:
25.40.-hI Introduction
The 12C(n, 2n)11C reaction may be a useful and robust neutron diagnostic for measuring the areal density of a deuterium-tritium (DT) implosion, which is an important parameter in determining the implosion compression of an inertial confinement fusion (ICF) burn. Not only is the reaction sensitive to , but because the reaction is only sensitive to neutrons above 20 MeV, it is immune to primary neutrons (14.1 MeV) and down-scattered neutrons. To use this method, ultra-pure graphite disks placed within the ICF reaction chamber become activated by tertiary neutrons via the 12C(n, 2n)11C reaction. The 511 keV gamma rays emitted by the 11C disk during positron annihilation are subsequently counted in an area far away from the target chamber and used to obtain the tertiary neutron yield. The diagnostic is well suited for the harsh EMP environment produced during an ICF implosion and high gamma and x-ray background Welch et al. (1988); Glebov et al. (2003). Furthermore, the 11C half-life is sufficiently long compared to the graphite extraction time which is on the order of a few minutes. This allows for the counting process to begin soon after the ICF shot prior to radioactive cooling of the graphite. It is important to note that the tertiary yield cannot be determined without a good knowledge of the 12C(n, 2n)11C reaction cross sections in this energy range. Hence the importance of these new cross section measurements.
A measurement of the 12C(n, 2n)11C reaction in this energy range is also important for calculations of the rate of cosmogenic 11C production, since the uncertainty in this cross section represents the largest source of systematic error in these calculations. In turn, the presence of cosmogenic 11C in deep underground mines limits the detectability of pep and CNO solar neutrinos in several neutrino experiments Galbiati et al. (2005).
Figure 1 shows the previous measurements in the energy range between threshold (at MeV Audi et al. (2012)) and 35 MeV, as well as predicted cross sections from Dimbylow Dimbylow (1980), which are from a nuclear optical model calculation using fits to experimentally measured total, elastic and inelastic cross sections. The cross sections tend to follow two separate bands which differ by as much as a factor of two across the neutron energy range of interest. The upper band comprises measurements from Anders et al. Anders et al. (1981) and Welch et al. Welch et al. (1981) and calculations of Dimbylow Dimbylow (1980), while the lower band is the measurements from Brolley et al. Brolley Jr et al. (1952), Brill et al. Brill et al. (1961), Soewarsono et al Soewarsono et al. (1992), and Uno et al. Uno et al. (1996).
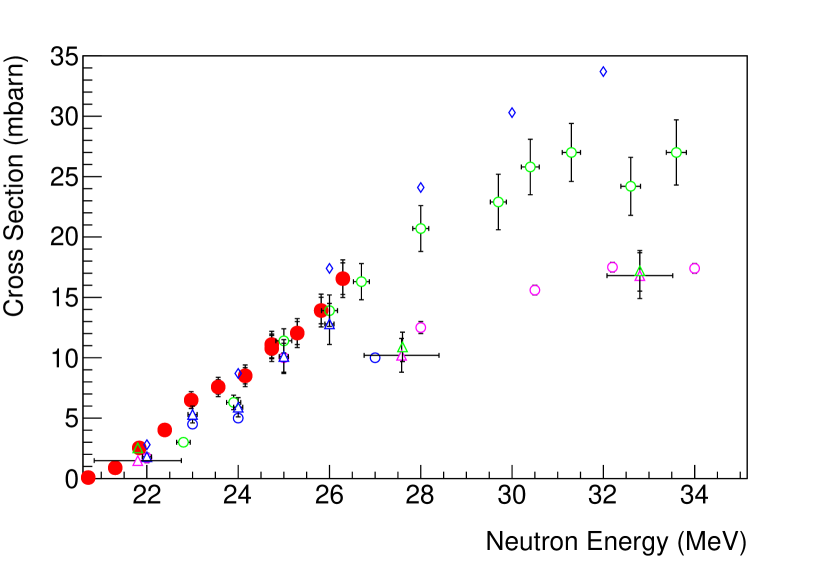
It is difficult to see what might be causing the results for these experiments to fall into two distinct bands. Table 1 summarizes the published essential features of each previous experiment. There does not seem to be any obvious division between the bands on the basis of technique, type of neutron source, type of target, method of neutron flux determination or type of activation measurement.
| Year | Experiment | Accelerator | Neutron Source | Target | Neutron Flux | Activation Measurement |
|---|---|---|---|---|---|---|
| 1952 | Brolley et al. Brolley Jr et al. (1952) | 10.5 MeV deuterons from cyclotron | 3H(d,n) gas cell, neutron energy selected by angle | Poly- ethylene foils | Calculated from 3H(d,n) cross section |
Geiger counter
calibrated with RaD+E |
| 1961 | Brill et al. Brill et al. (1961) | 20 MeV deuterons from cyclotron, Pt foil degrader | 3H(d,n) (Zr foil) and 2H(d,n) (gas) | Carbon | TOF energy/angle distribution |
Geiger counter
calibrated with 197Au |
| 1981 | Anders et al. Anders et al. (1981) | 7-16 MeV deuterons from cyclotron, Be foil degrader | 3H(d,n) (Ti foil) | Reactor graphite | Stilbene crystal recoil proton spect. | Annihilation - coincidence using NaI detectors |
| 1981 | Welch et al. Welch et al. (1981) | Tandem Van de Graaff | 3H(d,n) | Natural carbon | No information available. |
Ge(Li) Detector calibrated with
22Na |
|
1992
1996 |
Soewarsono et al. Soewarsono et al. (1992)
Uno et al. Uno et al. (1996) |
20-40 MeV protons from cyclotron | 7Li(p,n) quasi-monoenergetic | 7Li on graphite | From activation of Li target | HPGe detector, Li in/out subtraction |
Since it is not clear why the previous measurements disagree, the present experiment was designed to reduce or eliminate possible sources of systematic uncertainty that may have affected previous results. In the present experiment, monoenergetic neutrons produced using the 3H(d,n)4He reaction were allowed to strike carbon-containing targets of polyethylene and graphite. When these neutrons induced the 12C(n, 2n)11C reaction, 11C nuclei were produced, which later decayed via emission with a half-life of minutes Kelley et al. (2012). After an activation period, the targets were removed to counting stations, where both the singles and coincidence rates of 511 keV gamma rays resulting from positron annihilation were used to determine the number of 11C nuclei present. In order to determine the neutron flux, protons from neutron-proton elastic scattering were simultaneously counted in a E-E detector telescope.
The present experiment has a number of advantages:
-
1.
The electrostatic accelerator provides an extremely stable and nearly mono energetic deuteron beam, which, when used with a very thin titanium tritide target gives intrinsic neutron energy spread of less than about 0.2 MeV in the 20 to 30 MeV neutron range.
-
2.
By using a recoil proton telescope with E-E silicon detectors, the present experiment has ability to identify and select only 1H(n,p) elastic recoil protons of the correct energy. Since the solid angle is well defined and the intrinsic efficiency is nearly 100% for the silicon detectors, an absolute determination of the neutron flux is possible using well measured np elastic scattering cross sections.
-
3.
Two targets, graphite and the polyethylene proton production target, irradiated and counted simultaneously, allow a consistency check. Moreover, since the polyethylene activation target is also the proton production target for the telescope, problems that would result from the neutron flux being measured in a different place than the activation target are eliminated.
-
4.
Counting the activated targets by placing them between the circular faces of two cylindrical matched NaI crystals gives maximum solid angle and therefore maximum absolute efficiency for counting the relatively small number of 11C decays, thereby reducing counting uncertainty and the effect of unwanted background. Requiring a coincidence rather than using a single detector eliminates most background 511 keV gamma ray events that do not come from 11C decay.
-
5.
A careful study was made of the absolute full-peak efficiency of the counting system. A Monte Carlo code was developed to calculate this efficiency for both singles and coincidence mode geometries, the results of which were validated by comparisons to a number of ancillary experiments. This allowed a consistency check to be made by simultaneously measuring the cross sections using both the coincidence and singles count rates.
II Description of the Experiment
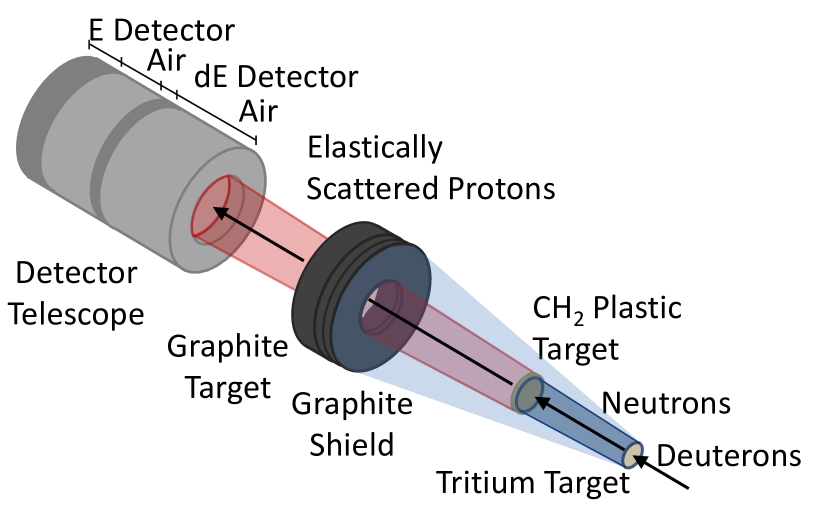
The cross sections were measured for energies between about 19.7 and 26.4 MeV using the 4.5 MV Tandem Pelletron electrostatic accelerator at Ohio University. As shown in Fig. 2, deuterons were accelerated to energies between 3.1 and 9.1 MeV and allowed to strike a 472.86 GBq tritium target that was perpendicular to the beam and located at the end of the beam pipe just upstream of an aluminum end window. Analyzing magnet image slits restricted the spread in deuteron beam energy to about 5 keV. Deuteron beam currents were typically between 0.8 and 1.0 A. The tritium was deposited as titanium tritide on a 49 mm diameter 1 mm thick OFHC copper substrate at a density of about 2000 g/cm2 over a circular active area of 30 mm diameter. The end window where the target was mounted was cooled by a stream of air. The target assembly was attached to the beamline with a bellows so that the target could be rotated in a circular path in a plane perpendicular the beam direction. The radius of rotation was approximately 1 cm and the period of rotation was about 0.3 s which spread the beam heating and target sputtering over a larger area on the target without compromising the geometry of the experiment. Before striking the target, the deuteron beam was defocused by a pair of quadrupole magnets located 275 and 315 cm upstream, and allowed to pass through a 1.27 cm diameter collimator 45 cm upstream of the target. This was to ensure that the beam spot on the target was relatively large, uniform, and in a known and reproducible location. These characteristics minimized local heating of the target and were also needed for simulations described below.
A 50 cm long steel optical bench with modified positioners was used to hold the detectors and targets in fixed positions at an angle of 0∘ with respect to the beamline. The targets were aligned to the optical center of the beam line using the procedure discussed below.
Neutrons leaving the tritium could strike a 1.64 mm thick, 2.54 cm diameter high-density polyethylene target with its upstream face located 7.0 cm from the tritium target and a 7.62 cm diameter 0.89 cm thick disk of high purity graphite with a 17.46 mm hole drilled in through its center with its upstream face 14.4 cm from the tritium target. In contact with the upstream face of the graphite target, a pair of graphite disks stopped any protons scattered from the polyethylene from reaching the graphite target. The total thickness of this graphite shield was 3.85 mm, with the other dimensions being the same as the graphite target disk. The mass densities of the polyethylene and graphite targets were measured to be and g/cm2 respectively.
A proton telescope consisting of a 300 m thick, 150 mm2 ion implanted silicon dE detector and a 5000 m thick, 200 mm2 drifted-lithium silicon E detector was placed behind the hole in the graphite target, so that protons coming from the polyethylene could be viewed. The entrance of the dE detector was covered by a 0.005 mm thick aluminum foil to keep out ambient light. The entire detector assembly was housed in an aluminum tube with wall thickness of about 2.9 mm and diameter of 3.47 cm. Preamplifiers and spectroscopy amplifiers located near the detectors in the experimental hall sent pulses to a FastComTech MPA-3 multiparameter system which digitized and recorded the pulse heights and timing. The system also recorded the deuteron beam current.
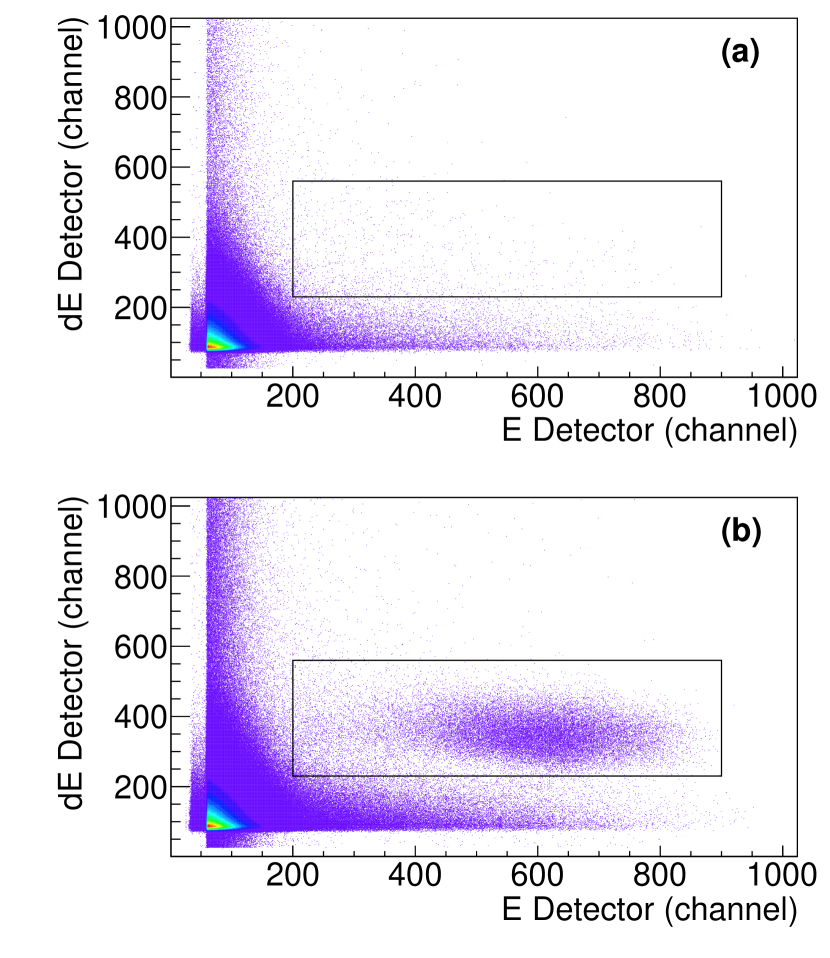
Fig. 3 shows 2D histograms of the pulse height in the dE detector versus the E detector. The 1H(n,p) protons elastically scattered from the polyethylene can be easily identified by their energy loss in the two detectors. At 26.4 MeV the background count rate was about 3% of the rate with the polyethylene target in place, which was approximately 3.5 protons/sec with a beam current of about 1 A. Over the course of the experiment, radiation damage caused the width of the proton peak in the E detector to gradually increase along with the leakage current.
A special circuit provided a separate count of the number of coincidence events, and gated the individual detector pulses that were input to analog-to-digital converters (ADCs) that were part of the FAST ComTec MPA-3 multiparameter system. The live time, which was typically about 98%, was confirmed by comparing the number of coincidence events recorded by the computer with the number counted by a separate hardware circuit.
A 12.7 cm diameter, 5.08 cm thick NE-213 liquid scintillator neutron monitor was located 300 cm from the tritium target at an angle of a 71.4∘ to beam left. In order to identify neutron pulses from gamma ray signals in the monitor, a pulse shape analysis was made using a Mesytec MPD4 pulse shape discriminator module. These signals were also recorded by the MPA-3 multiparameter system.
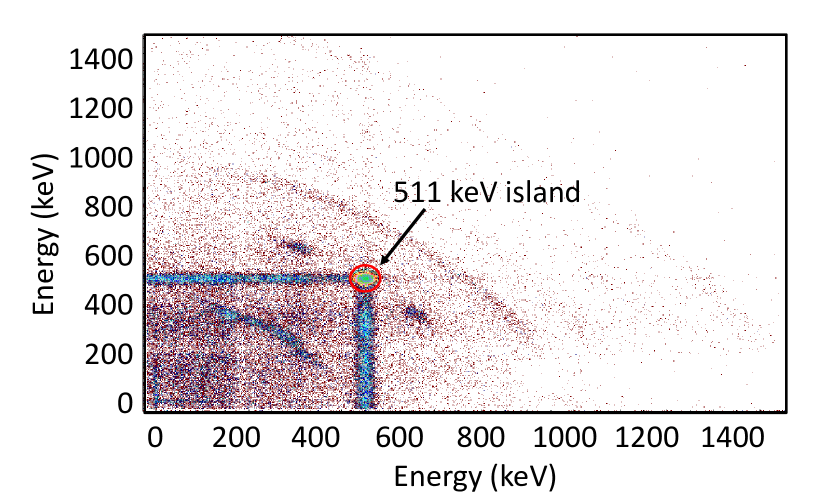
Activated targets were counted at three counting stations located in a room far from the accelerator target area to reduce background counts. After each was activated simultaneously, the graphite target disks, shields and polyethylene targets were placed between pairs of 7.62 cm diameter by 7.62 cm thick NaI detectors. Pairs of detectors and the graphite targets were held with their axes aligned inside almost equal diameter acrylic tubes. The polyethylene targets, which were much smaller in diameter, were affixed with adhesive tape to the center of one of the detectors, which was marked. Pulses from all of these detectors were digitized by a FAST ComTec MPA-4 system, which recorded the pulse heights and timing information. Coincidence events consisting of two back-to-back 0.511 keV gamma rays from positron annihilation were selected (as shown in Fig. 4) and counted as a function of time. This allowed the growth curve of 11B to be measured and fit in order to determine the number of 11C nuclei present. The gamma rays from the graphite shields were also counted in a separate station consisting of two high-purity germanium detectors to look for activation due to contaminants in the graphite.
III Procedure
The silicon detector telescope and targets were positioned at 0∘ to the beam line using a theodolite that had been previously aligned with the collimator in the beam pipe and monuments in the target room.
To ensure the polyethylene target holder was centered and the neutron distribution was axially symmetric, a duplicate target was cut in half and the proton count rate was measured to approximately 2% statistical uncertainty with the half target in each of four positions, top, bottom, left and right. The target position was changed by simply rotating it in the holder, and the ratio of protons to integrated charge on the tritium target, which should be constant for perfect axial symmetry, was found to vary by less than 10%. This small deviation from a uniform neutron distribution on the polythene target would only result in a small correction to the already small extended target correction described below.
For each energy setting, prior to activating the targets, a study was made of the beam defocussing and positioning of the beam along the axis of the beam pipe. This step is important because the distribution of the beam on the target must be input to the simulation of the experiment described below. Experimentally, it was observed that steering the beam off of the central axis of the collimator would change the number of protons per integrated charge on the tritium target and the ratio of protons to neutrons detected in the neutron monitor. In order to place the beam on the central axis of the quadrupoles, the steering of the beam was adjusted such that the ratio of detected protons to neutrons was minimally sensitive to the the quadupole current (less than a 5% change for a quadrupole current change of 25%). The deuteron beam was also monitored with a beam profiler upstream from the target. These procedures ensured that the beam was very closely aligned with the optical beam axis and centered on the target.
Following these quadrupole tests, a shield, graphite target and a polyethylene target were placed in the target holders to be activated for about 1.5 hours, during which time the proton telescope pulses were recorded. Three identical sets of targets were available to be used consecutively in order to allow enough time for any longer lived activated contaminants to decay between uses, although no contaminants were detected. When the deuteron beam was stopped, after sufficient time to allow the room radiation dose rate to fall to an acceptable level, the targets were hand-carried to the counting room and placed in the counting stations. The time between when irradiation stopped and when target counting commenced was typically 4-5 minutes. Each sample was then counted for approximately 2 hours, binned into 50 second intervals. The dead time for each time bin was recorded and used to correct the growth curve.
The background proton count rate was measured at each energy setting by removing the polyethylene target and counting for approximately 30 minutes. A separate graphite disk target and shield was used exclusively for this purpose.
IV Analysis
IV.1 Overview
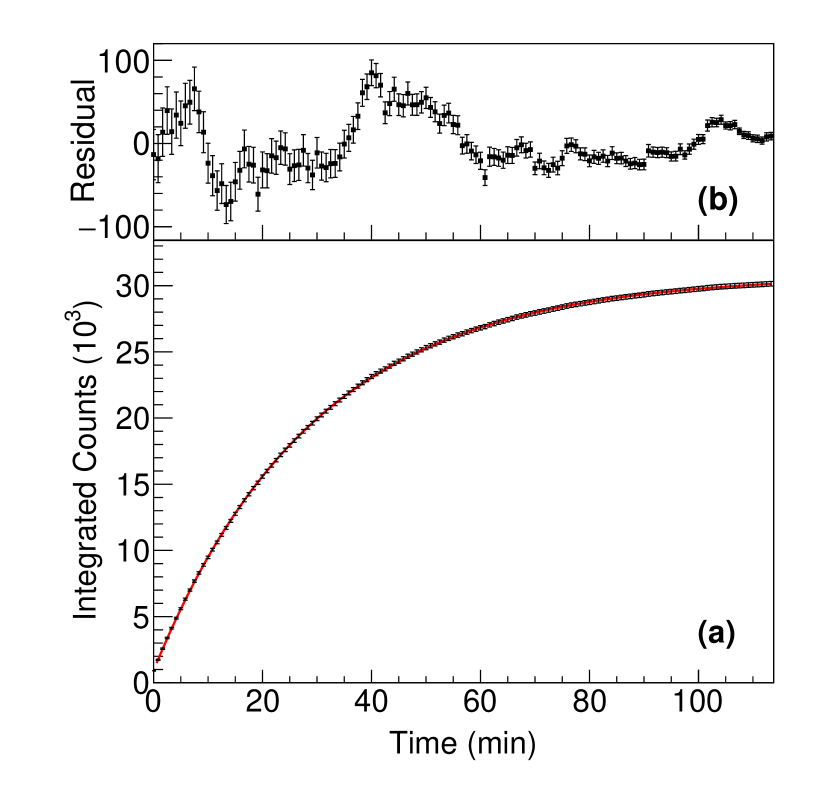
The 11C decays in the activated polyethylene and graphite targets were counted using pairs of NaI detectors “sandwiching” each target, capable of counting the 511 keV gamma rays from positron annihilation in both singles and coincidence modes simultaneously. This allowed the 11B growth curves from 11C Be to be measured for both singles and coincidence events, and fit with the exponential growth function
| (1) |
where is the sum of all the positron annihilation events counted up to time , is the total number of detectable 11C decays, min Kelley et al. (2012) is the decay constant for 11C and is the integral of the constant rate of background events. The number of counts that would be obtained if counting began immediately at the end of activation is
| (2) |
where is the time between the end of activation and the start of counting, in other words, the time required to transfer the samples to the counting station. The total number of 11C nuclei formed in the target is
| (3) |
where is either the absolute full-peak coincidence or singles efficiency, depending on how the growth curve was generated.
Cross sections for 12C(n,2n) were extracted using the above quantities as well as the background-subtracted rate of elastically scattered protons detected, , and the activation time, , since
| (4) |
where is the target thickness in terms of carbon nuclei (carbon nuclei/cm2). The quantity is the ratio of elastically scattered protons detected, , to the number of neutrons striking the polyethylene or graphite target, . This ratio was calculated numerically for the experiment geometry for each target using the known 3H(d,n)4He Drosg (2000) and 1H(n,p)n elastic scattering Stoks et al. (1993a, 1994) cross sections.
IV.2 Growth Curves
To determine , Eq. (1) was fit to the growth curves for the polyethylene and graphite targets using the c++ ROOT Brun and Rademakers (1997) TMinuit class implementation of the Minuit package James and Winkler (1998). Fits were made using singles events from each NaI detector individually and also for coincidence events, resulting in six semi-independent measurements of the cross section. For the polyethylene target, which is much thinner than the graphite, at the highest incident neutron energy setting about 7000 11C decays were counted over the 2 hour period.
Fig. 5 shows a typical fit of Eq. (1) to a coincidence growth curve. These growth curves were created by integrating the number of events in the 511 keV peak up to time , and plotting the integral as a function of . The exponential nature of the growth curve was clear for coincidence events, but because of the large number of background events relative to the number of 11C decays, the singles growth curves for the thin polyethylene targets were nearly a straight lines. Nevertheless, the value of could still be extracted from these fits and used to determine the cross section using Eq. (4) , albeit with a larger uncertainty.
IV.3 Determination of
In order to figure out the cross section for the 12C(n, 2n)11C reaction using Eq. (4), the incident neutron flux striking each target was determined from the number of protons using
| (5) |
where the quantity in parenthesis, , the ratio of the number of protons detected to neutrons striking the target was calculated purely from the experiment geometry.
To calculate the ratio for each target, several simplifying assumptions were made to which corrections were later applied. Assume that the tritium target is a point source of monoenergetic neutrons, isotropic in the lab frame, with flux (neutrons/sec/sr). In that case, the number of neutrons/sec () striking the polyethylene () and graphite () targets would be given by and where and are the solid angles of the plastic and graphite targets, respectively, if the effect of the finite thickness of the targets on solid angle is neglected. The number of protons/sec () detected by the proton telescope can be obtained if the polyethylene target is then treated as a point source for the purpose of scattering protons into the proton telescope. Assuming that the cross section for 1H(n,p) elastic scattering, , which depends on the scattering angle, , and the incident neutron energy, , is roughly constant over the angles subtended by the targets, and is equal to the cross section at at the nominal neutron energy, yields
| (6) |
where is the thickness (hydrogen nuclei/area) of the polyethylene target, and is the solid angle of the proton telescope. In this simple approximation, therefore, the calculated ratio of the rates for protons detected by the proton telescope to neutrons hitting the polyethylene target is
| (7) |
and for the graphite target
| (8) |
Clearly, the approximation that the tritium and polyethylene targets can be treated as point sources is incorrect, and a more correct solution must include the fact that the neutrons leaving the tritium target can have a range of angles and still reach the polyethylene and graphite targets, and that the energies and cross sections for these neutrons depends on the neutron angle. Moreover, the protons coming from the polyethylene, which is actually an extended source, can also have a range of angles and still strike the proton telescope, and the cross sections and energies of the protons reaching the telescope depends on the proton angle.
A number of corrections were applied to this simple calculation of the proton to neutron ratio. The first correction accounts for the fact that the targets were not point sources but actually extended targets. The 1H(n,p) elastic scattering and DT fusion cross sections both depend on the scattering angle, as do the energies of the scattered neutrons and protons. To account for these effects, the surface of each target and the silicon detector were divided into infinitesimally small area elements, each of which was then treated as a point source. The total number of protons or neutrons hitting a target or detector was determined by integrating over the surface area of each target, as depicted in Fig. 6.
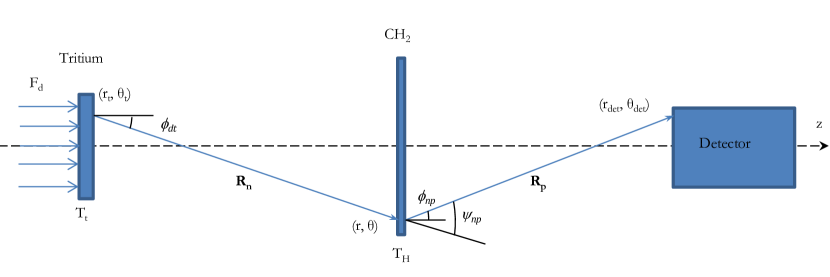
The rate of neutrons hitting the polyethylene target is
| (9) | |||||
where is the radius of the beam spot on the tritium target (0.635 cm), is the radius of the polyethylene target, the incident deuteron energy is , the deuteron flux (deuterons/area/time) is , the thickness of the tritium target (3H nuclei per unit area) is , and the surface area of the tritium target is . The cross section for DT fusion at the neutron angle for incident deuteron energy is where .
The number of neutrons impacting the graphite target () was calculated using the same formula by integrating over the surface area of the graphite target rather than the polyethylene target, remembering to include the central hole.
The rate of protons striking the proton telescope due to 1H(n,p) elastic scattering of DT neutrons from protons in the plastic target is given by
| (10) | |||||
where is the radius of the proton detector, is the DT neutron energy, which depends on the deuteron energy and DT neutron angle , and is the np scattering angle, given by .
The hole through the center of the graphite target was slightly too small for all of the protons to pass through unobstructed, thereby causing a collimating effect. To correct this, if in the integral any proton path intersected the graphite disk it was excluded from the integral. This changed by less than 0.5%.
A c++ program was written to evaluate these integrals numerically using the rectangle method. Each integral was divided into 150 steps, the number of steps chosen based on the rate of convergence to give around 1% uncertainty in the proton-to-neutron ratio. The scattering angles for the DT fusion and 1H(n,p) elastic scattering reactions for each neutron and proton path were determined for each step. No neutron scattered at an angle of greater than around was able to hit the graphite target. No proton scattered at an angle greater than around could hit the detector. Since these extreme angles were very unlikely, most paths had cross sections fairly close to the approximation.
The cross section measurement was insensitive to the Ti:T ratio and the overall tritium activity of the tritium target, since the neutron flux was measured directly using the proton telescope. However, the neutrons striking the graphite and polyethylene targets are slightly reduced in energy and have a broadened energy distribution as a result of the deuterons losing energy prior to interacting with the tritium, and the resulting neutrons leaving at angles greater than . The thickness of the tritium target was also divided into 150 steps, and for each step in thickness and angle the energy of the neutrons striking the targets was calculated. The calculated neutron spectra were used to correct the nominal neutron energies. To do this, for neutron energies above about 21.5 MeV, where the 12C(n, 2n)11C cross sections are large enough to allow, a quadratic polynomial was fit to the measured 12C(n, 2n)11C cross sections as a function of uncorrected nominal neutron energy. This was used with the calculated neutron energy spectrum to predict the expected 11C distribution in each target. Then the total 11C in the target and the preliminary cross section fit were used to determine the corrected neutron energy – that is, if all the neutrons had this energy, they would give the same number of 11C nuclei as the actual neutron distribution. This process resulted in a maximum downward shift in neutron energy of less than 1.3% (0.28 MeV) which occurred for 5.57 MeV deuterons. The FWHM of the energy neutron energy distribution striking the targets was typically about 0.3 MeV. For deuteron energies below 21.5 MeV, where the 12C(n, 2n)11C cross section is essentially zero, the average was used to estimate the corrected neutron energy.
The proton energy variation with angle for protons entering the proton telescope is wider, but still only 5 MeV for 26 MeV protons, which allowed the protons to be easily identified in the E-E telescope.
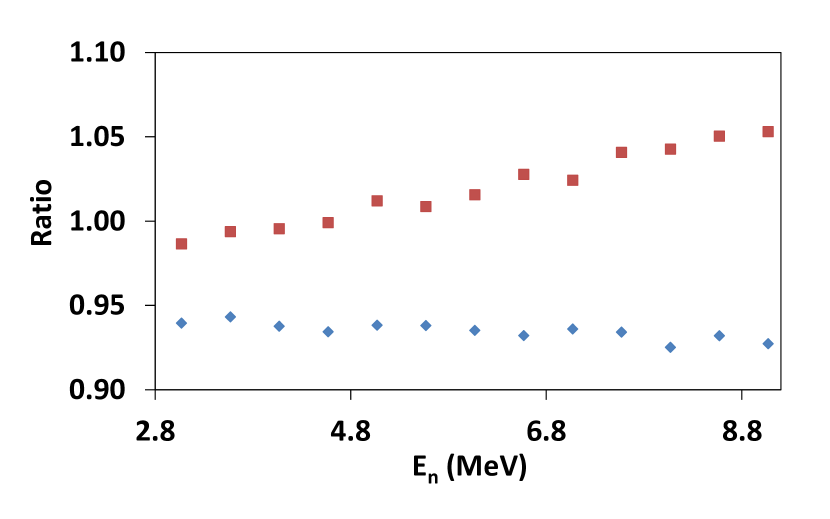
Fig. 7 shows how the corrected ratio , computed using Eq. (10) and Eq. (9), compares to the approximate value determined using Eq. (7) and (8). The net effect of all these corrections was always less than about 7%.
IV.4 Absolute Full-peak Efficiencies for Singles and Coincidence
Because the activated targets were sandwiched between the NaI detectors in order to maximize the count rate, the efficiency was very sensitive to geometry. A Monte Carlo simulation was created using the Geant4 toolkit Agostinelli et al. (2003); Allison et al. (2006) to model both the graphite and polyethylene target geometries, including other decay modes, surrounding materials, and Compton scattering. In order to validate this code, it was used to predict efficiencies for other geometries which were then tested experimentally. These experiments will be described in more detail in a later paper.
In the first set of tests, an associated particle technique was used to allow the absolute singles and coincidence full-peak efficiencies to be determined using an uncalibrated 22Na positron source. In this technique the positrons were stopped in a plastic scintillator, signaling that a pair of 511 keV gamma rays were released. The fraction of plastic scintillator events for which the NaI detector also detected a 511 keV gamma ray in coincidence is the absolute efficiency. A third detector was used to correct for summing with the 1.274 MeV gamma rays from the 22Na. The geometry of the plastic scintillator and 22Na source were simulated, and compared with predicted singles and coincidence absolute full-peak efficiencies as a function of source-to-detector distance and radial source position on the face of the detector. The code predictions agreed with the measurements to within approximately 4.7% RMS percent difference for coincidence, and 8.6% for singles.
The second set of tests used an approximately 3.7 kBq NIST calibrated 68Ge source, with activity measured to ±1.7%. For the initial test, the source was sandwiched between two copper disks to stop the positrons, nearly simulating a point source. Again the geometry was simulated and predicted singles and coincidence absolute full-peak efficiencies were compared with measurements as a function of source-to-detector distance and radial source position on the face of the detector, agreeing to about 5.3% RMS percent difference for coincidence, and 6.6% for singles.
Finally, the 68Ge source was placed between graphite disks of the same diameter and approximate thickness as in the experiment, and the full-peak efficiencies were measured as a function of radial source position. In this experiment, which is the closest to the actual measurement geometry, the predicted efficiencies agreed with the measurement to 6.5% RMS percent difference for coincidence, and 1.4% for singles.
The GEANT simulation code was used to study the effect of misaligning at axes of the targets and NaI detectors. In the worst case, which was for coincidence measurements using the graphite target, an offset of 1 mm of the target resulted a 3.1% change in the full-peak efficiency.
Based on these results, a systematic uncertainty of 5.5% was assigned for the predicted absolute full-peak efficiencies for the targets used in this experiment, which are listed in Table 2.
| Target | Configuration | Efficiency |
|---|---|---|
| Graphite | Coincidence | 0.0494 0.0027 |
| Detector 1 | 0.0981 0.0054 | |
| Detector 2 | 0.1049 0.0058 | |
| Polyethylene | Coincidence | 0.1568 0.0078 |
| Detector 1 | 0.1655 0.0091 | |
| Detector 2 | 0.1656 0.0091 |
Given the large size of the graphite target used in this experiment, the Monte Carlo simulation code MCNP5 Team (2003) was used to reproduce the distribution of 11C nuclei in the graphite disk. In this simulation, monoenergetic neutrons were emitted uniformly and isotropically from a circular region on the flat tritium target, with a radius equal to that of the last upstream collimator on the deuteron beam. The interactions of these neutrons with the graphite disk were simulated using the standard 6000.60c cross section library, and resulting number of 11C nuclei were mesh tallied as a function of position within the graphite. The simulation showed, relatively independently of the neutron energy, that the number of 11C was reduced to about 75% at the downstream face relative to the upstream face of the graphite, and smoothly fell by approximately 5% from the center to the edge. Simulating this 11C distribution in the Geant4 code slightly increased the singles absolute full-peak efficiency for the detector with more 11C near it and reduced the other side; for coincidences the efficiency was increased by nearly 6%.
IV.5 Measurement Uncertainty
The uncertainty in the cross section from Eq. (4) was calculated using the normal propagation of uncertainty rules to get
| (11) | |||||
where the uncertainty in the activation time is so small it has been neglected. The range of uncertainty values for each term in Eq. (11) is shown in Table 3, and the results are included in the uncertainties given in Table 4 and Figs. 1 and 8. The estimates for statistical uncertainty in the number of 11C decays result from the error matrix calculated by TMinuit in fitting Eq. (3). The range of values in Table 3 result from the large change in the number of 11C produced in each target, since the 12C(n, 2n)11C cross section rises rapidly near threshold. The uncertainty in the number of neutrons, determined from , depends on the statistical uncertainty in the number of protons detected (about 1.1%), the uncertainty in the 1H(n,p)n elastic scattering cross section Stoks et al. (1993a, b) (about 0.7%), the uncertainty in , the polyethylene 1H number density (about 3.5%), and the solid angle uncertainties for the polyethylene and graphite targets, and the proton telescope (about 2.8%, 1.4%, and 2.9% respectively). The effect of misaligning the axes of the polyethelene and graphite targets was simulated and found to result in approximately an additional 4.1% uncertainty in the number of neutrons striking the graphite target. Since the neutrons striking the polyethylene target determines the number of protons, this systematic effect does not affect the polyethylene uncertainty. The uncertainties in the 12C and 1H areal number densities ( and respectively) for each of the targets was estimated based on careful measurements of the target dimensions and mass.
The uncertainty in the corrected incident neutron energy was assumed due to the uncertainty in the thickness of the tritium target, which was about . The neutron energy uncertainty was propagated into the 12C(n, 2n)11C cross section uncertainty using the slope of a polynomial fit to the nominal 12C(n, 2n)11C cross sections as a function of energy. The resulting cross section uncertainties, which ranged from 0.31 mb to 0.85 mb, were added in quadrature to the other uncertainties described above.
| Percent | |
| Source | Uncertainty |
| Uncertainty in | |
| Graphite target | |
| 11C decays counted in coincidence | 0.3-0.9% |
| 11C decays counted in NaI1 detector | 0.2-1.0% |
| 11C decays counted in NaI2 detector | 0.2-1.0% |
| Polyethylene target | |
| 11C decays counted in coincidence | 0.7-2.3% |
| 11C decays counted in NaI1 detector | 1.0-9.5% |
| 11C decays counted in NaI2 detector | 1.0-5.5% |
| Uncertainty in NaI detector efficiency | 5.5% |
| Uncertainty in 12C areal number density | |
| Graphite target | 1.9% |
| Polyethylene target | 3.8% |
| Uncertainty in incident neutrons | |
| Graphite target | 6.9% |
| Polyethylene target | 4.6% |
| Uncertainty in | 0.6% |
V Discussion of Experimental Results
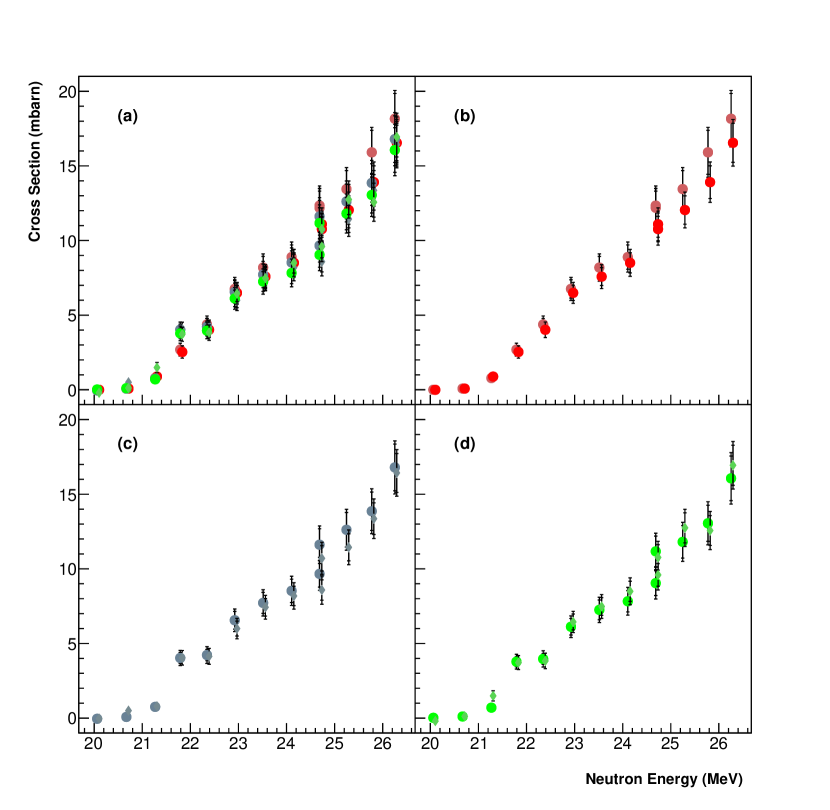
The total 12C(n,2n)11C cross sections obtained from the graphite and polyethylene targets, for coincidence and singles counting, are displayed in Table 4. The agreement between cross sections determined using different targets, geometries, efficiencies and detectors is quite good; the overall RMS percent difference from the mean for energies above 22 MeV, where there are enough statistics to be meaningful, is 6.2%. The best individual measurement is expected to be the coincidence measurement using the polyethylene target, since the background rate is reduced for the coincidence measurement, allowing a more robust fit to the growth curve, and since the same target is used for 1H(n,p) elastic scattering, eliminating systematic uncertainties in determining the neutron flux.
Fig. 8 plots the cross sections measured in this experiment for different combinations of targets and detectors. Fig. 8a shows the overall agreement between all of the measurements made at each neutron energy. The agreement is good, but with the graphite coincidence measurement being systematically high. Figs. 8b, c and d compare just the polyethylene and graphite cross sections for coincidence and singles measurements using each detector. Comparing measurements with different targets made using the same detector(s) shows agreement within experimental uncertainty, which is a fairly stringent test since the geometry and target material is not the same, supporting the calculated detector efficiency and geometry correction. The measurement at 24.7 MeV was repeated, the first measurement made near the middle of the experiment and the second at the end. In this case, the coincidence measurements at the middle and end of the experiment agree when comparing graphite to graphite and polyethylene to polyethylene, but the graphite result is higher than the polyethylene for both measurements, slightly outside of the error bars.
It is clear from Fig. 1 that the cross sections from the present experiment fall along high side of the upper curve previously set by the measurements of Anders et al. Anders et al. (1981) and Welch et al. Welch et al. (1981) and calculations of Dimbylow Dimbylow (1980). The predictions of Dimbylow Dimbylow (1980) are within our error bars, as are, for the most part, the measurements from Anders et al Anders et al. (1981) and Welch et al. Welch et al. (1981).
| Deuteron | Graphite | Polyethylene | ||||||
|---|---|---|---|---|---|---|---|---|
| Energy | Energy | Coincidence | Detector 1 | Detector 2 | Energy | Coincidence | Detector 1 | Detector 2 |
| (MeV) | (MeV) | (mb) | (mb) | (mb) | (MeV) | (mb) | (mb) | (mb) |
| 3.57 | 20.06 | 0.00 0.00 | -0.05 0.01 | 0.02 0.01 | 20.10 | 0.00 0.01 | -0.03 0.13 | -0.20 0.01 |
| 4.07 | 20.67 | 0.08 0.01 | 0.07 0.01 | 0.10 0.01 | 20.71 | 0.08 0.01 | 0.50 0.11 | 0.12 0.01 |
| 4.57 | 21.27 | 0.78 0.32 | 0.75 0.31 | 0.70 0.31 | 21.31 | 0.88 0.32 | 0.79 0.33 | 1.49 0.32 |
| 5.07 | 21.79 | 2.69 0.43 | 4.03 0.51 | 3.78 0.49 | 21.83 | 2.53 0.41 | 4.04 0.49 | 3.72 0.41 |
| 5.57 | 22.35 | 4.37 0.57 | 4.23 0.56 | 3.96 0.54 | 22.39 | 4.02 0.52 | 4.14 0.53 | 3.83 0.52 |
| 6.07 | 22.92 | 6.76 0.77 | 6.56 0.76 | 6.12 0.73 | 22.97 | 6.49 0.70 | 6.00 0.69 | 6.44 0.70 |
| 6.57 | 23.51 | 8.19 0.92 | 7.72 0.88 | 7.25 0.85 | 23.56 | 7.58 0.80 | 7.43 0.80 | 7.48 0.80 |
| 7.07 | 24.11 | 8.89 1.01 | 8.53 0.98 | 7.83 0.93 | 24.15 | 8.50 0.90 | 8.18 0.88 | 8.49 0.90 |
| 7.57 | 24.69 | 12.34 1.31 | 11.62 1.26 | 11.17 1.22 | 24.74 | 11.09 1.10 | 10.70 1.08 | 10.77 1.10 |
| 7.57 | 24.69 | 12.19 1.30 | 9.66 1.11 | 9.04 1.06 | 24.74 | 10.77 1.08 | 8.58 0.95 | 9.59 1.08 |
| 8.07 | 25.25 | 13.45 1.44 | 12.62 1.37 | 11.81 1.31 | 25.29 | 12.04 1.20 | 11.44 1.16 | 12.75 1.20 |
| 8.57 | 25.77 | 15.91 1.67 | 13.86 1.51 | 13.05 1.44 | 25.82 | 13.91 1.36 | 13.36 1.32 | 12.57 1.36 |
| 9.07 | 26.25 | 18.16 1.89 | 16.80 1.78 | 16.07 1.72 | 26.29 | 16.55 1.56 | 16.43 1.56 | 16.94 1.56 |
VI Conclusion
The cross sections for 12C(n, 2n)11C have been measured using an activation technique from threshold to 26.3 MeV with an uncertainty of approximately 9-12% for the higher energies. Previous measurements disagree, tending to fall into upper and lower bands. The results of the present experiment agree with the upper band.
Accurate cross sections may allow the 12C(n, 2n) reaction to be used as neutron diagnostic for ICF. During an ICF implosion, primary and tertiary DT fusion reaction neutrons are produced. Since the ion plasma temperatures in these thermonuclear implosions are typically in the keV range, the primary DT neutron energy is Q value driven. The energy distribution of primary neutrons is typically peaked around 14.1 MeV and has a small thermodynamic width which is broadened further via straggling by the compressed fuel. These neutrons are copious and exceed the production of tertiary neutrons by six to seven orders of magnitude. Conversely, neutrons which are produced by DT fusion reactions caused by up-scattered MeV DT fuel generate tertiary neutrons with energies in the 10 to 32 MeV range. Since the 12C(n, 2n) reaction is insensitive to energies below 20 MeV, the primary 14.1 MeV DT and down scattered primary neutrons cannot react with the carbon. Only tertiary neutrons in 20 to 32 MeV range react making this method useful as a possible ICF tertiary neutron diagnostic.
To use this method, ultra-pure graphite disks placed within the ICF reaction chamber become activated by tertiary neutrons via the 12C(n, 2n)11C reaction. The 11C in the disk subsequently decays via positron emission, and the 511 keV annihilation gamma rays are then counted in coincidence using a detector system far from the target chamber. The gamma counts can then be used to obtain the tertiary neutron yield, limited by the uncertainty in the 12C(n, 2n)11C cross section.
Acknowledgements.
We would like to thank Andrew Evans, Keith Mann, Tyler Reynolds, Ian Love, August Gula, Laurel Vincett, Lee Gabler, Michael Krieger, Mollie Bienstock, Collin Stillman, Drew Ellison, and Holly Desmitt for assistance performing the experiment, and Shamim Akhtar, Don Carter, Sushil Dhakal, Devon Jacobs, John O’Donnell, and Andrea Richard for assistance at Ohio University. This research is funded in part by the University of Rochester Laboratory for Laser Energetics through a grant from the Department of Energy and by the U.S. Department of Energy, under Grant Nos. DE-FG02-88ER40387, DE-NA0001837, and DE-NA0002905. Certain commercial equipment, instruments, or materials are identified in this paper to foster understanding. Such identification does not imply recommendation or endorsement by the National Institute of Standards and Technology, nor does it imply that the materials or equipment identified are necessarily the best available for the purpose.References
- Welch et al. (1988) D. Welch, H. Kislev, and G. Miley, Rev Sci Instrum 59, 610 (1988).
- Glebov et al. (2003) V. Y. Glebov, C. Stoeckl, T. Sangster, D. Meyerhofer, P. Radha, S. Padalino, L. Baumgart, R. Colburn, and J. Fuschino, Rev Sci Instrum 74, 1717 (2003).
- Galbiati et al. (2005) C. Galbiati, A. Pocar, D. Franco, A. Ianni, L. Cadonati, and S. Schönert, Phys. Rev. C 71, 055805 (2005).
- Audi et al. (2012) G. Audi, F. Kondev, M. Wang, B. Pfeiffer, X. Sun, J. Blachot, and M. MacCormick, Chin. Phys. C 36, 1157 (2012).
- Dimbylow (1980) P. Dimbylow, Phys. Med. Biol. 25, 637 (1980).
- Anders et al. (1981) B. Anders, P. Herges, and W. Scobel, Z. Phys. A 301, 353 (1981).
- Welch et al. (1981) P. Welch, J. Johnson, G. Randers-Pehrson, and J. Rapaport, Bull. Am. Phys. Soc 26, 708 (1981).
- Brolley Jr et al. (1952) J. Brolley Jr, J. Fowler, and L. Schlacks, Phys. Rev. 88, 618 (1952).
- Brill et al. (1961) O. D. Brill, N. A. Vlasov, S. P. Kalinin, and L. S. Sokolov, Dok. Akad. Nauk SSSR 136, 55 (1961), [Sov. Phys. Dokl. 6, 24-26 (1961)].
- Soewarsono et al. (1992) T. S. Soewarsono, Y. Uwamino, and T. Nakamura, in Proceedings of the 1991 Symposium on Nuclear Data, JAERI-M 92-027, edited by M. Baba and T. Nakagawa (Tokyo, Tokai, Ibaraki-ken. Japan, 1992) pp. 354–363.
- Uno et al. (1996) Y. Uno, Y. Uwamino, T. S. Soewarsono, and T. Nakamura, Nucl Sci Eng 122, 247 (1996).
- Kelley et al. (2012) J. H. Kelley, E. Kwan, J. Purcell, C. Sheu, and H. Weller, Nucl. Phys. A 880, 88 (2012).
- Drosg (2000) M. Drosg, DROSG-2000: Neutron source reactions., Tech. Rep. IAEA-NDS-87 Rev. 5 (International Atomic Energy Agency, Nuclear Data Section, Vienna (Austria), 2000).
- Stoks et al. (1993a) V. Stoks, R. Klomp, M. Rentmeester, and J. De Swart, Phys. Rev. C 48, 792 (1993a).
- Stoks et al. (1994) V. Stoks, R. Klomp, C. Terheggen, and J. De Swart, Phys. Rev. C 49, 2950 (1994).
- Brun and Rademakers (1997) R. Brun and F. Rademakers, Nucl. Instrum. Methods Phys. Res. A 389, 81 (1997).
- James and Winkler (1998) F. James and M. Winkler, MINUIT–Users Guide, Program Library D506, CERN, Geneva (1998).
- Agostinelli et al. (2003) S. Agostinelli, J. Allison, K. a. Amako, J. Apostolakis, H. Araujo, P. Arce, M. Asai, D. Axen, S. Banerjee, G. Barrand, et al., Nucl. Instrum. Methods Phys. Res. A 506, 250 (2003).
- Allison et al. (2006) J. Allison, K. Amako, J. e. a. Apostolakis, H. Araujo, P. A. Dubois, M. Asai, G. Barrand, R. Capra, S. Chauvie, R. Chytracek, et al., Nuclear Science, IEEE Transactions on 53, 270 (2006).
- Team (2003) X. Team, Los Alamos National Lab Report: LA-UR-03-1987 (2003).
- Stoks et al. (1993b) V. Stoks, R. Timmermans, and J. De Swart, Phys. Rev. C 47, 512 (1993b).