About the rapidity and helicity distributions of the W bosons produced at LHC
Abstract
bosons are produced at LHC from a forward-backward symmetric initial state. Their decay to a charged lepton and a neutrino has a strong spin analysing power. The combination of these effects results in characteristic distributions of the pseudorapidity of the leptons decaying from and of different helicity. This observation may open the possibility to measure precisely the and rapidity distributions for the two transverse polarisation states of bosons produced at small transverse momentum.
At hadron colliders the and bosons are copiously produced, primarily created by the interaction of a quark with an anti-quark. Events with a decaying into lepton and neutrino () can be easily triggered and selected with high purity. However, the neutrino escaping detection prevents the direct measurement of the differential production cross sections. Particularly, the rapidity and polarisation distributions of the must be inferred by the proton Parton Distribution Functions (PDFs). In turn, the PDFs have been constrained by measuring asymmetries in events where a boson is produced.
The relative rate of and produced at the Tevatron as a function of their rapidity has been measured Aaltonen:2009ta ; Abazov:2013dsa using a method proposed in Bodek:2007cz . This observable is sensitive to the ratio of the quark and quark PDFs. Another observable constraining the PDFs is the lepton charge asymmetry, the relative rate of the charged leptons from decays, as a function of the lepton pseudorapidity. It has been measured at the Tevatron and LHC Aad:2011yna ; Chatrchyan:2011jz ; Chatrchyan:2012xt ; Chatrchyan:2013mza ; Khachatryan:2016pev ; Aaij:2015zlq ; Aaij:2016qqz . All these measurements have been used to constrain the PDFs, which are then used to compute the rapidity and polarisation distributions of the . A possible extension of the method of reference Bodek:2007cz to LHC has been studied in Lohwasser:2010sp concluding that in proton proton collisions this technique is less useful for placing constraints on the PDFs than a measurement of the lepton charge asymmetry.
The accuracy of the rapidity and polarisation distribution of the is one of the limiting factors in the precise measurement of the mass at hadron colliders Stirling:1989vx . The so called PDFs uncertainty in the mass determination, stemming from the uncertainty in the PDFs used to compute the rapidity and polarisation distributions, amounts to about 10 MeV in the most recent measurements Aaltonen:2013vwa ; D0:2013jba ; Aaboud:2017svj .
This paper presents some observations on the characteristics of the production at LHC and subsequent decay, which may allow for a precise direct measurement of the rapidity and polarisation distributions of the and .
The LHC experiments have already collected huge samples O() of bosons where the decays into a neutrino and a lepton222The word lepton is used to identify electrons or muons. with large enough transverse momentum to trigger the data acquisition. The bosons are characterised in the reference frame of the experiment by their rapidity , transverse momentum and polarisation. The leptons from their decay are characterised by their transverse momentum and pseudorapidity , where and is the polar angle measured from the z axis, coincident with the common directions of the two proton beams. The pseudorapidity of the lepton in the reference frame is .
The leptons from decays have typically larger than 25 GeV - because of the trigger acceptance - and smaller than 50 GeV because most of the bosons are produced at low transverse momentum. The most probable value of is about 5 GeV. For transverse momenta much smaller than the mass , the has essentially only transverse polarisation and two helicity states. This approximation will be used in the discussion presented in this paper.
1 production and decay at LHC
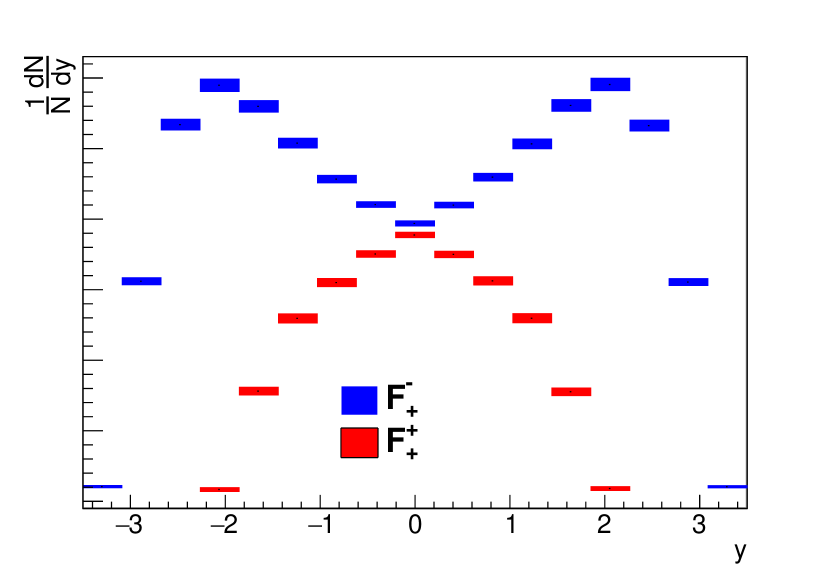
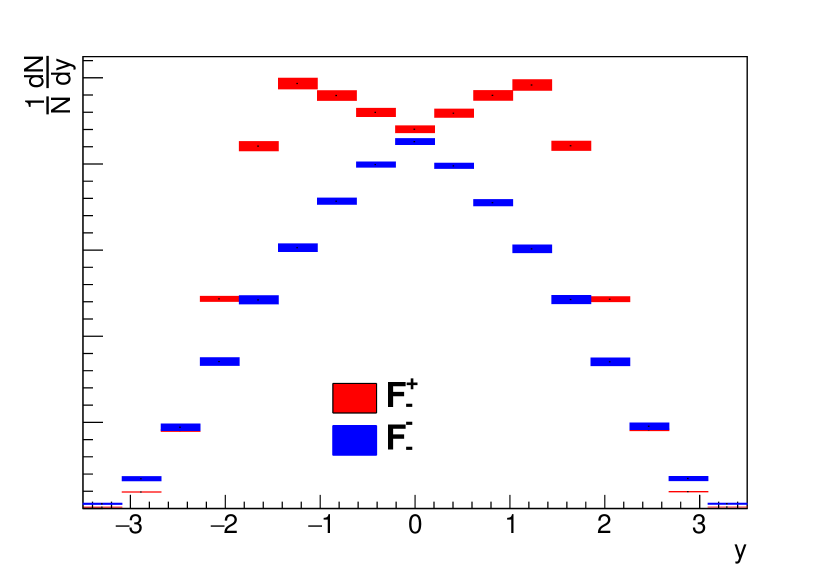
Due to the symmetry of the LHC beams, the rapidity distributions of the and of the , , are symmetric in . Each distribution can be split in the sum of two functions and where the subscript refers to the sign of the helicity .
The four distributions are also symmetric in . They can be computed from the PDFs for a given center of mass energy of the proton-proton collision and have some uncertainties. In Figure 1 the predicted distributions are shown as derived by NNPDF3.1 NNLO PDFAS Ball:2017nwa for a center of mass energy of 8 TeV for events with the lepton in the acceptance 25 GeV and . The events have been generated with PYTHIA 8.2 Sjostrand:2014zea . The helicity is defined by the sign of the longitudinal momentum of the quark producing the times the sign of the rapidity of the produced . The NNPDF3.1 PDFs are constrained by many measurements including the precise lepton charge asymmetry measured by CMS Khachatryan:2016pev at TeV. The rapidity distributions of the computed with these PDFs have a typical uncertainty of 1-2%.
Because of the valence quark content of the proton, about 74% of the in the acceptance are produced in the negative state, while about 59% of the are produced in the positive state.
In decays the direction of the lepton momentum is strongly correlated with the direction of the spin of the . In the rest frame the decay is very asymmetric: more than 87% of () decays have an angle between the directions of the spin and the lepton momentum smaller (larger) than . The most probable value of is about , where the sign depends on the charge and helicity. Most of the with negative and with positive send the lepton backward with respect to the direction of their longitudinal momentum. The pseudorapidity of the lepton in the laboratory frame is . The of the lepton is correlated with . When is small compared to ,
where is the azimuthal angle difference between the transverse momenta of the lepton and of the .
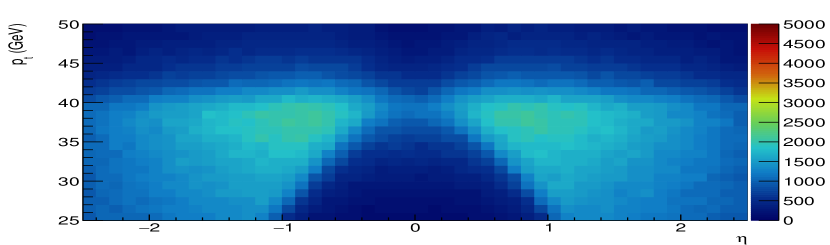
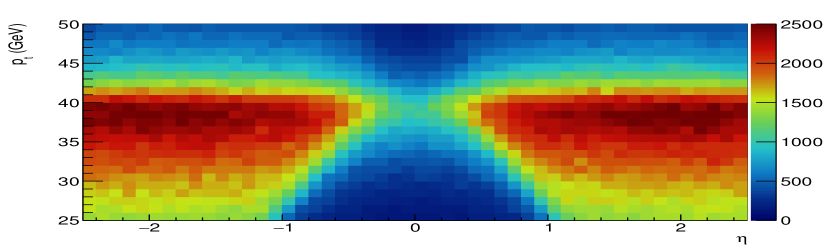
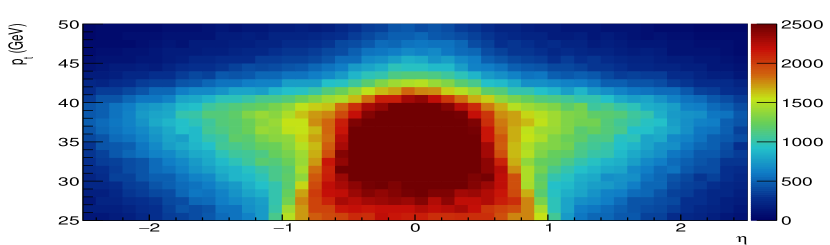
As a consequence of the strong asymmetry in the decay and of the symmetry in the production, the leptons measured near are mainly from bosons produced in only one of the two possible helicity states. Figure 2 shows the lepton vs distributions for the two helicity states. The main features of these plots are explained by the rapidity distributions shown in figure 1 and by the strong asymmetry in the decay.
Considering events in the negative state, when they are produced at positive the pseudorapidity of leptons from their decay is typically , while when they are produced at negative the pseudorapidity is typically . The two peaks of figure 1(a) are therefore shifted by half a unit toward and thus there is an accumulation of events near in the panel 2(a). The events with positive have the opposite behaviour. When produced at positive , the typical pseudorapidity of the lepton is . Conversely, when they are produced at negative the pseudorapidity is typically . This explains the reduction of events near in panel 2(b). The plots can be interpreted in a similar way.
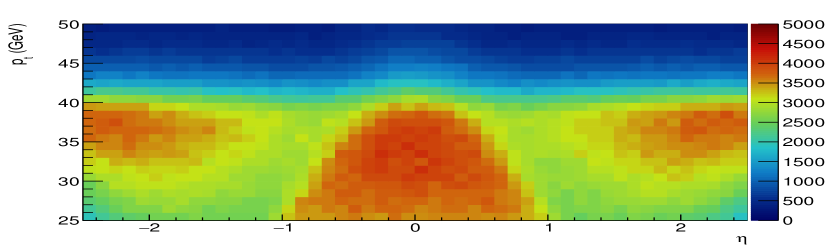
The difference in the shapes of the vs distributions for the two helicity states of and produced at LHC may allow for a direct measurement of the rapidity and helicity distributions of the and .
2 Uncertainty on rapidity and helicity distributions
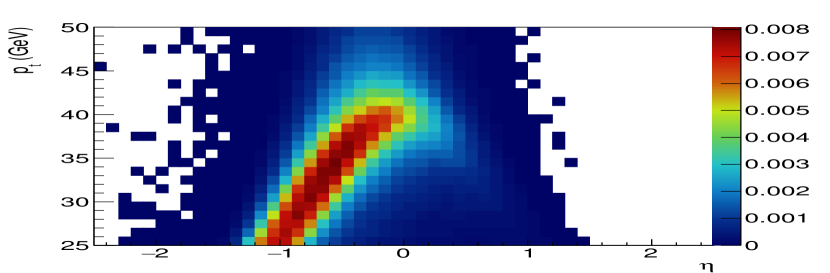
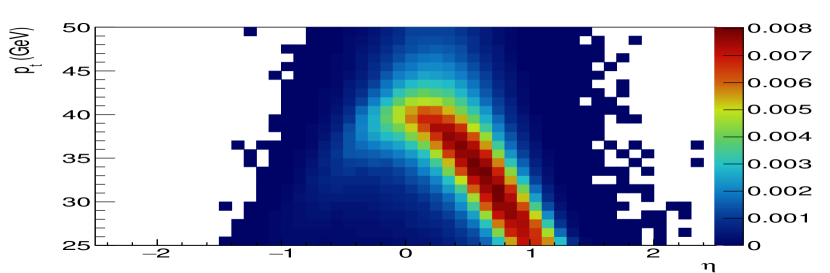
We investigate now if this new observation can be used to measure the rapidity and helicity distributions with a smaller uncertainty with respect to the prediction by the PDFs. We present a very simple analysis using events simulated with PYTHIA 8.2 and NNPDF3.1 and performing a template fit of the vs distribution of the positive leptons measured in the acceptance GeV and . Templates of 50 bins in and 25 bins in are built for produced in 17 bins of rapidity for the two helicity states in the range . The templates are normalised and the number of events of each template is fitted to the pseudodata. Because of the symmetry discussed above, there are only 17 independent variables in the fit. Two templates corresponding to the same rapidity bin and opposite helicity are shown in figure 3. One notices the strong dependence of the decay angle of the W on the helicity and the fact that the smears the correlation between the rapidity and the and of the lepton from its decay resulting from the relation . The acceptance for produced at the extreme value of the rapidity range tends to zero for positive helicity of the and in the fit the first two bins with a very small acceptance have been constrained to the value predicted by the PDFs.
The fit is done on a sample of 18 events in the acceptance. This corresponds to less than 30% of the statistics accumulated by CMS in the 8 TeV run Khachatryan:2016pev . The at the minimum is 1325 for 1237 degrees of freedom. The bins constrained to the PDFs prediction are the first two bins where the rate is close to zero. The computed at the true value, corresponding to the prediction of the PDFs, is 1340.
Figure 4(a) shows the correlation matrix returned by the fit. Yields in nearby bins are correlated due to some overlap in the templates caused by the distribution. These correlations result in small oscillations in the central values of the fit that can be possibly mitigated with regularisation methods or using larger rapidity bins at the expense of a less detailed description of the rapidity distribution. The bins at large are also somewhat correlated because at large rapidity it is more difficult to separate the two helicity states.
The result of the fit is shown in figure 4(b). This figure shows the rapidity distributions of bosons with spin pointing to the negative z axis. It can be compared to Figure 1(a), where the blue curve is taken for the negative rapidity and the red for the positive rapidity.
The very thin uncertainty band shown on the result of the fit includes the full effect of the correlation matrix. It has been computed diagonalising the correlation matrix and summing
in quadrature the 17 independent variations of . The distribution for with spin pointing to the positive z axis is the symmetric distribution.
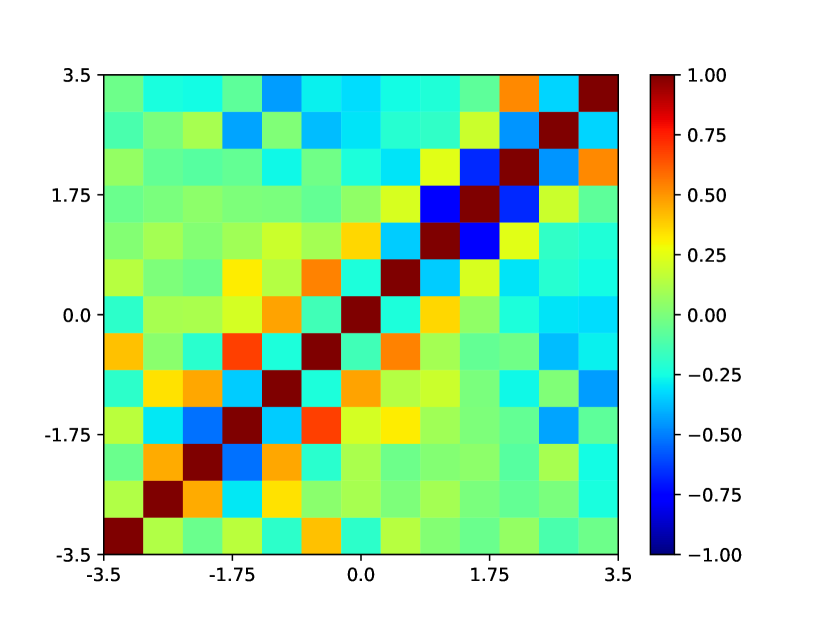
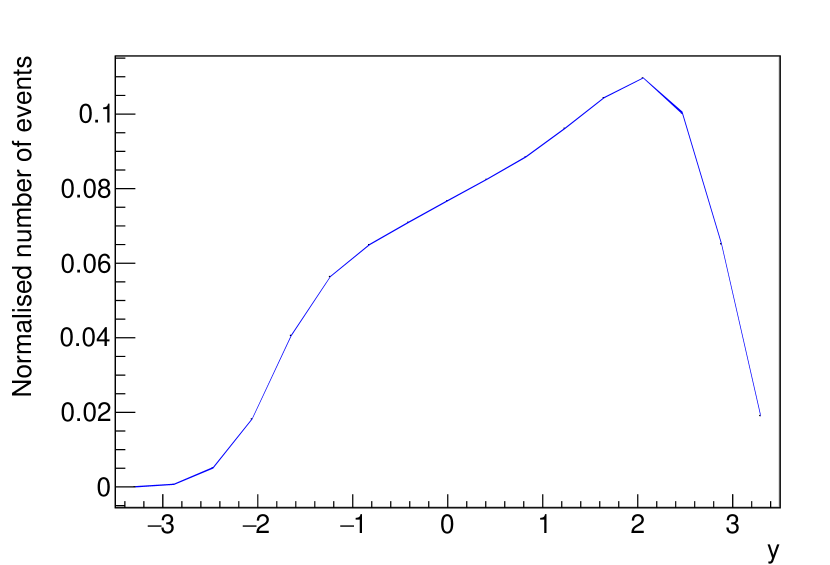
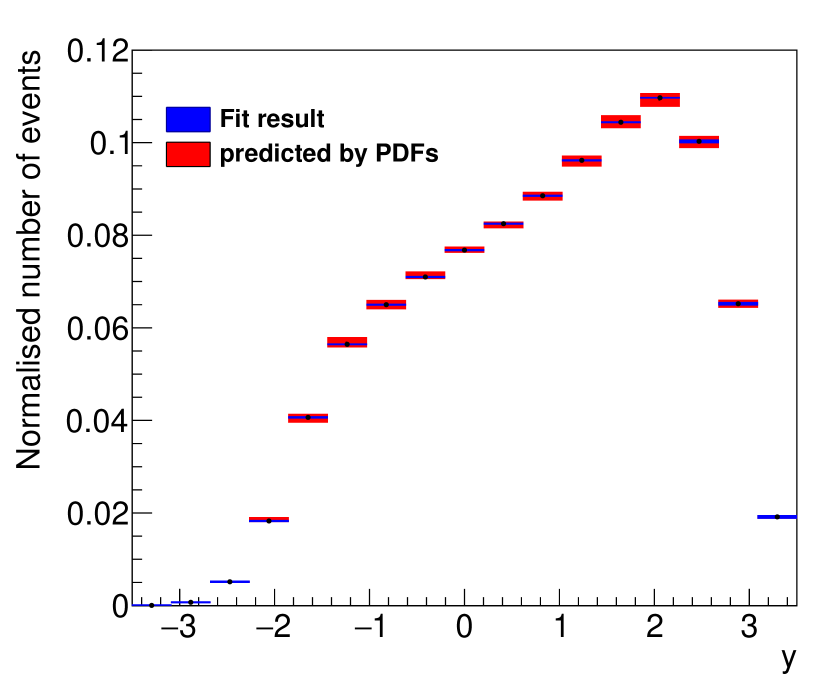
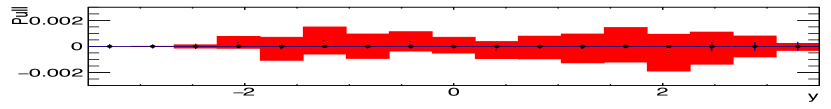
Figure 5(a) shows the comparison between the nominal rapidity distribution computed with the PDFs, shown in figure 1, and the result of the fit. The systematic differences in the central values reflect the small oscillatory behaviour discussed above. Figure 5(b) shows the difference between the fit and the PDFs prediction, while figure 5(c) shows the direct comparison between the PDFs prediction uncertainty band and the fit uncertainty band: one notices that the statistical precision of the fit has a substantially smaller uncertainty than the PDFs prediction, assuming that the oscillations seen with this simple fit can be regularised.
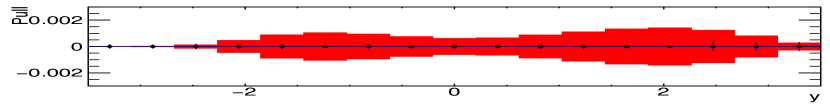
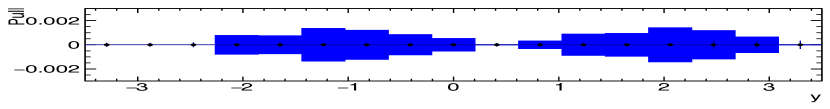
There are several assumptions that may affect systematically the production of the templates. We have investigated the effect of the uncertainty in the lepton trigger and identification efficiency as function of , the uncertainty on the assumed values of the mass and the uncertainty on the shape of the spectrum. The first two effects induce changes on the shape that are smaller than the statistical uncertainty for a 1% random efficiency shift uncorrelated in each bin or for a shift of the mass of 50 MeV. A systematic parabolic change of the shape of the average of as a function of by 2% has also negligible effect. The largest systematic is induced by a change in the spectrum of . The spectrum has been modified with different slopes compatible with the uncertainty band shown in figure 6 of reference Catani:2015vma . Figure 5(d) shows the induced shape variation of the fit compared with the statistical uncertainty band. The variation is larger than the statistical error of the fit, showing that the measurement will be systematically limited. On the other hand, this variation is comparable and somewhat smaller than the uncertainty on the rapidity/helicity distribution computed with the PDFs (Figure 5(c)), showing that the proposed method has the potentiality of reducing the uncertainty on the rapidity and helicity distributions. The analysis performed with simulated events shows similar results.
3 Conclusions
The symmetric production at LHC and its asymmetric decay for a fixed helicity result in characteristic distributions of the vs of the charged leptons stemming from the decay. These distributions may be used for a direct measurement of the and rapidity for the two helicity states of bosons produced at small transverse momentum. This measurement has a statistical uncertainty much smaller than the PDFs prediction. The final systematic accuracy of the measurement can only be assessed with a full analysis of the data already collected by the LHC experiments. At the level of the simple analysis shown in this paper, the proposed method has the potentiality of reducing the uncertainty on the rapidity and helicity distribution. An improved determination of the rapidity and helicity distributions of the and will result in a smaller systematic uncertainty in the measurement of mass at LHC.
Acknowledgements.
The authors are grateful to the members of the CMS mass analysis group for discussions and suggestions. The students thank Scuola Normale Superiore for having supported their stay at CERN.References
- (1) T. Aaltonen et al. [CDF Collaboration], Phys. Rev. Lett. 102, 181801 (2009) doi:10.1103/PhysRevLett.102.181801 [arXiv:0901.2169 [hep-ex]].
- (2) V. M. Abazov et al. [D0 Collaboration], Phys. Rev. Lett. 112, no. 15, 151803 (2014) Erratum: [Phys. Rev. Lett. 114, no. 4, 049901 (2015)] doi:10.1103/PhysRevLett.114.049901, 10.1103/PhysRevLett.112.151803 [arXiv:1312.2895 [hep-ex]].
- (3) A. Bodek, Y. Chung, B. Y. Han, K. S. McFarland and E. Halkiadakis, Phys. Rev. D 77 (2008) 111301 doi:10.1103/PhysRevD.77.111301 [arXiv:0711.2859 [hep-ph]].
- (4) F. Abe et al. [CDF Collaboration], Phys. Rev. Lett. 81, 5754 (1998) doi:10.1103/PhysRevLett.81.5754 [hep-ex/9809001].
- (5) D. Acosta et al. [CDF Collaboration], Phys. Rev. D 71, 051104 (2005) doi:10.1103/PhysRevD.71.051104 [hep-ex/0501023].
- (6) V. M. Abazov et al. [D0 Collaboration], Phys. Rev. D 77, 011106 (2008) doi:10.1103/PhysRevD.77.011106 [arXiv:0709.4254 [hep-ex]].
- (7) V. M. Abazov et al. [D0 Collaboration], Phys. Rev. Lett. 101, 211801 (2008) doi:10.1103/PhysRevLett.101.211801 [arXiv:0807.3367 [hep-ex]].
- (8) V. M. Abazov et al. [D0 Collaboration], Phys. Rev. D 88, 091102 (2013) doi:10.1103/PhysRevD.88.091102 [arXiv:1309.2591 [hep-ex]].
- (9) V. M. Abazov et al. [D0 Collaboration], Phys. Rev. D 91, no. 3, 032007 (2015) Erratum: [Phys. Rev. D 91, no. 7, 079901 (2015)] doi:10.1103/PhysRevD.91.032007, 10.1103/PhysRevD.91.079901 [arXiv:1412.2862 [hep-ex]].
- (10) G. Aad et al. [ATLAS Collaboration], Phys. Lett. B 701, 31 (2011) doi:10.1016/j.physletb.2011.05.024 [arXiv:1103.2929 [hep-ex]].
- (11) S. Chatrchyan et al. [CMS Collaboration], JHEP 1104, 050 (2011) doi:10.1007/JHEP04(2011)050 [arXiv:1103.3470 [hep-ex]].
- (12) S. Chatrchyan et al. [CMS Collaboration], Phys. Rev. Lett. 109, 111806 (2012) doi:10.1103/PhysRevLett.109.111806 [arXiv:1206.2598 [hep-ex]].
- (13) S. Chatrchyan et al. [CMS Collaboration], Phys. Rev. D 90, no. 3, 032004 (2014) doi:10.1103/PhysRevD.90.032004 [arXiv:1312.6283 [hep-ex]].
- (14) V. Khachatryan et al. [CMS Collaboration], Eur. Phys. J. C 76, no. 8, 469 (2016) doi:10.1140/epjc/s10052-016-4293-4 [arXiv:1603.01803 [hep-ex]].
- (15) R. Aaij et al. [LHCb Collaboration], JHEP 1601 (2016) 155 doi:10.1007/JHEP01(2016)155 [arXiv:1511.08039 [hep-ex]].
- (16) R. Aaij et al. [LHCb Collaboration], JHEP 1610 (2016) 030 doi:10.1007/JHEP10(2016)030 [arXiv:1608.01484 [hep-ex]].
- (17) K. Lohwasser, J. Ferrando and C. Issever, JHEP 1009 (2010) 079 doi:10.1007/JHEP09(2010)079 [arXiv:1005.3196 [hep-ph]].
- (18) W. J. Stirling and A. D. Martin, Phys. Lett. B 237, 551 (1990). doi:10.1016/0370-2693(90)91223-X
- (19) T. A. Aaltonen et al. [CDF Collaboration], Phys. Rev. D 89, no. 7, 072003 (2014) doi:10.1103/PhysRevD.89.072003 [arXiv:1311.0894 [hep-ex]].
- (20) V. M. Abazov et al. [D0 Collaboration], Phys. Rev. D 89, no. 1, 012005 (2014) doi:10.1103/PhysRevD.89.012005 [arXiv:1310.8628 [hep-ex]].
- (21) M. Aaboud et al. [ATLAS Collaboration], arXiv:1701.07240 [hep-ex].
- (22) R. D. Ball et al. [NNPDF Collaboration], Eur. Phys. J. C 77 (2017) no.10, 663 doi:10.1140/epjc/s10052-017-5199-5 [arXiv:1706.00428 [hep-ph]].
- (23) T. Sjostrand et al., Comput. Phys. Commun. 191, 159 (2015) doi:10.1016/j.cpc.2015.01.024 [arXiv:1410.3012 [hep-ph]].
- (24) S. Catani, D. de Florian, G. Ferrera and M. Grazzini, JHEP 1512, 047 (2015) doi:10.1007/JHEP12(2015)047 [arXiv:1507.06937 [hep-ph]].