\ceC60+ and the Diffuse Interstellar Bands:
An Independent Laboratory Check
ABSTRACT
In 2015, Campbell et al. (Nature 523, 322) presented spectroscopic laboratory gas phase data for the fullerene cation, \ceC60+, that coincide with reported astronomical spectra of two diffuse interstellar band (DIB) features at 9633 and 9578 Å. In the following year additional laboratory spectra were linked to three other and weaker DIBs at 9428, 9366, and 9349 Å. The laboratory data were obtained using wavelength-dependent photodissociation spectroscopy of small (up to three) \ceHe-tagged \ceC60+\ceHe_ ion complexes, yielding rest wavelengths for the bare \ceC60+ cation by correcting for the \ceHe-induced wavelength shifts. Here we present an alternative approach to derive the rest wavelengths of the four most prominent \ceC60+ absorption features, using high resolution laser dissociation spectroscopy of \ceC60+ embedded in ultracold \ceHe droplets. Accurate wavelengths of the bare fullerene cation are derived based on linear wavelength shifts recorded for \ceHe_\ceC60+ species with up to 32. A careful analysis of all available data results in precise rest wavelengths (in air) for the four most prominent \ceC60+ bands: 9631.9(1) Å, 9576.7(1) Å, 9427.5(1) Å, and 9364.9(1) Å. The corresponding band widths have been derived and the relative band intensity ratios are discussed.
keywords:
ISM: molecules , molecular data , techniques: spectroscopic , line: identificationIntroduction
In 1922, Heger reported for the first time broad features, interstellar in nature, in spectra of stars reddened by cosmic dust (Heger, 1922). Today, more than 400 of such diffuse interstellar bands (DIBs) have been observed, covering the UV/VIS and near-IR with strongly varying spectral appearances (Herbig, 1995; Hobbs et al., 2008; Cox et al., 2017). Despite decades of dedicated spectroscopic research, it has not been possible to identify their carriers (see e.g. Herbig, 1995; Snow & McCall, 2006; Sarre, 2006; Cox & Cami, 2014). Several claims of DIB identifications, like for \ceC7- (Tulej et al., 1998), \ceC3H2 (Maier et al., 2011b), \ceC4H2+ (Krełowski et al., 2010), or benzene derivatives (Ball et al., 2000) had to be withdrawn, after additional laboratory and/or observational studies became available (McCall et al., 2001, 2002; Araki et al., 2012; Liszt et al., 2012; Krełowski et al., 2012; Maier et al., 2011a; Araki et al., 2004). Recently, however, a set of in total five near-infrared DIBs was assigned to one specific carrier, the fullerene cation \ceC60+ (Campbell et al., 2015, 2016a, 2016b; Walker et al., 2015, 2016). The idea of \ceC60+ acting as a DIB carrier dates back to Foing & Ehrenfreund (1994), who linked matrix data recorded by Fulara et al. (1993) to two isolated DIBs, observed around 960 nm. A direct comparison between laboratory and observational data was not possible, as wavelengths recorded in matrix isolation experiments typically shift with respect to their gas phase equivalents through solid state interactions. It took 20 years to record for a first time the corresponding gas phase transitions and to provide their rest wavelengths (Campbell et al., 2015, 2016b). The method that was used is based on trapping \ceHe-tagged ions in an ion trap and recording mass spectrometrically the wavelength-dependent dissociation pattern (Chakrabarty et al., 2013). This method is powerful, as it guarantees full mass selectivity. Other methods, like plasma jets in combination with direct absorption spectroscopy (Motylewski & Linnartz, 1999) suffer from the multitude of different species that are formed, but have the advantage that the spectra reflect fully isolated conditions, i.e., a laboratory spectrum can be directly compared to an astronomical spectrum (once corrected for any velocity offsets) (see e.g. Motylewski et al., 2000). In an ion-tagged experiment this does not apply. The size of the inherent wavelength shift depends on the strength of the intermolecular bond with the atom tag and this, in turn, depends on where the tagging takes place. In particular, ionic complexes have shown to exhibit large wavelength shifts due to the strength of the intermolecular interaction, i.e., in proton bound or charge-transfer complexes (Bieske & Dopfer, 2000). In the case of \ceHe-tagging, shifts due to molecular interactions are typically small. The resulting shifts involved in the \ceC60+\ceHe_ () case as presented by Campbell et al. (2015, 2016a) were concluded to be of the order of 0.7 Å per tagged \ceHe atom. Based on an extrapolation through the available data points, i.e., correcting for the offset induced by the tagged \ceHe atoms, this has resulted in rest wavelengths in air that have been reported in several studies and adapted in follow-up papers, yielding 9632.1, 9577.0, 9427.8, 9365.2, and 9348.4 Å, with 0.2 Å accuracy (Campbell et al., 2016b). We will refer to these features as Bands 1, 2, 3, 4, and 5, respectively.
DIBs located at the laboratory wavelengths found for bands 1 and 2 have been reported in many previous observational studies. Even though the latter band overlaps with a stellar \ceMg ii line, complicating the interpretation of the equivalent width (Galazutdinov et al., 2017; Walker et al., 2017), these features are considered as established DIBs. However, this is not the case for three weaker, previously unreported bands that were identified by Walker et al. (2015, 2016) on the basis of the laboratory data presented in the Campbell et al. studies. The overall S/N of these three DIB detections is quite low, which is mainly due to a very high level of telluric water pollution in the wavelength domain involved. Moreover, in these studies not all DIBs are visible along every line-of-sight and the total number of line-of-sights is limited. This puts strong constraints on the data interpretation.
The current situation can be summarized in the following way. The laboratory rest wavelengths of pure \ceC60+ are based on a mass selective method of complexed ions, extrapolating numbers on the basis of a rather small number of data points (\ceC60+\ceHe_, ). Five bands have been reported. The two stronger bands overlap with known DIB features; astronomical matches with the three weaker bands have been claimed by one astronomical team. This claim has obtained support in the literature (Omont, 2016; Ehrenfreund & Foing, 2015), but also raised serious concerns (Galazutdinov et al., 2017). In the latter work, a lacking correlation of the integrated absorbance between the two stronger DIBs is reported with intensity ratios deviating strongly from the laboratory values. Moreover, it appeared not possible to reproduce the weaker DIBs in spectra obtained along a large number of different lines-of-sight. A very recent study by Walker et al. (2017), following a different approach, concludes on constant 9632/9577 equivalent width ratios in agreement with the laboratory values. As stated before, spectral pollution, mainly due to atmospheric water, severely complicates the analysis of all these ground-based data around 950 nm. For this reason, in another very recent study, Cordiner et al. (2017) presented the first Hubble Space Telescope data (i.e., telluric-free) around 1 m. Several new near-infrared DIBs were reported, but the chosen target star was found to be suboptimal for the DIBs linked to \ceC60+.
As DIBs have been posing a paradigm for nearly a century now, it is important that the \ceC60+ claims are confirmed or disproved by independent investigations. In the past, coincidental overlaps between laboratory spectra and DIB features have been mistakenly interpreted as matches. In the already mentioned case of \ceC7-, as many as eight vibronic bands were found to overlap with reported DIBs, even with comparable equivalent width ratios, and still, years later, this overlap was found to be coincidental (Tulej et al., 1998; McCall et al., 2001). Statistically, the chance of spectral overlap between laboratory and astronomical data is high, particularly in the visible range given the large number of DIB features. For this reason laboratory data with accuracies comparable to or better than achievable in astronomical observations are needed. Here we present laboratory data to provide an independent experimental verification of wavelength positions, linewidths, and line intensity ratios. A different experimental approach is used, based on embedding \ceC60+ ions in ultracold \ceHe droplets. This method is well established and has been successfully used to study both spectroscopic and dynamical properties of molecules (e.g. Brauer et al., 2011; Zhang & Drabbels, 2014; Bierau et al., 2010; Filsinger et al., 2012). It has several advantages: it is mass selective, ultra-sensitive, and the very low temperatures allow adding many more \ceHe atoms to the \ceC60+ core than possible in an ion trap configuration. In a recent paper, we have discussed the solvation behavior of \ceC60+ and discussed \ceHe_\ceC60+ clusters with sizes larger than (Kuhn et al., 2016b), showing that this process is governed by ‘onion-shell-like’ filling properties. Here we focus on the first solvation shell that is of direct relevance for determining the \ceC60+ rest wavelengths. An extension and reanalysis of the Kuhn et al. (2016a, b) data is presented, providing accurate values that can be used to compare with the astronomical data.
Details of the applied method are described in the next section. Subsequently, our results are presented and discussed. We summarize with a conclusion.
Experiment and experimental results
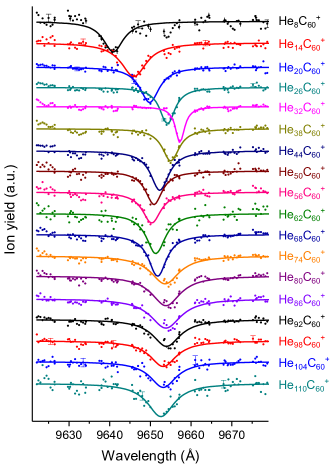
Helium nanodroplets are formed via expansion of 99.9999% pure \ceHe at a pressure of 2.2 MPa and a temperature of 9.7 K through a 5 m pinhole nozzle into an ultra-high vacuum. Evaporative cooling after condensation leads to a final temperature of 0.37 K of the droplets (Toennies & Vilesov, 2004). The resulting log-normal size distribution of the neutral droplets yields an average size of about 200,000 \ceHe atoms. The helium nanodroplets are loaded with fullerenes by passing the neutral beam through a stagnant vapor. Fullerenes are brought into the gas phase by vaporizing \ceC60 powder (purity 99.99%, SES Research) in a high temperature oven (290 ∘C) that is mounted in a pick-up chamber. The \ceC60+ fullerene cations are formed through electron impact ionization (60 eV) of the doped \ceHe droplets and a subsequent charge transfer from the initially formed \ceHe+ atom to a \ceC60 molecule that has been embedded into the \ceHe nanodroplet. Low-mass ions that are ejected from the ionized droplet are then detected by a high resolution reflectron time-of-flight (TOF) mass spectrometer. The high mass resolution of m/m 3000 allows to discriminate between clusters with nominally the same mass. After ionization and before TOF detection, the cluster ions are irradiated by the narrow band output of a cw Ti:Sa laser with 0.6 W power and a spectral resolution of 10 MHz, covering 700 to 1000 nm. In the case of a resonant excitation of a \ceC60+ transition, the photo-absorption causes the ion-\ceHe_ complex to heat-up, resulting in the loss of weakly bound \ceHe atoms. It typically takes an energy less than 100 to evaporate one \ceHe atom, so the resonant absorption of a 1 m photon results in a substantial mass loss. This process can be visualized mass spectrometrically as a wavelength-dependent depletion in the mass signal. Mass spectra are recorded simultaneously for many different cluster ions while the laser is tuned over the wavelength domain where the four stronger \ceC60+ bands are located. This is illustrated in Figure 1 for band 1, also for larger -values that are not of direct relevance to the present study. Clearly, different cluster sizes absorb at different and characteristic wavelengths, and the resulting bandwidths are likely determined by small energy differences that correspond with different isomeric structures. Further experimental details are available from Leidlmair et al. (2012).
Results and discussion
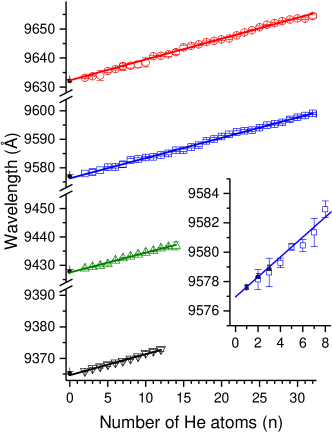
Size dependent wavelength shifts as visible from the mass spectra in Figure 1 are summarized for four \ceHe_\ceC60+ bands (bands 1, 2, 3, and 4) in Figure 2. Band 5 has not been investigated because of the low signal intensity. In this diagram the absorption wavelengths for sequential -values are given, with varying from 232, 232, 214, and 212 for bands 1, 2, 3, and 4, respectively. Each additional \ceHe atom causes a small and characteristic shift of 0.7 Å. This effect is found for all four \ceC60+ bands and is fully determined by the way a solid layer of helium atom forms around the \ceC60+ that can be considered an ionic impurity in bulk superfluid helium. From the experiment and supporting theory (see Kuhn et al., 2016b) it is confirmed that the first shell around the \ceC60+ is filled by 32 \ceHe atoms; 20 \ceHe atoms above hexagons, and 12 \ceHe atoms above pentagons. The binding energy of \ceHe to \ceC60+ onto a hexagonal and a pentagonal face is not identical (17 vs. 15 meV according to path integral calculations), so one would expect that a \ceHe attached to a hexagonal site leads to a somewhat stronger redshift than to a pentagonal site. But as we do not find any kink at or 20, it is very likely that all sizes are simply statistically occupied with no clear isomerization preference for specific sites. This will be the topic of a separate study.
At , a clear change from a linear red shift to a non- or much less linear blue shift is also found. This reflects perturbations caused by the ongoing implementation of \ceHe atoms in the first shell, delocalizing the already attached \ceHe atoms. This solvation behavior has been investigated in detail by Kuhn et al. (2016b) and, as stated before, is not the topic of the present study. The goal here is to use up to 32 measurement points for the four stronger \ceC60+ bands to extrapolate to the wavelength for which the bare \ceC60+ ion is expected to absorb, as illustrated in Figure 2. The number of data points for the two weaker bands is smaller than for bands 1 and 2, but still substantially larger than the number of measurement points obtained in the \ceC60+\ceHe_ ion trap tagging experiment. Error bars indicate the position uncertainty of the Lorentzian fit of each resonance, which takes the standard deviation of the ion yield into account. Typical standard deviations amount to 0.1 Å. The absolute laser wavelength has been determined using a wavelength meter (HighFinesse WS-7) with an estimated systematic deviation of 0.1 Å.
In the first two columns of Table 1 with laboratory data, we compare the transition wavelengths of Kuhn et al. (2016b) with the values derived in the present study. The wavelengths are given both in vacuum and air, using the Morton (2000) IAU standard conversion. It should be noted that the extrapolation shown here is based on the physically maximum number of data points accessible – beyond 32 \ceHe atoms, the \ceC60+ fullerene cations complex along a different mechanism and the resulting shifts cannot be used anymore (see Kuhn et al., 2016a). The inset of Figure 2 illustrates the problem that exists when extrapolating the rest wavelengths based on a smaller sample issue; a small deviation in one of the measuring points can already affect the final rest wavelength substantially. This becomes a problem when the deviation is of the order of the astronomical accuracy with which DIB peak positions can be determined. This may explain why the initial values reported by Campbell et al. (2015) were corrected recently, shifting them by about Å (Campbell et al., 2016a). These values overlap and add a few wavelength points to the lower end of our data set. As the estimated uncertainties are rather similar, these can be included in a more complete fit without additional weighting, resulting in peak positions at 9634.7(1), 9579.5(1), 9430.1(1), and 9367.5(1) Å (in vacuum). The corresponding wavelengths in air are also listed in Table 1. These values slightly deviate (between 0.1 up to 0.5 Å) from those previously reported in Kuhn et al. (2016b). This is partly due to a re-evaluation of our data with better corrections for contaminations, such as pristine \ceHe clusters. The final values are within 0.3 Å from the values reported by Campbell et al. (2016b). Our overall precision has increased because of the use of more data points and an additional measurement series.
In Table 1, all values reported so far are summarized and compared with the astronomical values. This is also visualized in Figure 3, showing the artificial DIB profiles for bands 1, 2, 3, and 4 in normalized intensities. The shaded area shows the astronomical FWHMs of the bands involved.
In the most recent paper Walker et al. (2016) used the Campbell et al. (2016a) data to conclude that DIB features derived from the Canada-France-Hawaii Telescope data do fit even better with these adapted laboratory values. As stated before, bands 1 and 2 have been recorded in a number of independent astronomical studies; for bands 3, 4, and 5 this is not the case yet and the astronomical peak positions were guided by the work presented in Walker et al. (2015, 2016).
| Laboratory data | DIB data | |||||||||||||||||||||
| This work | Kuhn et al. (2016b) | Campbell et al. (2015) | Campbell et al. (2016a) | Campbell et al. (2016b) |
|
|||||||||||||||||
| Band 1 |
|
|
|
|
|
|
|
|||||||||||||||
| Band 2 |
|
|
|
|
|
|
|
|||||||||||||||
| Band 3 |
|
|
|
|
|
|
|
|||||||||||||||
| Band 4 |
|
|
|
|
|
|
|
|||||||||||||||
| Band 5 |
|
|
|
|
|
|
|
|||||||||||||||
| Note: The listed DIB values are taken from the catalogued DIB lists (Cox et al., 2014; Walker et al., 2015, 2016). The uncertainty in the values from this | ||||||||||||||||||||||
| work reflects the statistical error. | ||||||||||||||||||||||
The \ceC60+ rest wavelengths derived from the \ceHe droplet experiments presented here confirm the initial conclusions made in Campbell et al. (2015). Within the relatively small error margins of the individual experiments the overlap is convincing, typically within 2 or better. Even though no pure \ceC60+ ions were measured directly in the ion trap study, nor in our \ceHe droplet experiment, it is fair to conclude that the extrapolations provide data accurate enough (within 0.2 Å) to compare with the astronomical spectra. This accuracy is smaller than the typical bandwidths found in astronomical spectra, as shown in Figure 3. The experimental bandwidths reported by Campbell et al. for the small \ceC60+\ceHe_ clusters are of the order of Å. This value may have an isomeric origin; it makes a difference, here, whether a \ceHe atom is situated above a hexagon or a pentagon site, i.e., one \ceHe atom already can result in two energy values. For the bigger clusters, in our experiment, the larger number of different isomeric forms will contribute to the overall bandwidths. The only exception is \ceHe32\ceC60+ species for which only one isomeric form exists and the experimental bandwidth determined here amounts to 2.4 Å, comparable to the values derived by Campbell and coworkers and very similar to the astronomical values that are listed in Fig. 3. Effects of Doppler broadening can be safely neglected.
Apart from an independent check of the rest wavelengths and bandwidth of \ceC60+, the \ceHe droplet measurements presented here also provide information on the intensity ratios of the \ceC60+ bands. In the ion tag experiments the intensity ratio of bands 1 to 4 is 0.8 : 1.0 : 0.3 : 0.2. Galazutdinov et al. (2017) concluded that the astronomical intensity ratios of bands 1 and 2, determined for a large number of lines-of-sight, do not behave like 0.8 : 1.0, and actually seem to lack any correlation at all. This has been used as an argument against \ceC60+ as the carrier of these bands. Galazutdinov and coworkers used theoretical modeling of contaminating \ceMg ii stellar lines to derive their conclusions. This approach was questioned by Walker et al. (2017) who concluded equivalent width ratios fully in line with the laboratory values using a different method. A discussion about the astronomical data interpretation is beyond the scope of the present work. However, it is possible that intensity ratios derived from a complexed fullerene ion do not reflect those of the bare \ceC60+ cation. For this reason, we have investigated the intensity ratio for bands 1 and 2 for -values up to 100. These experiments turned out to be hard, but show that the ratio is not fully constant and can (slowly) vary with sequential -values. The effect is particularly visible for higher -values; for low -values the error margins are too large to derive conclusive statements. It is likely, however, that the intensity ratio for the bare \ceC60+ bands will not differ much from that derived experimentally for lower -values. We are currently in the process of remeasuring the relative intensities of bands 1 to 4 for -values below .
A logical continuation at this stage is an independent observational check to investigate to which extent also the weaker DIBs can be found at the experimentally determined wavelengths. Heavy telluric pollution in this wavelength region, particularly by water features, complicates the astronomical data interpretation. As stated earlier, a first attempt to use the Hubble Space Telescope for DIB research in the 1 m region has been successful (Cordiner et al., 2017), but signals for bands 3, 4, and 5, if any, were found to be at the noise level and a follow up study for different target stars is needed for an unambiguous conclusion.
Both \ceC60 (Cami et al., 2010; Sellgren et al., 2010) and \ceC60+ (Berné et al., 2013) have been detected in other environments in space through their mid-infrared emission spectra. Given the relatively low ionization potential of \ceC60 ( 7.6 eV, de Vries et al., 1992), one would expect \ceC60+ (or possibly even \ceC602+) to be observable as well. Clearly, a positive identification of \ceC60+ in translucent interstellar clouds would be important from an astrochemical point of view and the combined work by Campbell and Walker strongly hint in this direction. Up to now only \ceC3 (Haffner & Meyer, 1995; Maier et al., 2001; Schmidt et al., 2014) has been identified as one of the few smaller and pure carbon species in diffuse clouds. Attempts to search for \ceC4 and \ceC5 resulted in upper limits (Maier et al., 2004). It is obvious that \ceC60+ will not form from merging twenty \ceC3 units and a better idea of the role of polyatomic carbon species is needed to understand the processes at play. Possibly, \ceC60 does not form bottom-up, but in top-down processes, i.e., as reaction product from a larger precursor. In a recent study by Zhen et al. (2014) it was experimentally shown that fullerenes can form upon photo-dissociation of GRAND PAHs, very large polycyclic aromatic hydrocarbons (PAHs), fully in agreement with predictions by Berné & Tielens (2012) and Berné et al. (2015). This would link DIBs to PAHs, a hypothesis that has been tested in the past (see Cox & Cami, 2014, for an overview), but laboratory spectra of commercially available PAHs and their cations did not match with reported DIB features (Salama et al., 2011). Instead, it may be possible that large PAH derivatives or other, smaller and more stable carbon cages are involved. Such species have been hard to produce in large abundances and under mass resolved and fully controlled laboratory conditions. The method presented here, however, has the sensitivity to exactly provide spectra for such species.
In conclusion, our work shows that the available \ceC60+ laboratory rest wavelengths and derived bandwidths can be used for comparison with astronomical data. Band intensity ratios do not seem to vary strongly between subsequent -values. An unambiguous identification of \ceC60+ as a DIB carrier is awaiting a pollution-free spectrum, clearly exhibiting all five \ceC60+ bands with equivalent width ratios and bandwidths in agreement with the available laboratory data.
Acknowledgments
This study was supported by the Fonds zur Förderung der Wissenschaftlichen Forschung (FWF) projects P26635, W1259, and I978-N20, Deutsche Forschungsgemeinschaft (DFG) project I978-N20, the European COST Action CM1204 XLIC, and the European Research Council under ERC Grant Agreement Number 279898. Laboratory astrophysics in Leiden is supported by the Netherlands Research School for Astronomy (NOVA) and NWO (Netherlands Organisation for Scientific Research) through the Dutch astrochemistry network and a VICI grant.
References
- Araki et al. (2012) Araki, M., Takano, S., Yamabe, H., Tsukiyama, K., & Kuze, N. 2012, ApJL, 735, L11
- Araki et al. (2004) Araki, M., Linnartz, H., Kolek, P., et al. 2004, ApJ, 616, 1301
- Ball et al. (2000) Ball, C. D., McCarthy, M. C., & Thaddeus, P. 2000, ApJ, 529, L61
- Berné et al. (2015) Berné, O., Montillaud, J., & Joblin, C. 2015, A&A, 577, A133
- Berné et al. (2013) Berné, O., Mulas, G., & Joblin, C. 2013, A&A, 550, L4
- Berné & Tielens (2012) Berné, O., & Tielens, A. G. G. M. 2012, PNAS, 109, 401
- Bierau et al. (2010) Bierau, F., Kupser, P., Meijer, G., & von Helden, G. 2010, PRL, 105, 133402
- Bieske & Dopfer (2000) Bieske, E. J., & Dopfer, O. 2000, CR, 100, 3963
- Brauer et al. (2011) Brauer, N. B., Smolarek, S., Zhang, X. H., Buma, W. J., & Drabbels, M. 2011, JPCL, 2, 1563
- Cami et al. (2010) Cami, J., Bernard-Salas, J., Peeters, E., & Malek, S. E. 2010, Sci, 329, 1180
- Campbell et al. (2015) Campbell, E. K., Holz, M., Gerlich, D., & Maier, J. P. 2015, Natur, 523, 322
- Campbell et al. (2016a) Campbell, E. K., Holz, M., & Maier, J. P. 2016a, ApJL, 826, L4
- Campbell et al. (2016b) Campbell, E. K., Holz, M., Maier, J. P., et al. 2016b, ApJ, 822, A17
- Campbell & Maier (2017) Campbell, E. K., & Maier, J. P. 2017, JCP, 146, 160901
- Chakrabarty et al. (2013) Chakrabarty, S., Holz, M., Campbell, et al. 2013, JPCL, 23, 4051
- Cordiner et al. (2017) Cordiner, M. A., Cox, N. L. J., Lallement, R., et al. 2017, ApJL, 843, L2
- Cox & Cami (2014) Cox, N. L. J., & Cami, J., eds. 2014, The Diffuse Interstellar Bands, IAU297
- Cox et al. (2014) Cox, N. L. J., Cami, J., Kaper, L., et al. 2014, A&A, 569, A117
- Cox et al. (2017) Cox, N. L. J., Cami, J., Farhang, A., et al. 2017, A&A, submitted
- de Vries et al. (1992) de Vries, J., Steger, H., Kamke, B., et al. 1992, CPL, 188, 159
- Ehrenfreund & Foing (2015) Ehrenfreund, P., & Foing, B. 2015, Natur, 523, 296
- Filsinger et al. (2012) Filsinger, F., Ahn, D., Meijer, G., & von Helden, G. 2012, PCCP, 14, 13370
- Foing & Ehrenfreund (1994) Foing, B., & Ehrenfreund, P. 1994, Natur, 369, 296
- Fulara et al. (1993) Fulara, J., Jakobi, M., & Maier, J. 1993, CPL, 211, 227
- Galazutdinov et al. (2017) Galazutdinov, G. A., Shimansky, V. V., Bondar, A., Valyavin, G., & Krełowski, J. 2017, MNRAS, 465, 3956
- Haffner & Meyer (1995) Haffner, L. M., & Meyer, D. M. 1995, ApJ, 453, 450
- Heger (1922) Heger, M. L. 1922, Lick Observatory Bulletin, 10, 146
- Herbig (1995) Herbig, G. H. 1995, ARA&A, 33, 19
- Hobbs et al. (2008) Hobbs, L. M., York, D. G., Snow, T. P., et al. 2008, ApJ, 680
- Krełowski et al. (2010) Krełowski, J., Beletsky, Y., Galazutdinov, G. A., et al. 2010, ApJL, 714, L64
- Krełowski et al. (2012) Krełowski, J., Galazutdinov, G., & Kollos, R. 2012, ApJ, 735, A124
- Kuhn et al. (2016a) Kuhn, M., Postler, J., Ralser, S., et al. 2016a, in the XXth Symposium on Atomic, Cluster and Surface Physics (Innsbruck, Innsbruck Univ. press), 150
- Kuhn et al. (2016b) Kuhn, M., Renzler, M., Postler, J., et al. 2016b, Nat. Commun., 7, 13550
- Leidlmair et al. (2012) Leidlmair, C., Wang, Y., Bartl, P., et al. 2012, PRL, 108, 6
- Liszt et al. (2012) Liszt, H., Sonnentrucker, P., Cordiner, M., & Gerin, M. 2012, ApJL, 753, L28
- Maier et al. (2011a) Maier, J. P., Chakrabarty, S., Mazzotti, F. J., et al. 2011a, ApJL, 729, L20
- Maier et al. (2001) Maier, J. P., Lakin, N. M., Walker, G. A. H., & Bohlender, D. A. 2001, ApJ, 553, 267
- Maier et al. (2004) Maier, J. P., Walker, G. A. H., & Bohlender, D. A. 2004, ApJ, 602, 286
- Maier et al. (2011b) Maier, J. P., Walker, G. A. H., Bohlender, D. A., et al. 2011b, ApJ, 726, A41
- McCall et al. (2002) McCall, B. J., Oka, T., Thorburn, J., Hobbs, L. M., & York, D. G. 2002, ApJL, 567, L145
- McCall et al. (2001) McCall, B. J., Thorburn, J., Hobbs, L. M., et al. 2001, ApJL, 559, 49
- Morton (2000) Morton, D. C. 2000, ApJS, 130, 403
- Motylewski & Linnartz (1999) Motylewski, T., & Linnartz, H. 1999, RSI, 70, 1305
- Motylewski et al. (2000) Motylewski, T., Linnartz, H., Vaizert, O., et al. 2000, ApJ, 531, 312
- Omont (2016) Omont, A. 2016, A&A, 590, A52
- Salama et al. (2011) Salama, F., Galazutdinov, G. A., Krełowski, J., et al. 2011, ApJ, 839, A154
- Sarre (2006) Sarre, P. J. 2006, JMS, 238, 1
- Schmidt et al. (2014) Schmidt, M. R., Krełowski, J., Galazutdinov, G. A., et al. 2014, MNRAS, 441, 1134
- Sellgren et al. (2010) Sellgren, K., Werner, M. W., Ingalls, J. G., et al. 2010, ApJL, 722, L54
- Snow & McCall (2006) Snow, T. P., & McCall, B. J. 2006, ARA&A, 44, 367
- Toennies & Vilesov (2004) Toennies, J. P., & Vilesov, A. F. 2004, Angew. Chem. Int. Ed., 43, 2622
- Tulej et al. (1998) Tulej, M., Kirkwood, D. A., Pachkov, M., & Maier, J. P. 1998, ApJL, 506, L69
- Walker et al. (2015) Walker, G. A. H., Bohlender, D. A., Maier, J. P., & Campbell, E. K. 2015, ApJL, 812, L8
- Walker et al. (2016) Walker, G. A. H., Campbell, E. K., Maier, J. P., Bohlender, D., & Malo, L. 2016, ApJ, 831, 130
- Walker et al. (2017) Walker, G. A. H., Campbell, E. K., Maier, J. P., & Bohlender, D. 2017, ApJ, 843, 56
- Zhang & Drabbels (2014) Zhang, X. H., & Drabbels, M. 2014, JPCL, 5, 3100
- Zhen et al. (2014) Zhen, J. F., Castellanos, P., Paardekooper, D. M., Linnartz, H., & Tielens, A. G. G. M. 2014, ApJL, 797, L30