Evolution of Human-like Social Grooming Strategies regarding Richness and Group Size
Masanori Takano1, Genki Ichinose2
1 Akihabara Laboratory, CyberAgent, Inc., Tokyo, Japan
2 Department of Mathematical and Systems Engineering, Shizuoka University, Hamamatsu, 432-8561, Japan
* takano_masanori@cyberagent.co.jp.
Abstract
Human social strategies have evolved as an adaption to behave in complex societies. In such societies, humans intensively tend to cooperate with their closer friends, because they have to distribute their limited resources through cooperation (e.g. time, food, etc.). It also makes the situation difficult to have uniform social relationships (social grooming) with all friends. Thus, the social relationship strengths often show a much skewed distribution (a power law distribution). Here we aim to show adaptivity of such social grooming strategies in order to explore the evolution of human social intelligence. We use a model in the framework of evolutionary games where the social grooming strategies evolve via building social relationships with cooperators. Simulation results demonstrate four evolutionary trends. One of the trends is similar to the strategy that humans use. We find that these trends depend on three parameters; individuals’ richness, group sizes, and the amount of social grooming. The human-like strategy evolves in large poor groups. Moreover, the increase of the amount of social grooming makes the group size larger. Conversely, this implies that the same strategy evolves when the amount of social grooming is properly adjusted even if the group sizes are different. Our results are important in the sense that, between human and non-human primates, the differences of the group size and the amount of social grooming are significant.
1 Introduction
Cooperation is common among humans and it is fundamental to our society [12, 41]. The amount of cooperation by other people is limited because they have to pay costs (e.g., money, time, opportunities, food, etc.) [38, 48]. Therefore, people carefully choose their friends in order to receive intensive cooperation [34, 14, 47].
Actually, people tend to cooperate with close friends. An experimental study using the Donation Game shows that participants tend to cooperate more with closer friends [16]. Another study using the Public Goods Game shows that friend groups are more cooperative with each other than with other groups [15]. Additionally, in a data analysis study dealing with the data set of a social network game, people’s frequent communication increases their cooperative behavior [45, 44].
Thus, it is important that humans have stronger social relationships in greater numbers with cooperators than with others. We define social grooming as the behaviour that constructs social relationships. Primarily, social grooming is the act of cleaning or maintaining the body of a social partner in primates [8, 6, 27]. Social bonding is part of the functional aspect of social grooming. Therefore, human social bonding behavior is also called social grooming [8, 6], as a hypothetical extrapolation of the findings in non-human animals.
The behavior constructing social relationships is not limited to humans but widely observed in primates [23, 22, 8, 6, 27, 45, 44, 43]. In doing so, they face cognitive constraints [9] (e.g. memory and processing capacity) and time constraints (i.e. time costs) in constructing and maintaining social relationships. These time constraints are not negligible, as people spend a fifth of their day in social grooming [5] for maintaining the relationship [18, 37]. Therefore, the strength of existing social relationships exhibits a negative correlation with the total number of social relationships [36, 26].
On the other hand, it is important to select cooperative partners in the evolution of cooperation because cooperators tend to be exploited by defectors [3]. Moreover, direct reciprocity, spatial reciprocity, and network reciprocity, which are the mechanisms for the evolution of cooperation, suggest the necessity of fixed relationships [32, 31]. Therefore, it is reasonable to consider that humans and other social animals tend to cooperate with their close partners [16, 15, 45, 44].
Humans must construct and maintain social relationships within the constraints of this trade-off. We expect that strategies are employed to distribute the limited time resources to maximize benefits from their social relationships [4, 25, 39]. As a result of such strategies, social relationship strengths, as measured by frequency of social grooming [37, 1, 42, 2, 13, 39, 43], may often show a skewed distribution [50, 2] (distributions following a power law [42, 30, 1, 13, 19, 20, 43]). Moreover, it has been demonstrated that social structures of non-human primates [11, 21, 46, 24] are also skewed.
The skewed distributions of the relationships could be generated by a strategy where individuals select social grooming partners in proportion to the strength of their social relationships [30, 43]; known as the Yule–Simon process [49, 40, 28]. Individuals should pay time costs to win the competitions with others by strengthening their social relationships with cooperators, assuming that having strong social relationships is to receive cooperation.
Human societies using these strategies are much larger than those of non-human primates. Based on the social brain hypothesis, human intelligence has evolved to adapt to large societies. Therefore, the evolution of human strategies of social relationship construction may explain the origin of human intelligence. However, evolutionary stability of the strategies, i.e. the Yule–Simon process, is still open investigation.
In this paper, we aim to show the adaptivity of the social grooming strategies in order to explore the evolution of human social intelligence predicted by the social brain hypothesis. Especially, we focus on how environments drive the evolution of a social grooming strategy that humans use in their daily life. The evolution should depend on group size and the amount of resources for cooperation. For this purpose, we simulate the evolution of the strategy to receive cooperation from others with different environmental conditions for cooperations. We show that strategies evolve depending on the strength of social relationships.
2 Methods
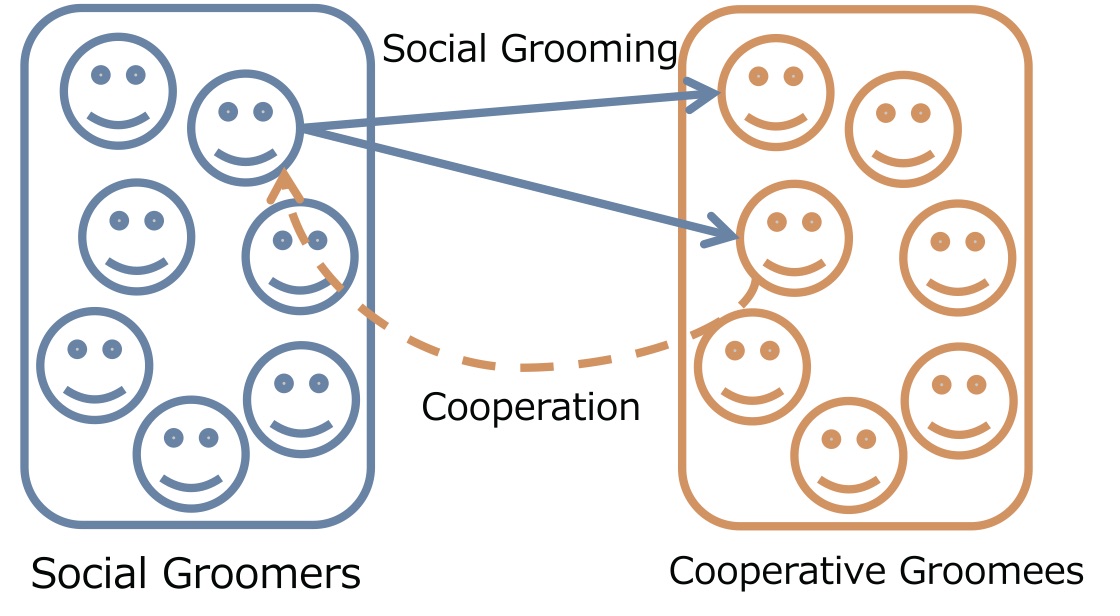
We expand the model of [43] to an evolutionary game. They consider two types of individuals; social groomers and cooperative groomees (Fig. 1) [43]. In the real world, individuals are groomers and groomees, simultaneously. For simplicity, they use this classification to focus on the social grooming strategies for social structures. In this paper, we focus on the evolution of social grooming strategies. While the evolutionary dynamics of cooperation are well known [29, 32, 35, 31], there are few study on the evolutionary dynamics of social grooming. Groomers construct their social relationships with groomees depending on their social grooming strategies in a “grooming stage.” Cooperative groomees cooperate with groomers depending on social relationship strengths in a “cooperation stage.” Groomer strategies evolve based on their fitness which is the amount of cooperation from groomees in each generation. Groomees’ cooperation strategies are static.
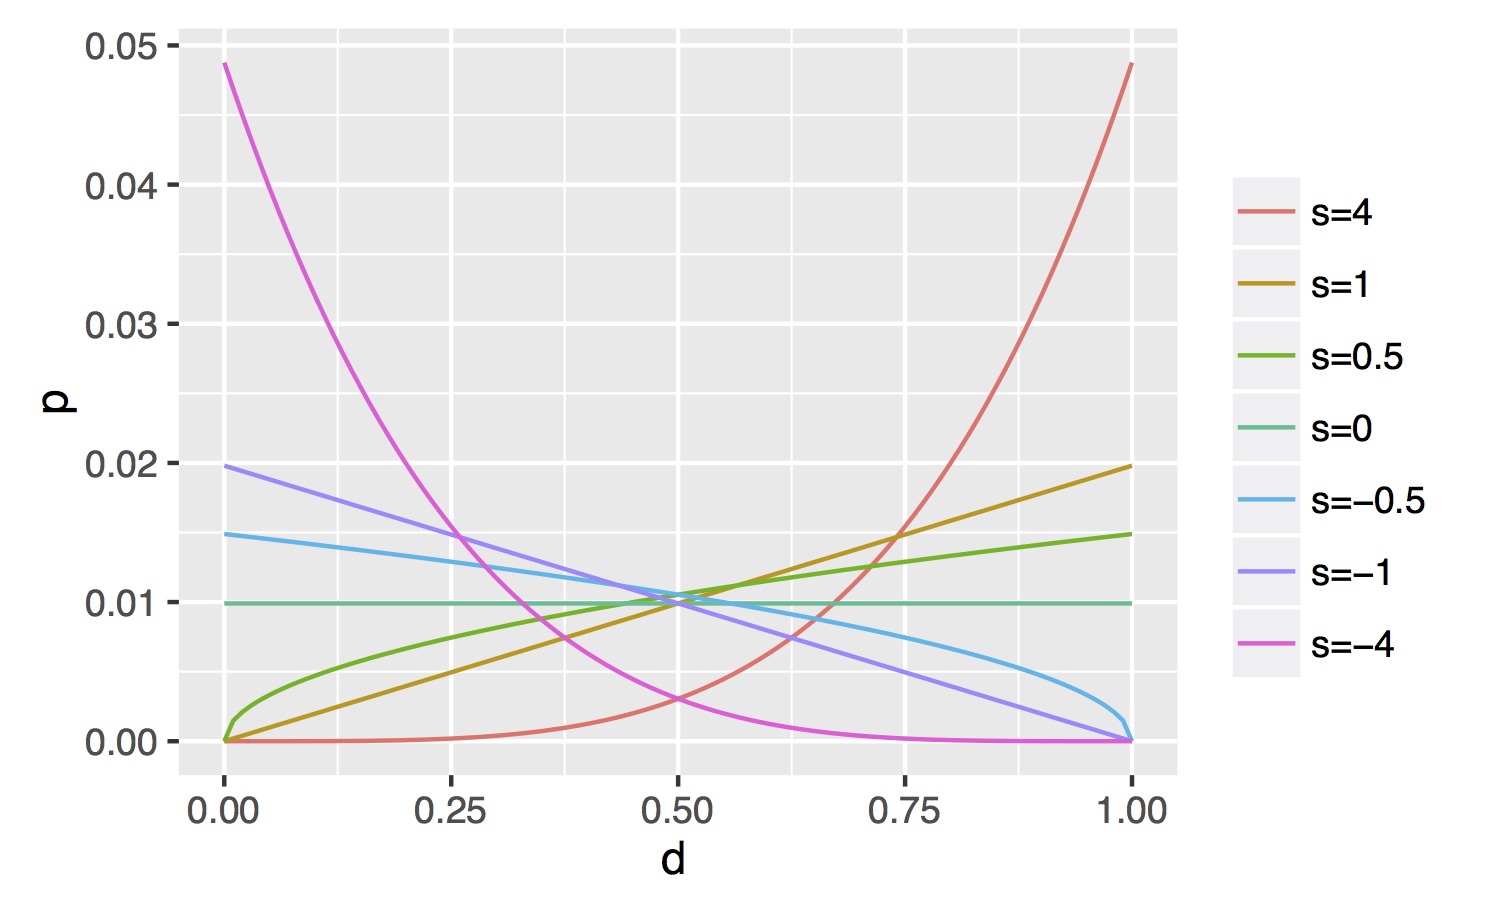
In a grooming stage, groomer repeatedly interacts with cooperative groomees times depending on their social grooming strategy . is a ratio that constructs a new social relationship with a stranger, new groomee , and is a parameter of a probabilistic function which selects existing social grooming partner depending on (). We used the following function (Fig. 2) as a simple function to express various strategies depending on including concentrated investment to strong relationships (), diversified investment to weak relationships (), at random (), and the Yule–Simon process (; i.e. human-like strategy).
| (1) |
where when while when . is , where shows strength of social relationships, i.e., the number of social grooming from to . This function only depends on , because previous studies have revealed that people select their social grooming partners depending on the strength of social relationships [30, 43]. Therefore, this function can simply represent human-like social grooming strategies. is the number of groomees. is a normalized beta distribution , where is a beta function.
In a cooperation stage, groomee cooperates with groomers in the top as ranked by . The total payoff (i.e. fitness) of each groomer is the number of cooperation (i.e. the number of times ranked in the top of each cooperator). That is, cooperators cooperate in their close relationships according to their resources . shows all resources in the environment , i.e. the total amount of cooperation.
The next generation is generated by sampling with replacement in proportion to the groomers’ fitness, i.e. the roulette wheel selection. In each generation, mutates by the Gaussian distribution () and mutates by the Gaussian distribution (), where is a mean and is a standard deviation of the distribution, where (if is out of range by mutation, then it is set to the nearest value in or ). Groomers’ and in an initial generation are set by the Gaussian distribution () and by uniform distribution , respectively. Cooperators do not evolve.
We conducted evolutionary simulations 30 times on each and by using this model (, ). The number of groomers is , the number of social grooming actions in each grooming stage is (we also use in experiments), and the number of generation is . The source code is available at “https://doi.org/10.6084/m9.figshare.5526850.v1”.
3 Results
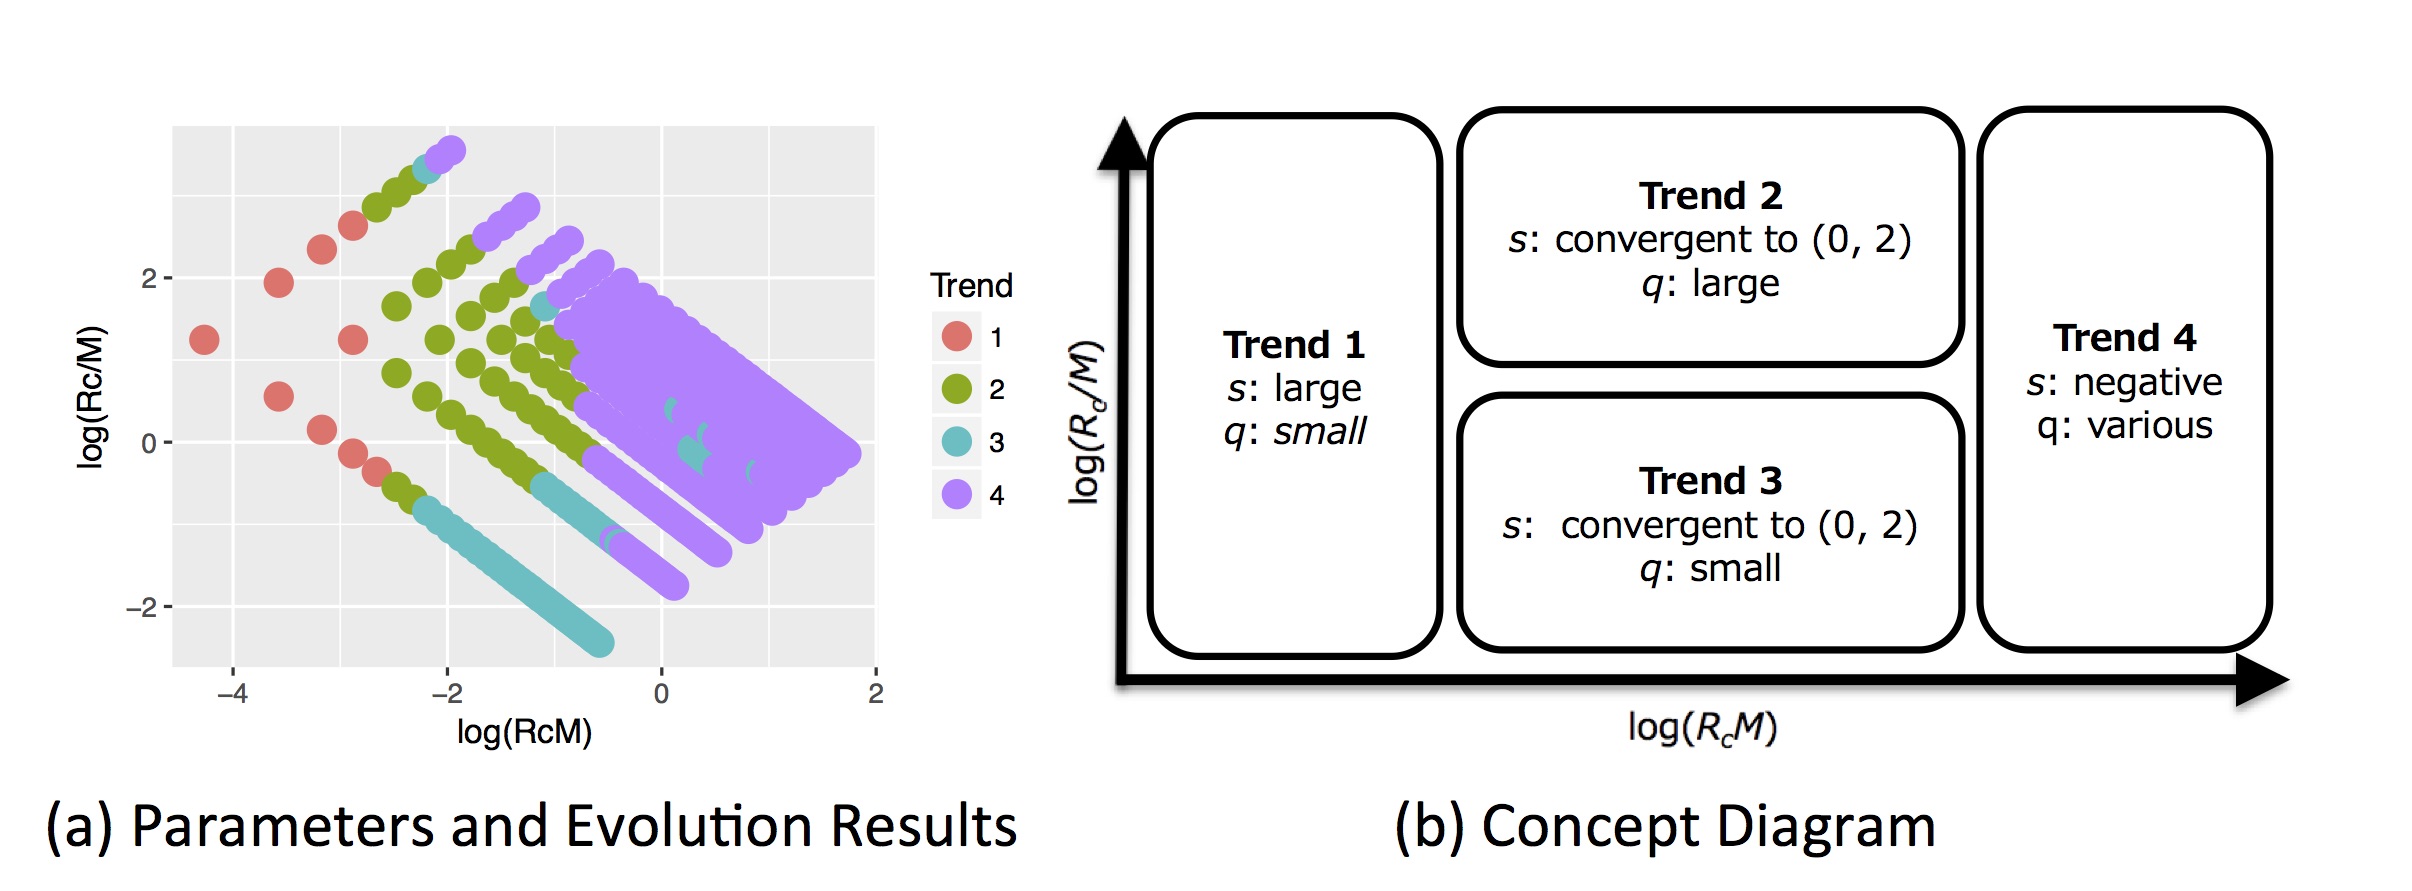
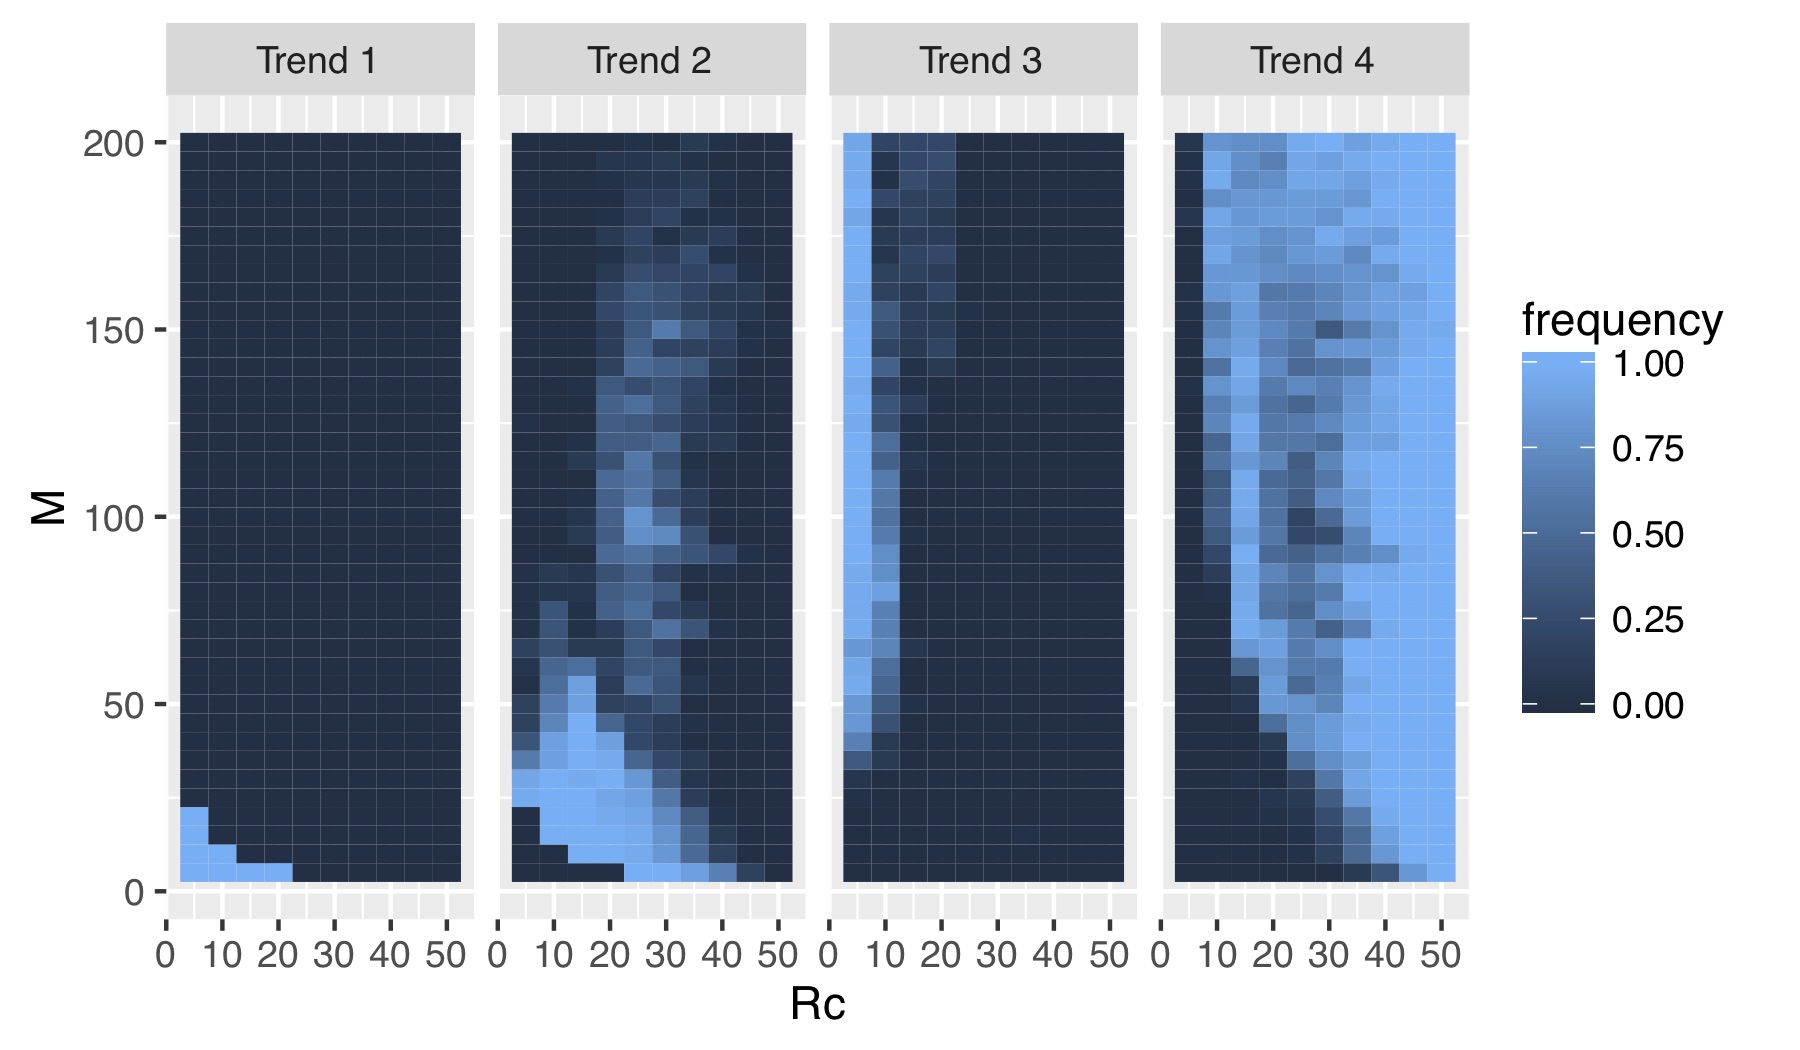
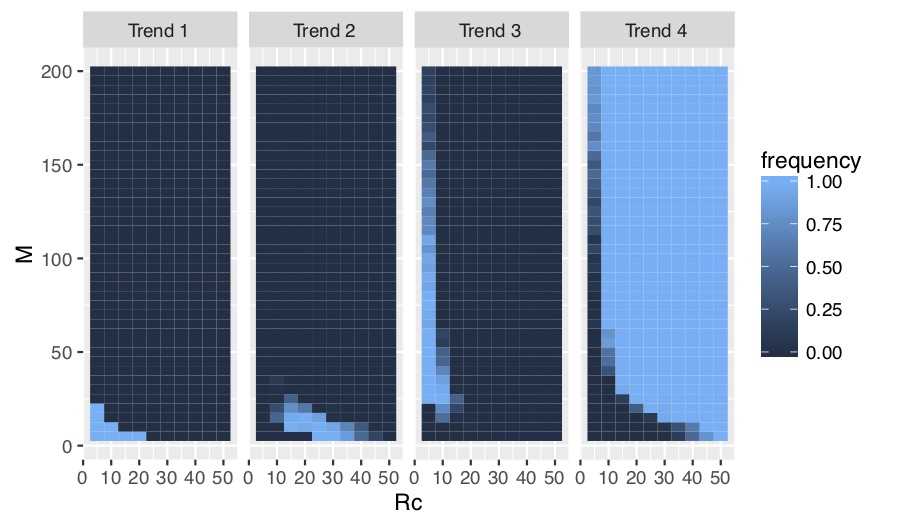
We found four evolutionary trends in the results of the simulations (Fig. 3). These trends are explained by total resources and the ratios of each cooperator’s resources to the number of cooperators (Fig. 4, 5).
Groomers evolved to trend 1 when was small. Their evolved larger and their evolved smaller. This strategy concentrates investment into strong social relationships (e.g. in Fig. 2). Groomers tended to evolve to trend 4 when was large with . This strategy widely invests in many weak social relationships (e.g. in Fig. 2). These trends’ do not converge, meaning that they do not have characteristic values.
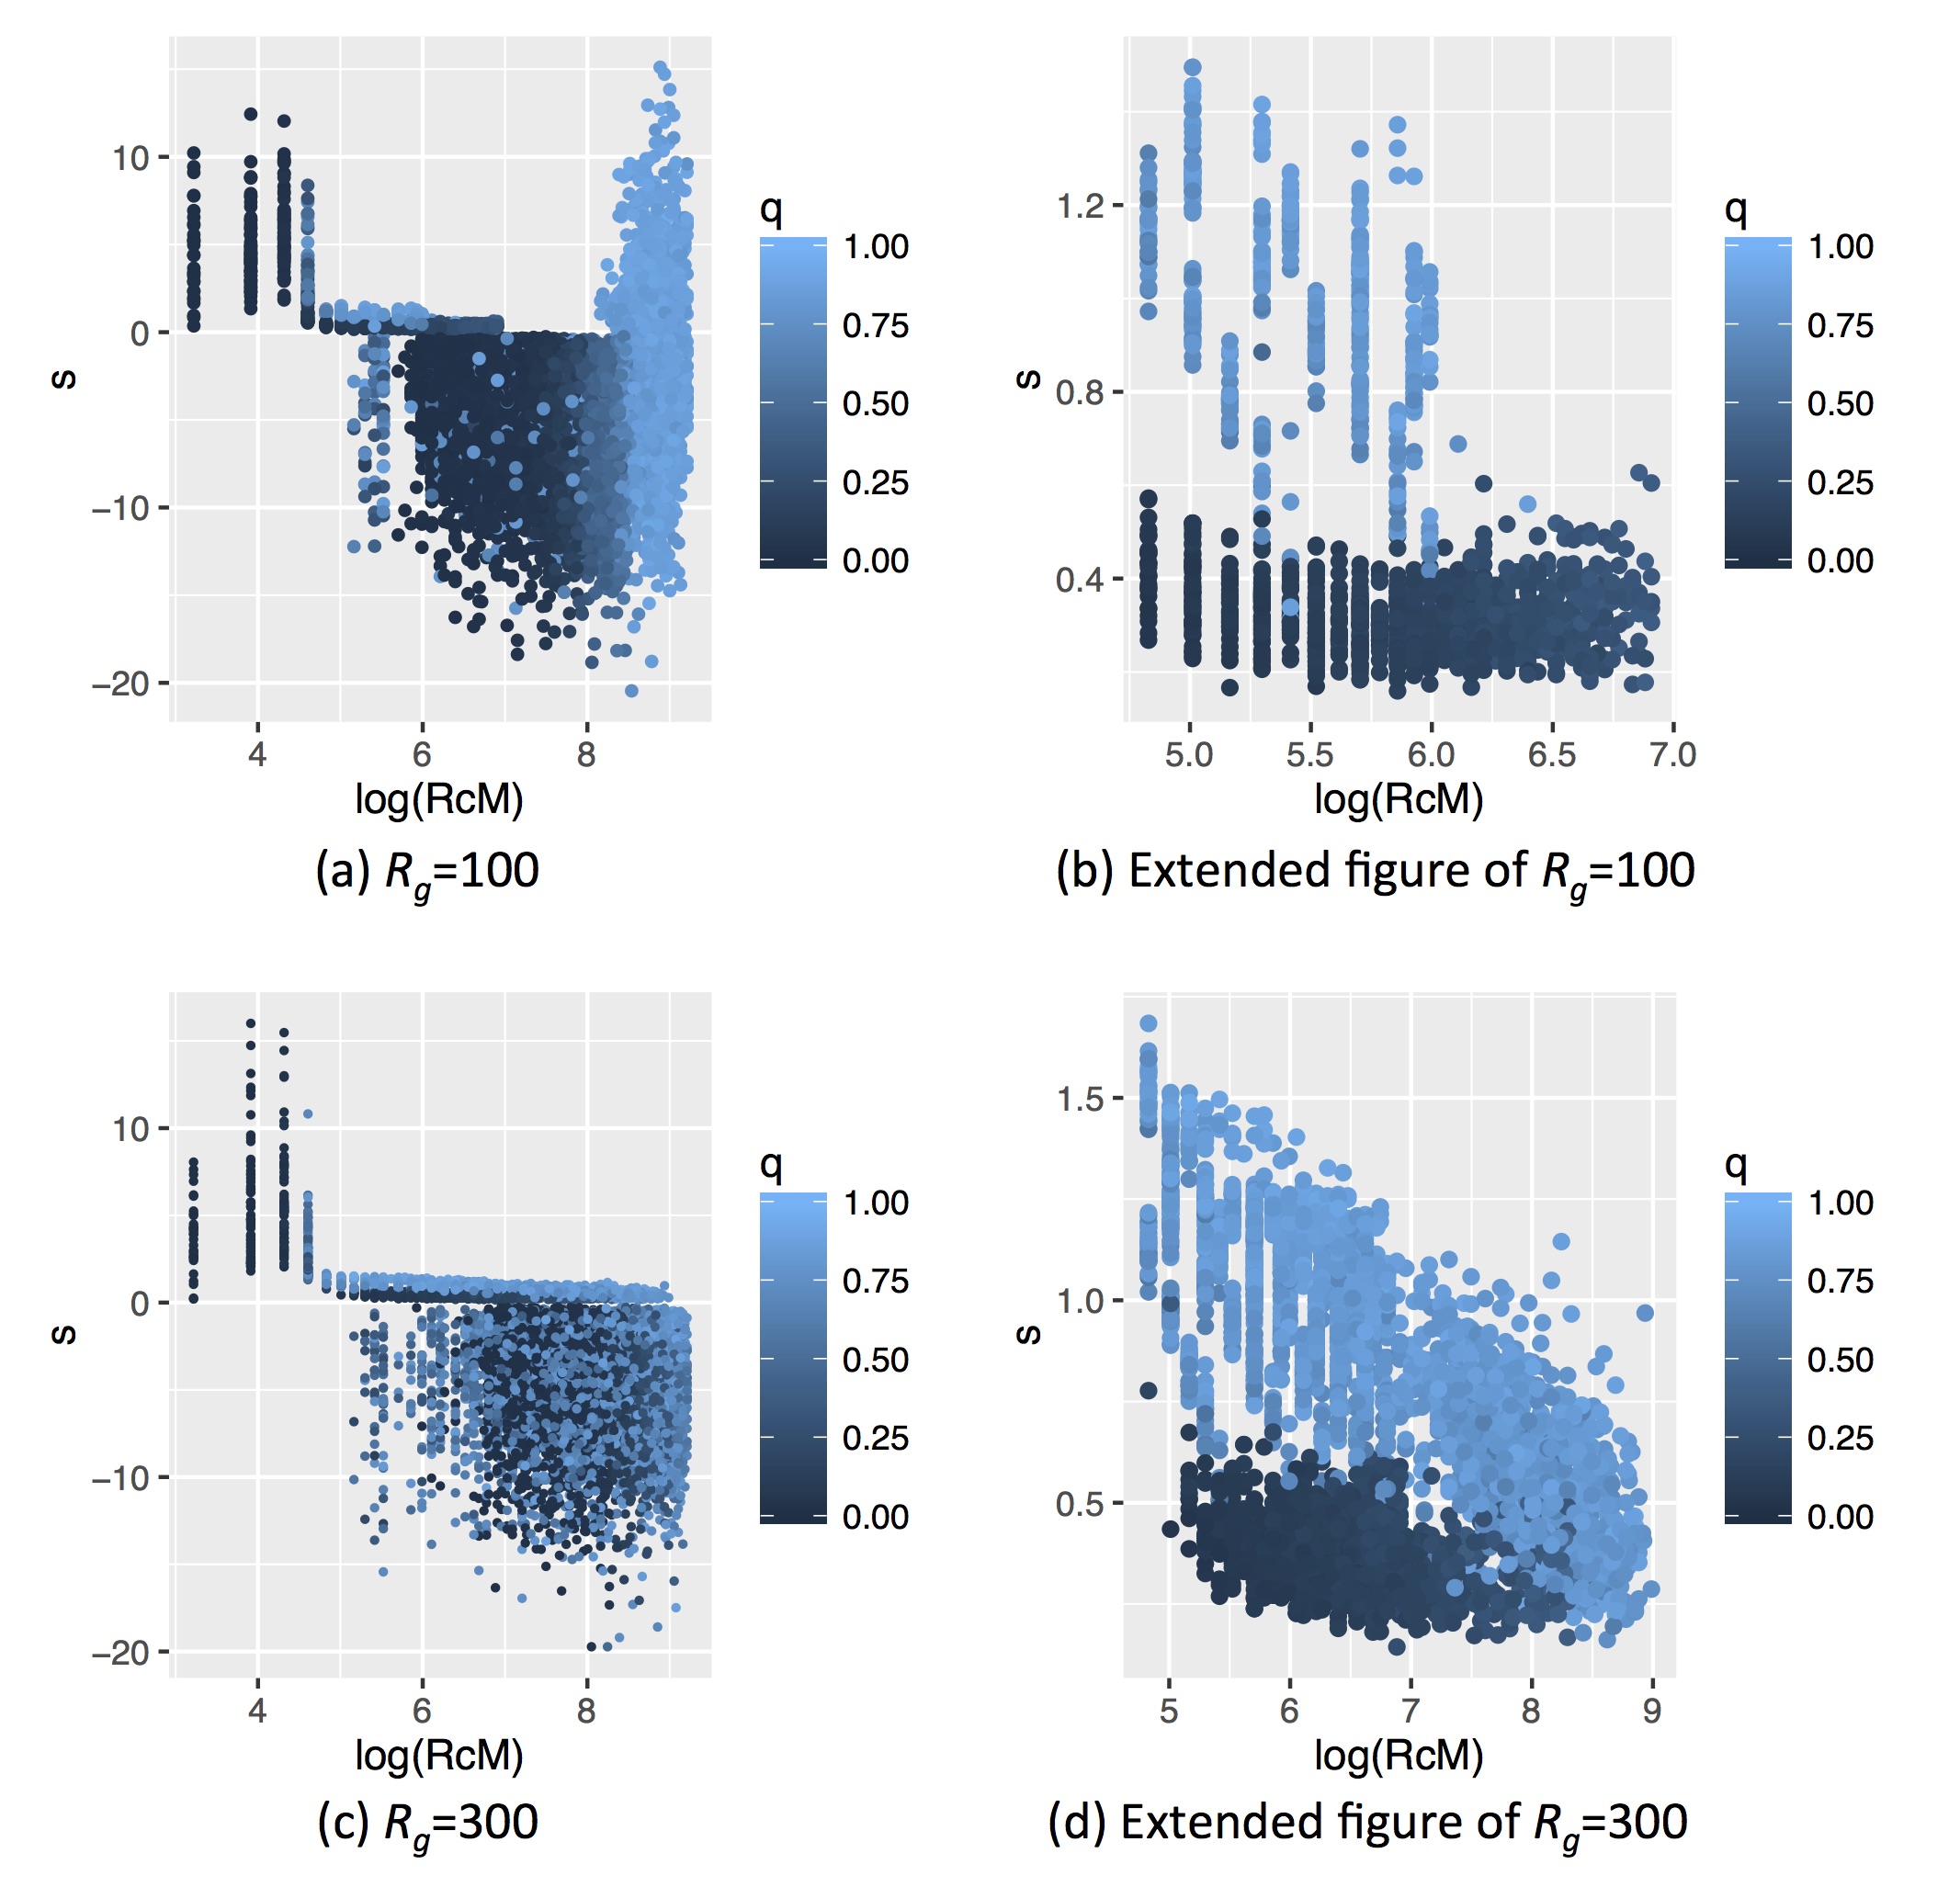
On the other hand, converged to in trends 2 and 3. Trends 2 and 3 evolved in the intermediate range between trend 1 and 4, and determined whether groomers evolved to trend 2 or 3. Groomers evolved to trend 2 when was large, where evolved larger. They evolved to trend 3 when was small, where evolved smaller. in trend 2 tends to be larger than in trend 3. Both strategies are diversified investments (e.g. and in Fig. 2), where groomers intensively invest in strong social relationships while also widely investing in weak social relationships. Additionally, , where groomers evolved to trends 2 and 3 is larger, when is large (see Fig. 4).
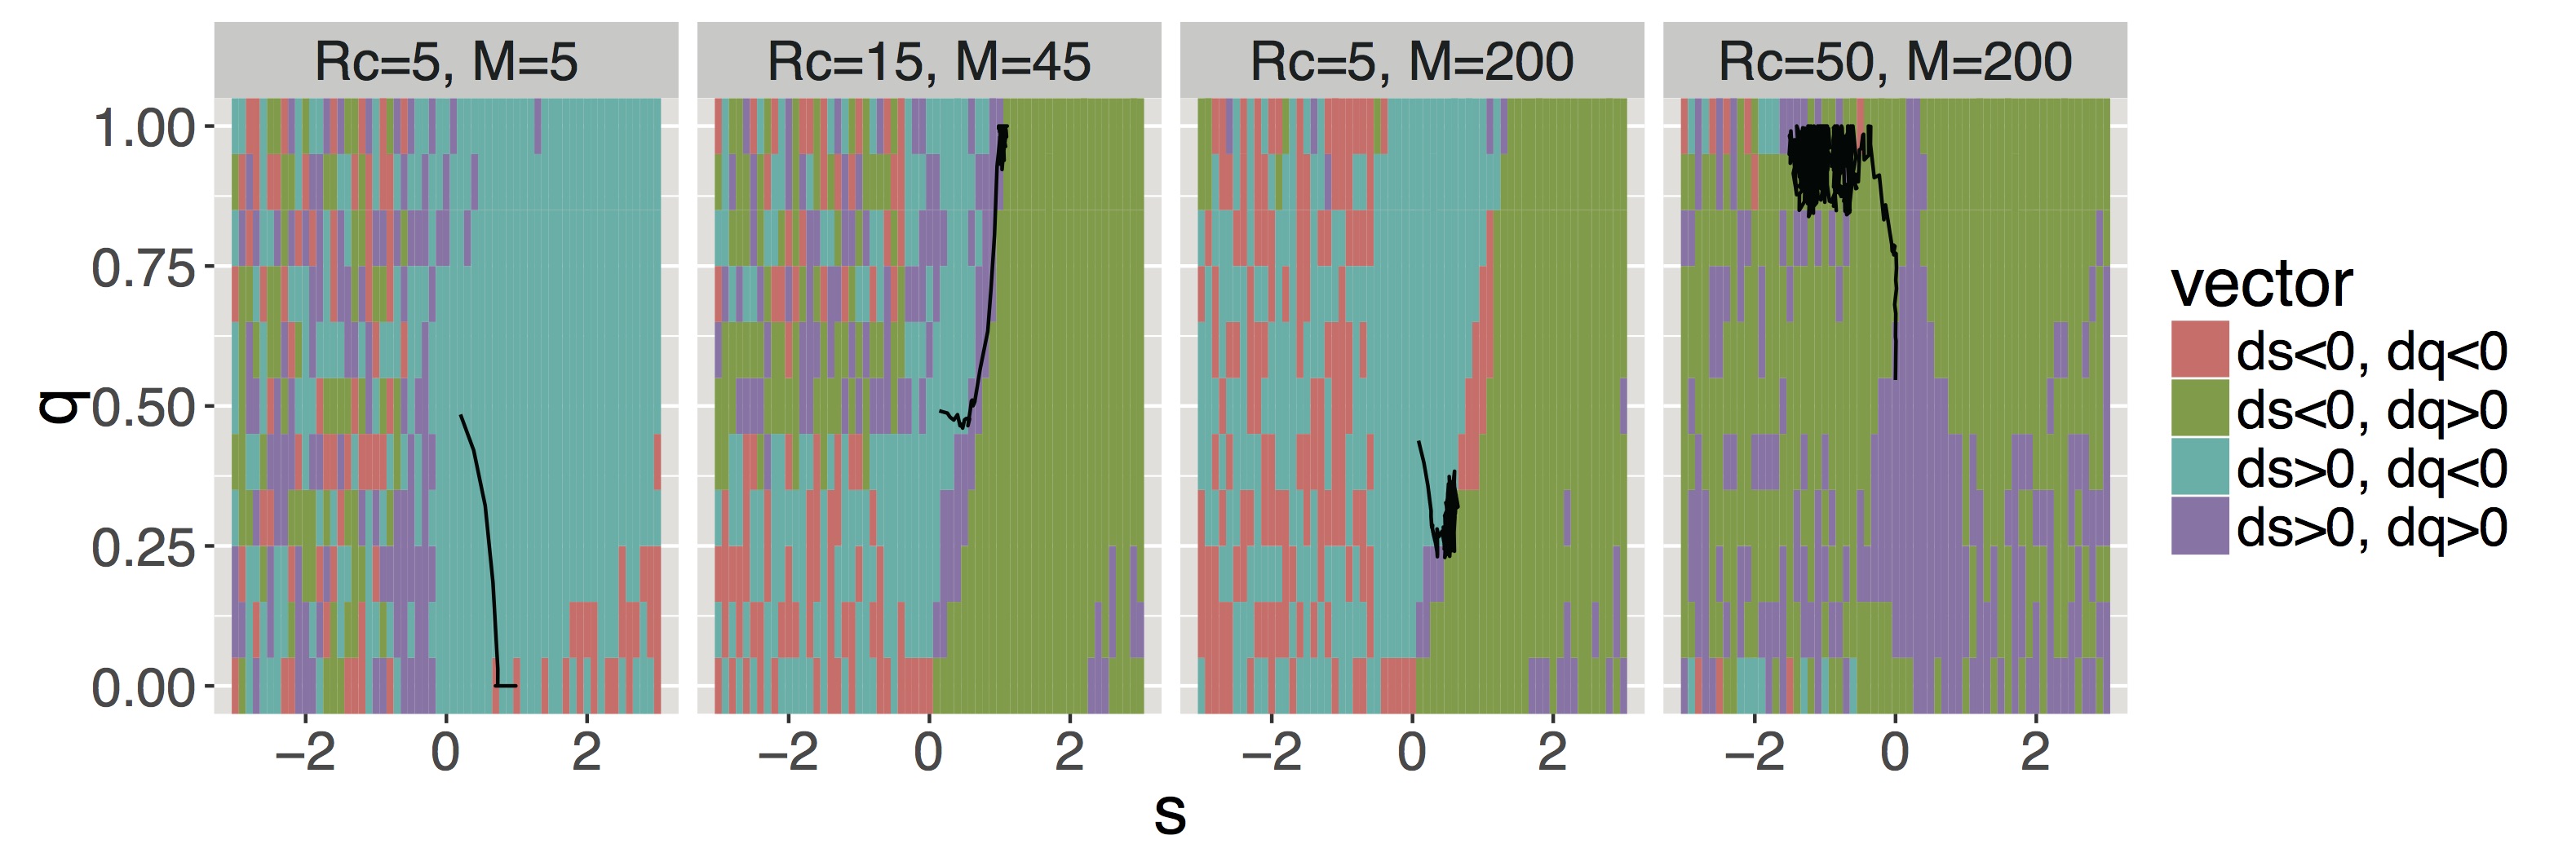
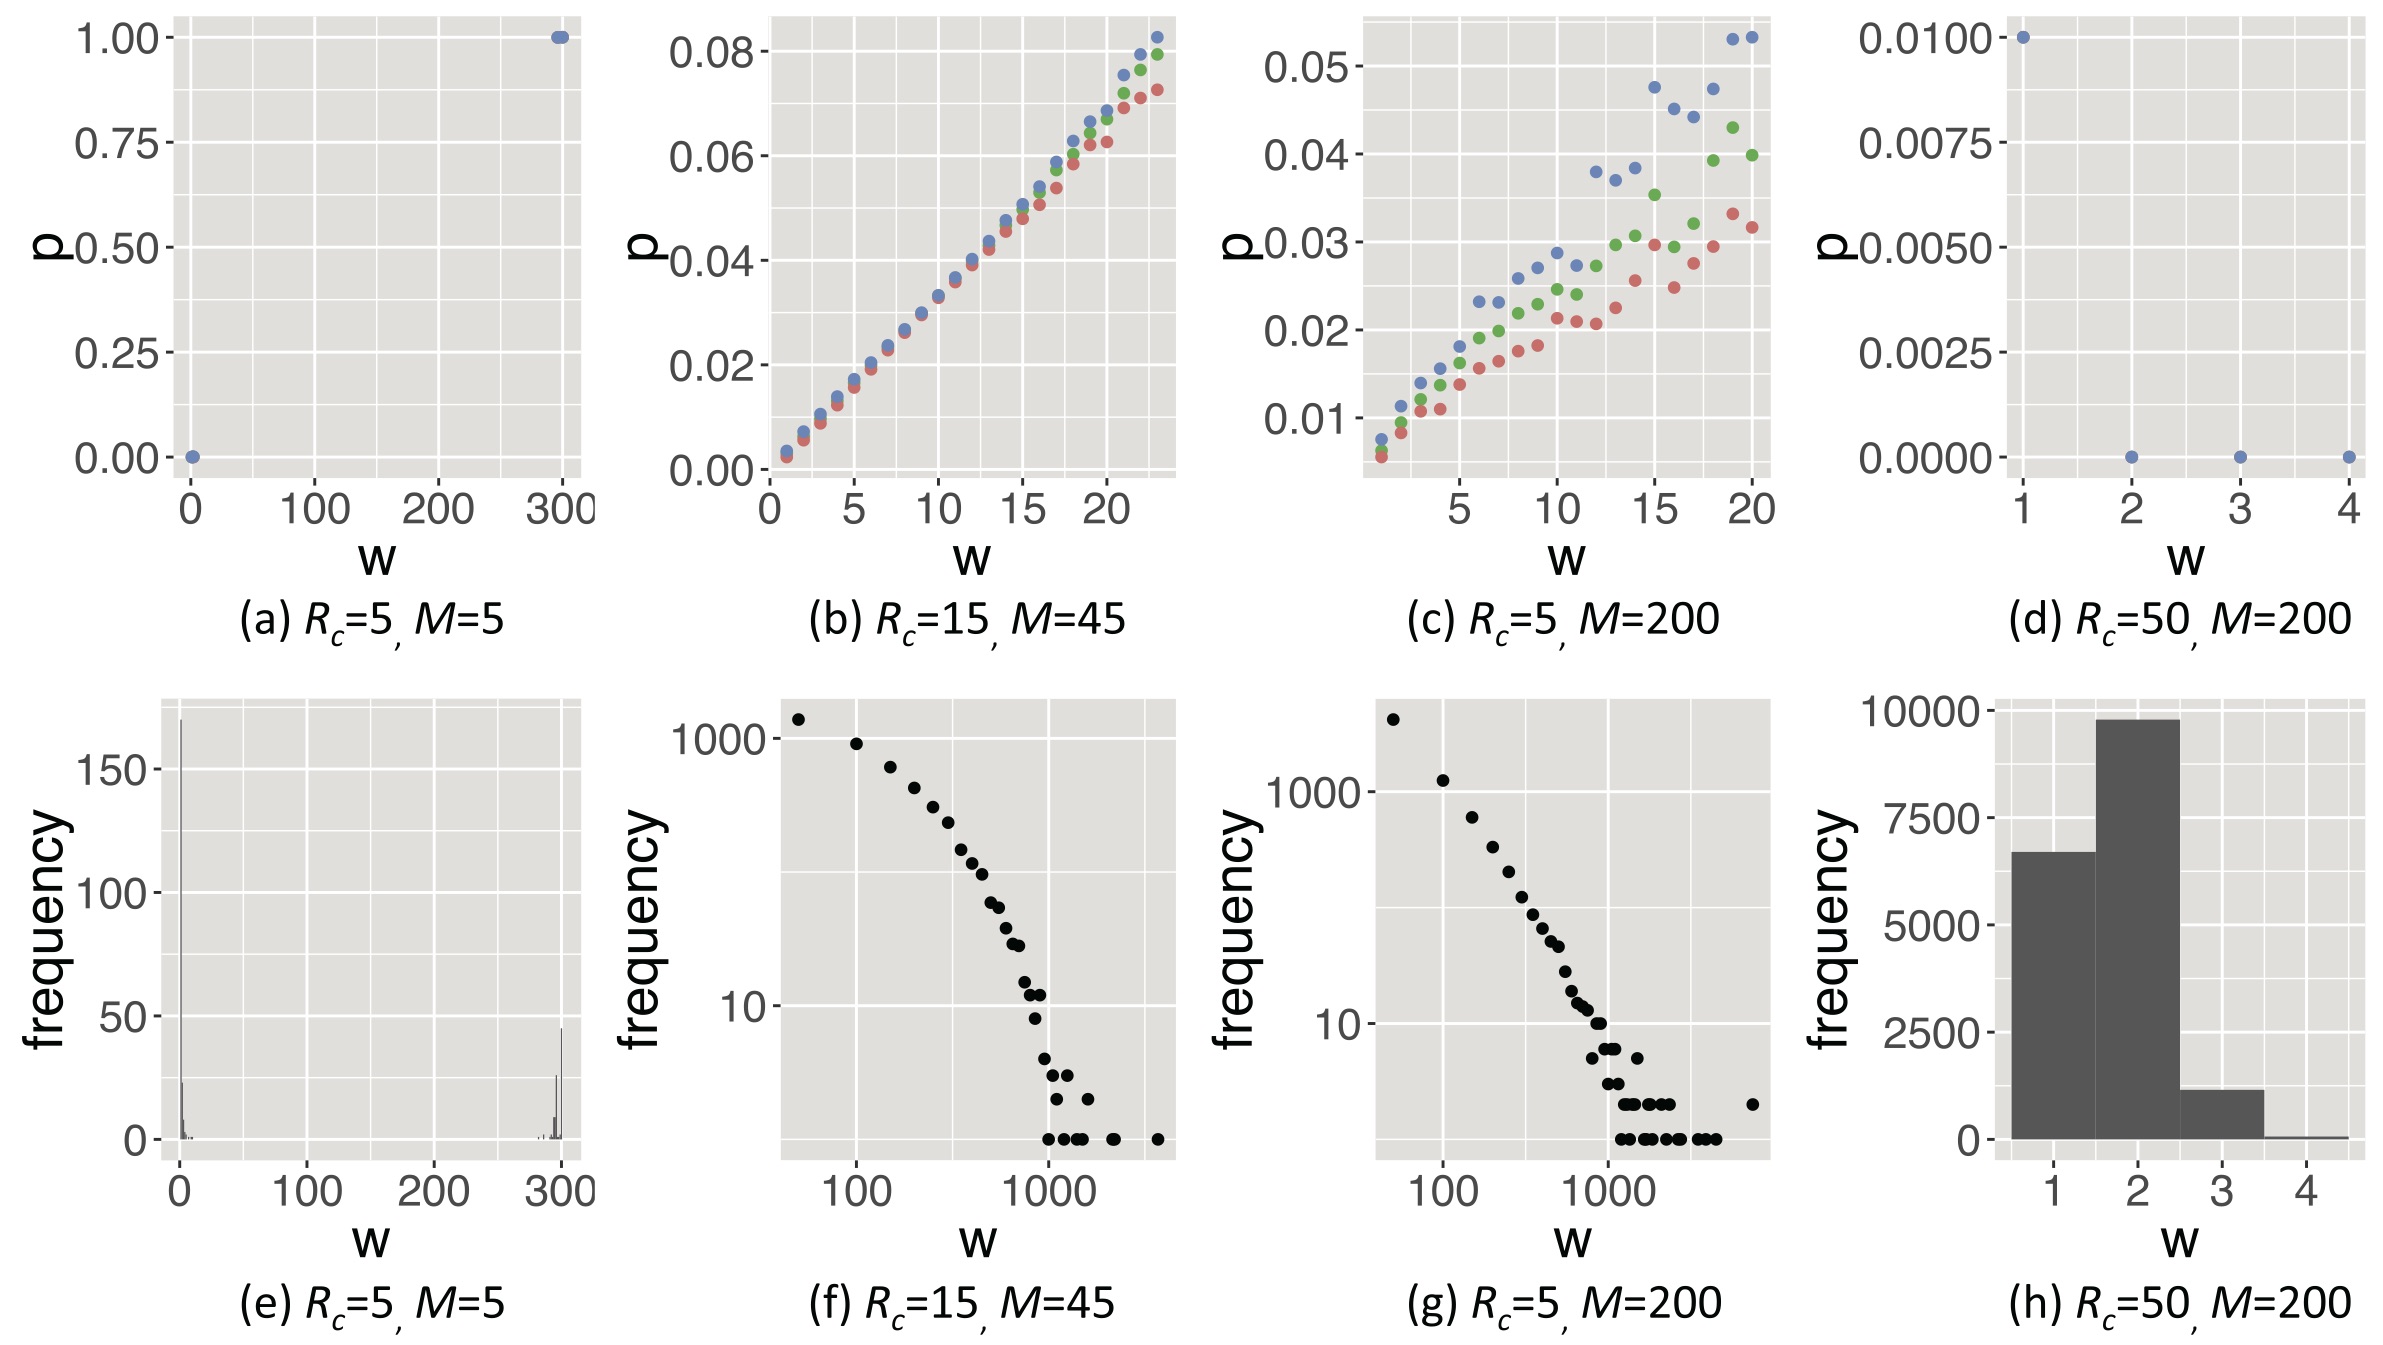
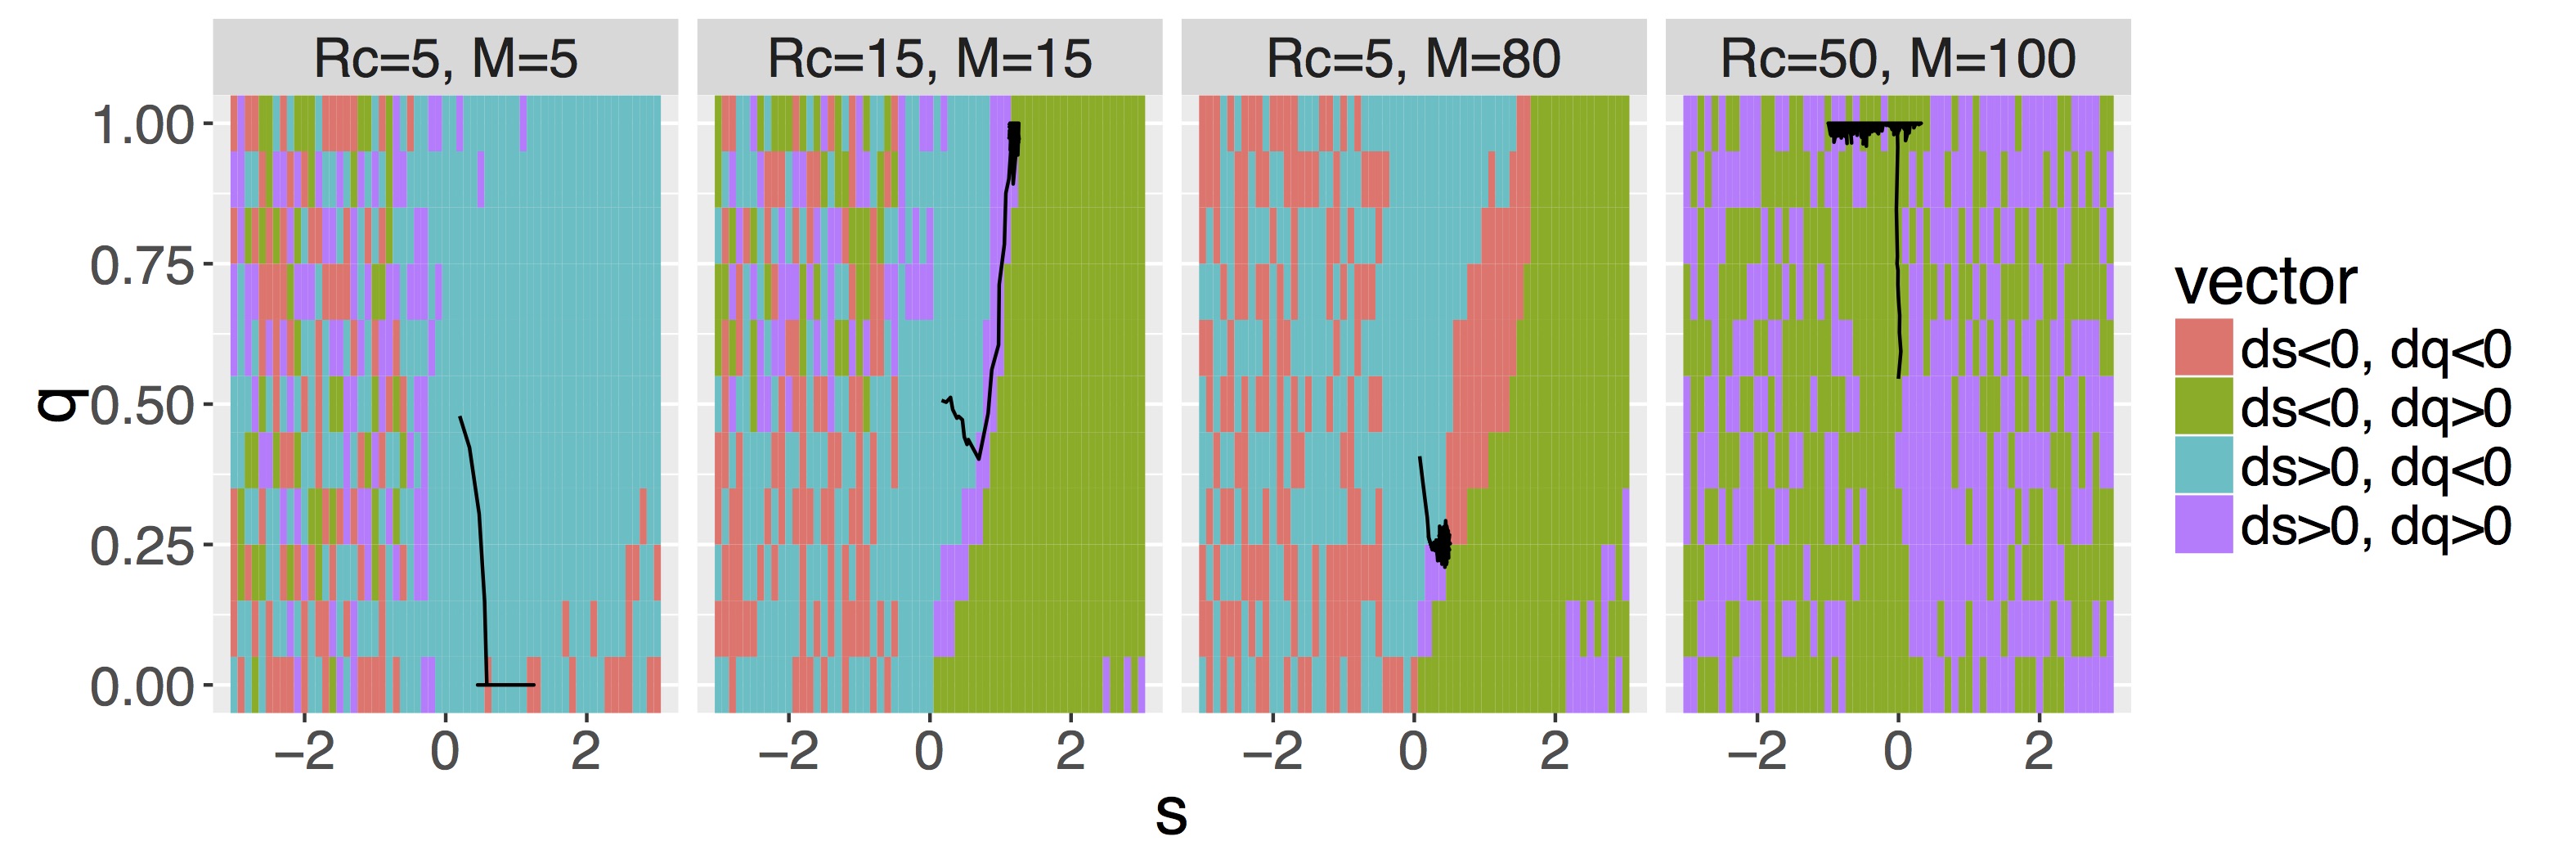
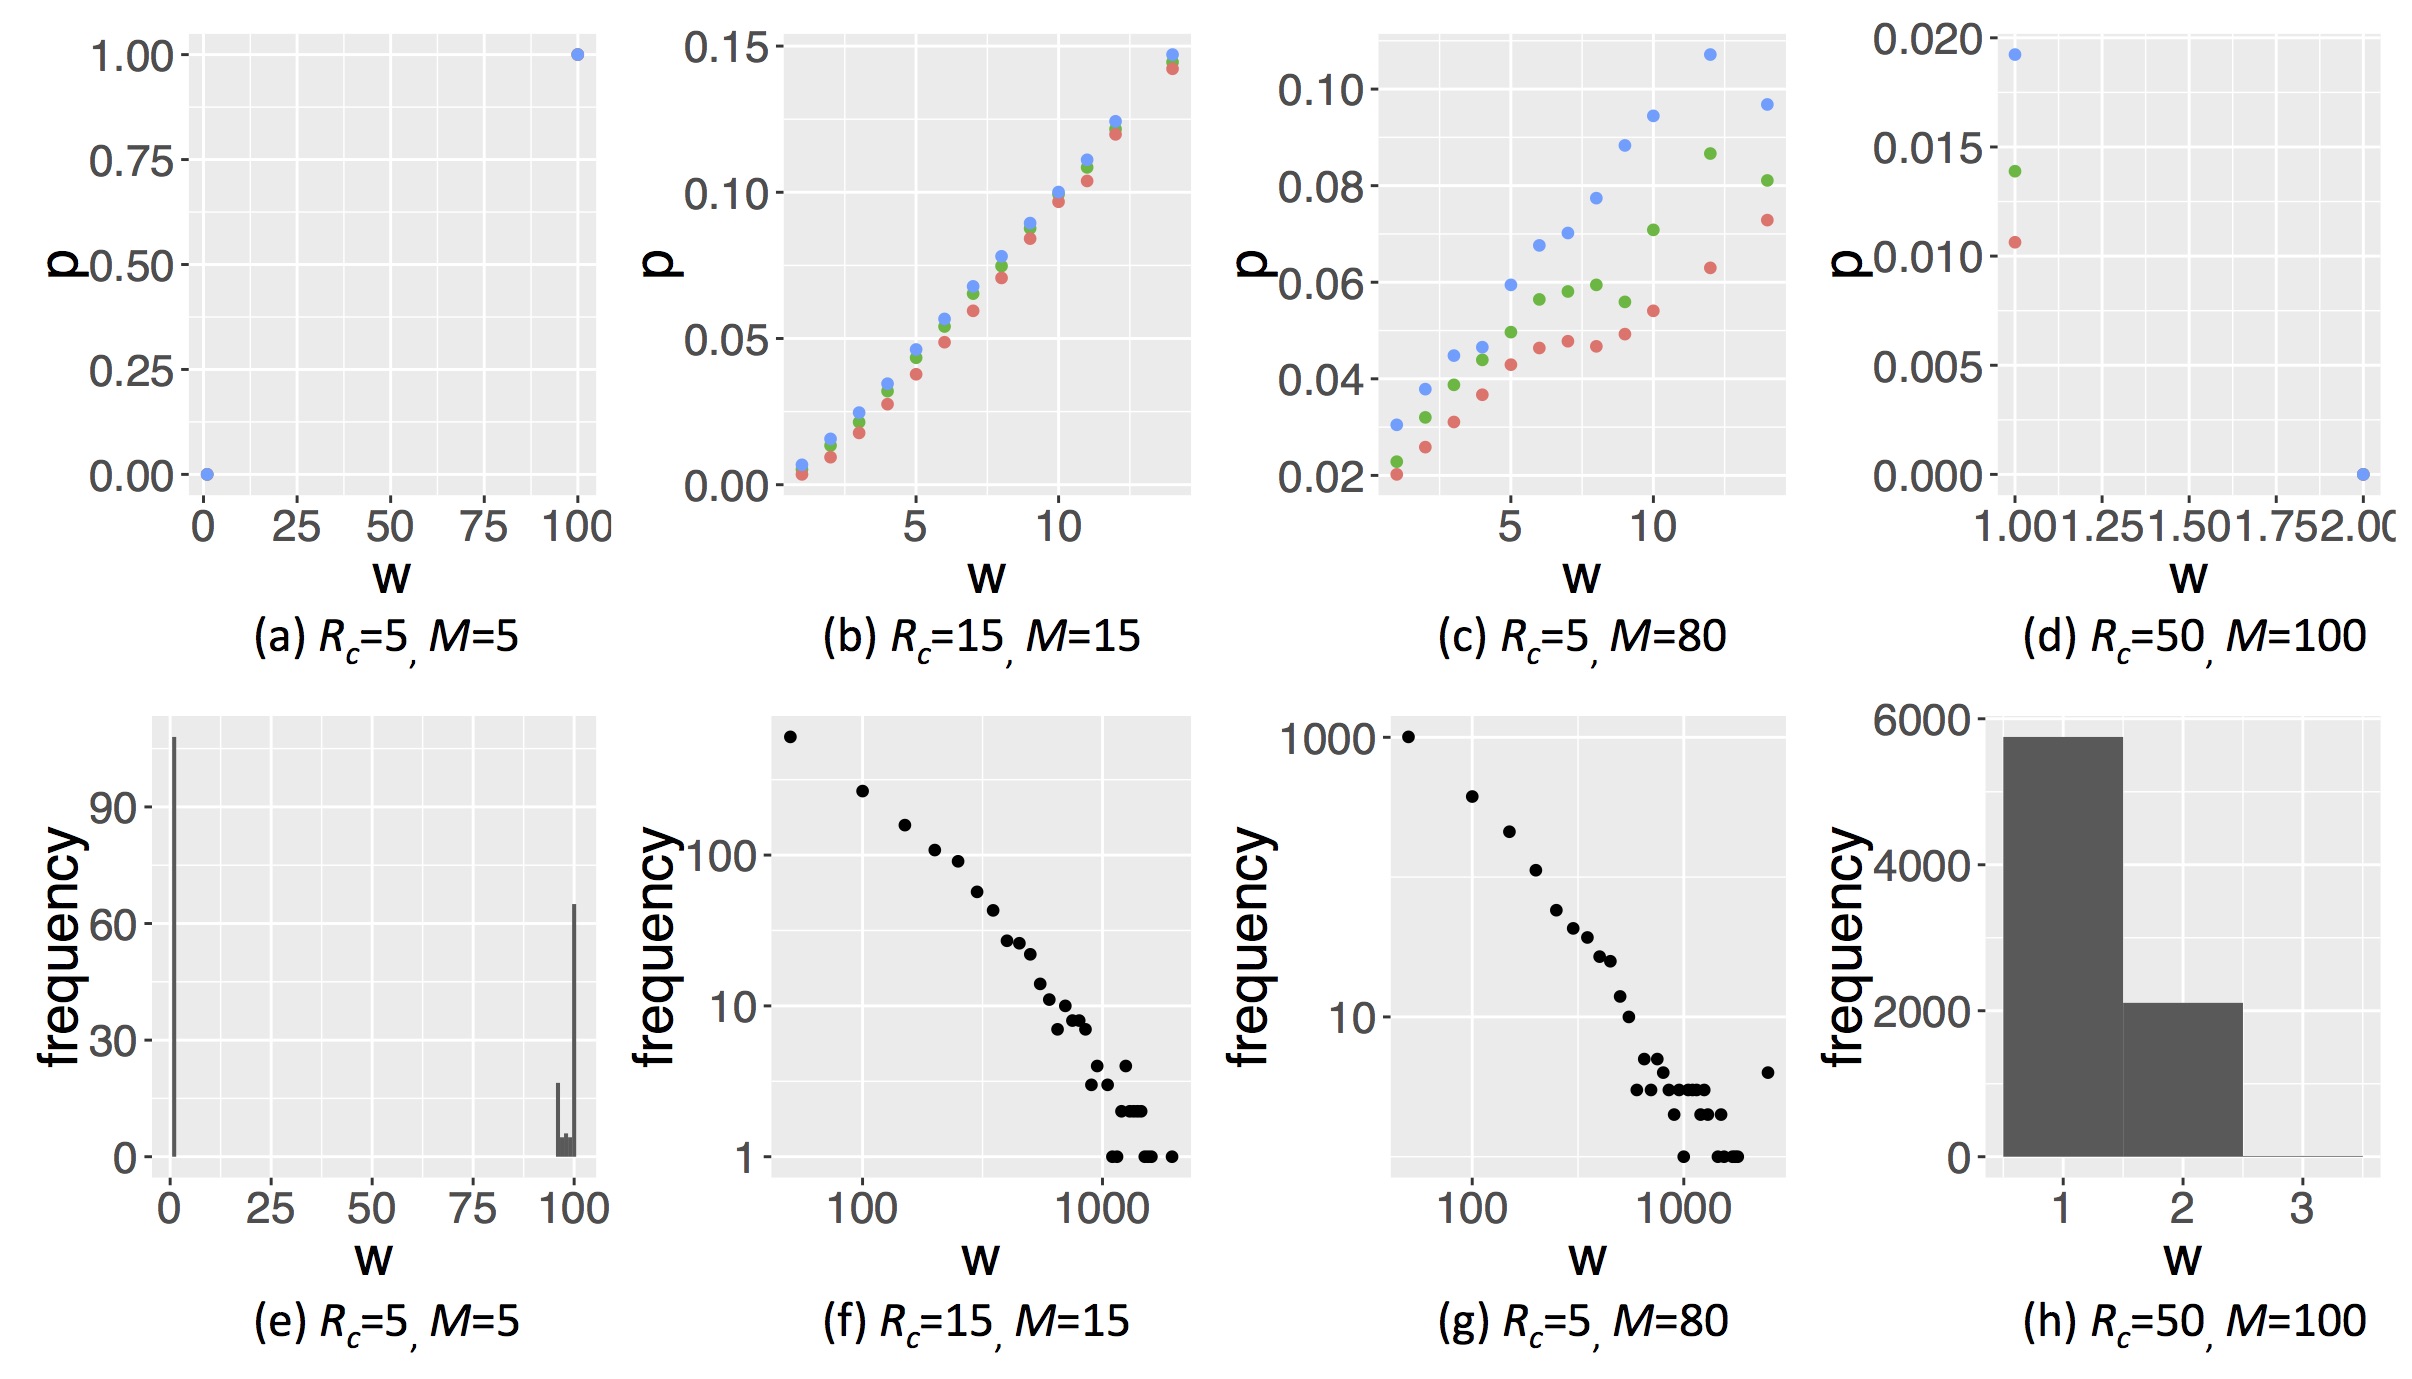
Next, we demonstrate how the four trends emerged throughout the evolution and how groomers constructed social structures in each trend. Regarding the former, Fig. 6, 7 shows the evolutionary pressures of each combination of and , and the typical orbits of evolution. For the latter, Fig. 8, 9 shows strategies of social grooming (a-d) and social structures of each trend, i.e. distributions of (e-h).
Trend 1 evolved in environments with small . Groomers are in intense competition for receiving cooperation from groomees in the environments. Therefore, they evolved to concentrate investments to a few poor groomees, i.e. large and small ( in Figs 6 and 8a). The results show that they only had very strong social relationships in environments with small (Fig. 8e).
Trend 4 evolved in environments with large . Groomers easily receive cooperation from groomees in these environments. Thus, they constructed many weak social relationships with many rich cooperators ( in Fig. 6 and Figs 8d and 8h)
Trends 2 and 3 evolved between trend 1 and trend 4. Their converge to , this means groomers with these strategies intensively invest in strong social relationships while they also widely invest in weak social relationships ( and in Fig. 6). Their social grooming probability is in proportion to each strength of the social relationships (Figs 8b and 8c), so their construction processes of social relationships are similar to the Yule–Simon process. As a result, their social structures were similar to power law distributions (Figs 8f and 8g).
The main difference between trends 2 and 3 is how is affected by . When is small, groomers have to confine the number of social relationships with groomees to construct strong social relationships, because they compete intensively in each social relationship (i.e. small ). Therefore, they evolved to small with small (trend 3; in Fig. 6). In contrast, when is large, they do not have to restrict the number of social relationships with groomees, because their competition is not intense in each social relationship (i.e. large ) and the maximum number of their social relationships is small (i.e. small ). Thus, they evolved to large with large (trend 2; in Fig. 6). Interestingly, these trends of evolution show non-continuous transition (see Fig. 10).
4 Discussion
We analyzed the evolutionary dynamics of social grooming strategies and social structures. As a result, we find that the evolutionary dynamics depend on total resources (i.e. ) and the ratios of each cooperator’s resources to the number of cooperators (i.e. ). In the poor small groups, individuals’ strategies evolved to concentrate investment among strong social relationships. In the rich large groups, their strategies evolved to wide investment among many weak social relationships. In the middle groups, their strategies evolved according to the Yule–Simon process. These strategies invest intensively in strong social relationships while also investing widely in weak social relationships. As a result of these strategies, skewed distributions of social relationship strengths were generated.
There are two trend strategies which are similar to the Yule–Simon process [30, 43]. One evolved in relatively rich and small groups in the middle groups. Individuals with this strategy constructed social relationships with all group members, and reinforced their relationships in proportion to the strength of social relationships. The other one evolved in relatively poor and large groups in the middle groups. Individuals with this strategy constructed social relationships with parts of their groups, and reinforced their relationships. In primitive human groups, individuals belong to large groups and interact in small cliques within them [11]. Hence, humans’ social grooming strategy may have evolved in the latter group. Non-human primates may also have similar strategies, because they also construct skewed social structures even though their group sizes are different from humans [21, 11, 46, 24]. Their strategies’ similarity may be explained by the difference of the amount of social grooming . Our experiments show the increase in the amount of social grooming results in the increase of group sizes , in which social grooming strategies evolve according to the Yule–Simon process (see Fig. 4). The same social grooming strategies are stable in different group sizes. Actually, there is a positive correlation between group sizes and the amount of social grooming in primates [7, 10].
If a social grooming strategy based on the Yule–Simon process is universal in primates not limited to humans, and group sizes depend on external factors (e.g., predators, food, etc.), then social grooming strategies of humans and non-human primates evolved to the same strategies by automatically adjusting their amount of social grooming. This relationship between group sizes and strategies may be clearly demonstrated by comparison among humans, non-human primates, and other social animals. This will contribute towards an explanation of the evolution of humans’ large social groups.
It is also important how cooperators select other cooperators as their interaction partners [17]. For example, if cooperators maintain relationships with other cooperators and break relationships with exploiters, their reciprocal relationships will be maintained and their inegalitarian relationships will be broken [32, 31]. This mechanism to keep cooperation is known as network reciprocity. Social grooming strategies are network construction strategies. Actually, social grooming has a beneficial effect on the construction of reciprocal relationships [45, 44]. Our results suggest that the evolution of human-like strategies for network construction depends on the resources of environments and their group size. In this paper, we focused on the evolutionary dynamics of social grooming with stable cooperative behavior. The co-evolutionary dynamics of both behaviors is an issue to be addressed in the future.
Comparison among various species’ data sets will be needed in order to clear the relationships between environments and the four evolutionary scenarios of social grooming strategies.
Conflict of Interest Statement
Masanori Takano is an employee of CyberAgent, Inc. There are no patents, products in development or marketed products to declare.
Author Contributions
M.T. designed the research. M.T. constructed the model. M.T. performed the simulation. M.T. and G.I. discussed and analyzed the results. M.T. and G.I. wrote the main manuscript text. All authors reviewed the manuscript.
References
- [1] Arnaboldi, V., Conti, M., Passarella, A., and Pezzoni, F. (2012). Analysis of Ego Network Structure in Online Social Networks. In 2012 International Conference on Privacy, Security, Risk and Trust and 2012 International Confernece on Social Computing (IEEE), 31–40.
- [2] Arnaboldi, V., Conti, M., Passarella, A., and Pezzoni, F. (2013). Ego Networks in Twitter: An Experimental Analysis. In 2013 Proceedings IEEE INFOCOM (IEEE), 3459–3464.
- [3] Axelrod, R. (2006). The Evolution of Cooperation: Revised Edition (Basic Books)
- [4] Brown, S. L. and Brown, R. M. (2006). TARGET ARTICLE: Selective Investment Theory: Recasting the Functional Significance of Close Relationships. Psychological Inquiry 17, 1–29.
- [5] Dunbar, R. (1998). Theory of Mind and the Evolution of Language. In Approaches to the Evolution of Language: Social and Cognitive Bases (Cambridge University Press), chap. 6. 92—-110
- [6] Dunbar, R. (2000). On the Origin of the Human Mind. In Evolution and the Human Mind, eds. P. Carruthers and A. Chamberlain (Cambridge University Press). 238–253
- [7] Dunbar, R. I. (1993). Coevolution of Neocortical Size, Group Size and Language in Humans. Behavioral and Brain Sciences 16, 681.
- [8] Dunbar, R. I. (2004). Gossip in Evolutionary Perspective. Review of General Psychology 8, 100–110.
- [9] Dunbar, R. I. (2012). Social Cognition on the Internet: Testing Constraints on Social Network Size. Philosophical transactions of the Royal Society of London. Series B, Biological sciences 367, 2192–201.
- [10] Dunbar, R. I. (2016). Human Evolution: Our Brains and Behavior (Oxford University Press)
- [11] Dunbar, R. I. M. (2012). Bridging the Bonding Gap: the Transition from Primates to Humans. Philosophical Transactions of the Royal Society of London B: Biological Sciences 367, 1837–1846
- [12] Fehr, E. and Fischbacher, U. (2003). The Nature of Human Altruism. Nature 425, 785–791
- [13] Fujihara, A. and Miwa, H. (2014). Homesick Lévy Walk: A Mobility Model Having Ichi-Go Ichi-e and Scale-Free Properties of Human Encounters. In 2014 IEEE 38th Annual Computer Software and Applications Conference (IEEE), 576–583.
- [14] Grujić, J., Röhl, T., Semmann, D., Milinski, M., and Traulsen, A. (2012). Consistent Strategy Updating in Spatial and Non-Spatial Behavioral Experiments Does Not Promote Cooperation in Social Networks. PLOS ONE 7, e47718.
- [15] Haan, M., Kooreman, P., and Riemersma, T. (2006). Friendship in a Public Good Experiment. In IZA Discussion Paper. vol. 2108
- [16] Harrison, F., Sciberras, J., and James, R. (2011). Strength of Social Tie Predicts Cooperative Investment in a Human Social Network. PLOS ONE 6, e18338.
- [17] Hauert, C., De Monte, S., Hofbauer, J., and Sigmund, K. (2002). Volunteering as Red Queen Mechanism for Cooperation in Public Goods Games. Science 296, 1129–1132.
- [18] Hill, R. A. and Dunbar, R. I. (2003). Social Network Size in Humans. Human Nature 14, 53–72.
- [19] Hossmann, T., Spyropoulos, T., and Legendre, F. (2011). A Complex Network Analysis of Human Mobility. In 2011 IEEE Conference on Computer Communications Workshops (INFOCOM WKSHPS) (IEEE), 876–881.
- [20] Hu, T., Wenning, B.-L., Görg, C., Toseef, U., and Guo, Z. (2012). Statistical Analysis of Contact Patterns between Human-Carried Mobile Devices. In 4th International Conference on Mobile Networks and Management MONAMI 2012 (Berlin, Heidelberg: Springer Berlin Heidelberg), vol. 58 of Lecture Notes of the Institute for Computer Sciences, Social Informatics and Telecommunications Engineering, 244–257.
- [21] Kanngiesser, P., Sueur, C., Riedl, K., Grossmann, J., and Call, J. (2011). Grooming Network Cohesion and the Role of Individuals in a Captive Chimpanzee Group. American journal of primatology 73, 758–67.
- [22] Kobayashi, H. and Hashiya, K. (2011). EnglishThe Gaze that Grooms: Contribution of Social Factors to the Evolution of Primate Eye Morphology. Evolution and Human Behavior 32, 157–165.
- [23] Kobayashi, H. and Kohshima, S. (1997). Unique Morphology of the Human Eye. Nature 387, 767–768
- [24] Levé, M., Sueur, C., Petit, O., Matsuzawa, T., and Hirata, S. (2016). Social Grooming Network in Captive Chimpanzees: Does the Wild or Captive Origin of Group Members Affect Sociality? Journal of Primatology 57, 73–82.
- [25] Miritello, G., Lara, R., Cebrian, M., and Moro, E. (2013). Limited Communication Capacity Unveils Strategies for Human Interaction. Scientific Reports 3, 1950.
- [26] Miritello, G., Moro, E., Lara, R., Martínez-López, R., Belchamber, J., Roberts, S. G., et al. (2013). Time as a Limited Resource: Communication Strategy in Mobile Phone Networks. Social Networks 35, 89–95.
- [27] Nakamura, M. (2003). ‘Gatherings’ of Social Grooming among Wild Chimpanzees: Implications for Evolution of Sociality. Journal of Human Evolution 44, 59–71.
- [28] Newman, M. E. J. (2005). Power Laws, Pareto Distributions and Zipf’s Law. Contemporary Physics 46, 323–351
- [29] Nowak, M. A. (2006). Five Rules for the Evolution of Cooperation. Science 314, 1560–1563.
- [30] Pachur, T., Schooler, L. J., and Stevens, J. R. (2012). When Will We Meet Again? Regularities of Social Connectivity and Their Reflections in Memory and Decision Making. In Simple Heuristics in a Social World (Oxford University Press). 199–224.
- [31] Perc, M., Jordan, J. J., Rand, D. G., Wang, Z., Boccaletti, S., and Szolnoki, A. (2017). Statistical physics of human cooperation. Physics Reports 687, 1–51.
- [32] Perc, M. and Szolnoki, A. (2010). Coevolutionary Ggames–a Mini Review. Bio Systems 99, 109–25.
- [33] Pinheiro, F. L., Pacheco, J. M., and Santos, F. C. (2012). From Local to Global Dilemmas in Social Networks. PLOS ONE 7, e32114.
- [34] Rand, D. G., Arbesman, S., and Christakis, N. (2011). Dynamic Social Networks Promote Cooperation in Experiments with Humans. Proceedings of the National Academy of Sciences 108, 19193–19198.
- [35] Rand, D. G. and Nowak, M. A. (2013). Human Cooperation. Trends in Cognitive Sciences 17, 413–425.
- [36] Roberts, S. G., Dunbar, R. I., Pollet, T. V., and Kuppens, T. (2009). Exploring Variation in Active Network Size: Constraints and Ego Characteristics. Social Networks 31, 138–146.
- [37] Roberts, S. G. B. and Dunbar, R. I. (2011). Communication in Social Networks: Effects of Kinship, Network Size, and Emotional Closeness. Personal Relationships 18, 439–452.
- [38] Santos, F. C., Rodrigues, J. F., and Pacheco, J. M. (2006). Graph Topology Plays a Determinant Role in the Evolution of Cooperation. Proceedings of the Royal Society B: Biological Sciences 273, 51–55.
- [39] Saramaki, J., Leicht, E. A., Lopez, E., Roberts, S. G. B., Reed-Tsochas, F., and Dunbar, R. I. (2014). Persistence of Social Signatures in Human Communication. Proceedings of the National Academy of Sciences 111, 942–947.
- [40] Simon, H. A. (1955). On a Class of Skew Distribution Functions. Biometrika 42, 425–440.
- [41] Smith, J. M. and Szathmáry, E. (2000). The Origins of Life: From the Birth of Life to the Origin of Language (Oxford University Press)
- [42] Song, C., Wang, D., and Barabasi, A.-L. (2013). Connections between Human Dynamics and Network Science
- [43] Takano, M. and Fukuda, I. (2017). Limitations of Time Resources in Human Relationships Determine Social Structures. Palgrave Communications 3, 17014
- [44] Takano, M., Wada, K., and Fukuda, I. (2016). Lightweight Interactions for Reciprocal Cooperation in a Social Network Game. In Proceedings of The 8th International Conference on Social Informatics (SocInfo). 125–137.
- [45] Takano, M., Wada, K., and Fukuda, I. (2016). Reciprocal Altruism-based Cooperation in a Social Network Game. New Generation Computing 34, 257–271
- [46] Tung, J., Barreiro, L. B., Burns, M. B., Grenier, J.-C., Lynch, J., Grieneisen, L. E., et al. (2015). Social Networks Predict Gut Microbiome Composition in Wild Baboons. eLife 4, e1002358.
- [47] Wang, J., Suri, S., and Watts, D. J. (2012). Cooperation and Assortativity with Dynamic Partner Updating. Proceedings of the National Academy of Sciences of the United States of America 109, 14363–8.
- [48] Xu, B. and Wang, J. (2015). The Emergence of Relationship-based Cooperation. Scientific reports 5, 16447.
- [49] Yule, G. U. (1925). A Mathematical Theory of Evolution, Based on the Conclusions of Dr. J. C. Willis, F.R.S. Philosophical Transactions of the Royal Society B: Biological Sciences 213, 21–87.
- [50] Zhou, W.-X., Sornette, D., Hill, R. A., and Dunbar, R. I. (2005). Discrete Hierarchical Organization of Social Group Sizes. Proceedings of the Royal Society B: Biological Sciences 272, 439–444.