A search for FRB 121102-like persistent radio-luminous sources – Candidates and implications for the FRB rate and searches
Abstract
The localization of the repeating fast radio burst (FRB), FRB 121102, suggests that it is associated with a persistent radio-luminous compact source in the FRB host galaxy. Using the FIRST radio catalog, I present a search for luminous persistent sources in nearby galaxies, with radio luminosities of the FRB 121102 persistent source luminosity. The galaxy sample contains about 30% of the total galaxy -band luminosity within Mpc, in a footprint of 10,600 deg2. After rejecting sources likely due to active galactic nuclei activity or background sources, I remain with 11 candidates that are presumably associated with galactic disks or star formation regions. At least some of these candidates are likely to be due to chance alignment. In addition, I find 85 sources within of galactic nuclei. Assuming the radio persistent sources are not related to galactic nuclei and that they follow the galaxy -band light, the 11 sources imply a 95% confidence upper limit on the space density of luminous persistent sources of Mpc-3, and that at any given time only a small fraction of galaxies host a radio luminous persistent source ( ). Assuming persistent sources life time of 100 yr, this implies a birth rate of yr-1 Mpc-3. Given the FRB volumetric rate, and assuming that all FRBs repeat and are associated with persistent radio sources, this sets a lower limit on the rate of FRB events per persistent source of yr-1. I argue that these 11 candidates are good targets for FRB searches and I estimate the FRB event rate from these candidates.
Subject headings:
galaxies: general — galaxies: statistics1. Introduction
Fast radio bursts are dispersed millisecond-duration pulses observed at GHz frequencies (Lorimer et al. 2007; Thornton et al. 2013). Spitler et al. (2016) reported the discovery of a repeating FRB, and follow-up observations using the Very Large Array (VLA) were able to provide an arcsecond localization of the source of the bursts (Chatterjee et al. 2017). The localization is consistent with the position of a star formation region in a faint galaxy ( mag) at a redshift of (Tendulkar et al. 2017; Bassa et al. 2017). Furthermore, Chatterjee et al. (2017) reported the existence of a persistent radio source within of the FRB location, and Marcote et al. (2017) showed that the FRB and the persistent source are separated by less than 12 mas ( pc projected). The radio source has a mean flux density of about mJy, it is variable, presumably due to scintillations, and unresolved with an angular size smaller than about 1.7 mas.
There are many suggestions for the FRB mechanism, including soft gamma-ray repeats (e.g., Popov & Postnov 2010; Kulkarni et al. 2014; Lyubarsky 2014; see however Tendulkar et al. 2016), Galactic stars (e.g., Maoz et al. 2015), pulsars (e.g., Lyutikov et al. 2016; Katz 2017a), magnetars (e.g., Metzger et al. 2017), pulsar wind nebulae (e.g., Dai, Wang & Yu 2017), active galactic nuclei (Katz 2017b), and more. Based on the FRB 121102 persistent source luminosity, spectrum, angular size, and the FRBs constant dispersion measure (DM) over a year time scale, Waxman (2017) inferred the properties of the emitting region. He concluded it is a mildly relativistic, M⊙ shell which propagates into an ambient medium. The energy of this expanding shell is of the order of erg, and its lifetime is of order yr. Waxman (2017) also suggested an efficient mechanism that produces the FRBs within this persistent source via synchrotron maser.
An intriguing property of the FRB 121102 persistent source is that it is radio bright. With an isotropic radiative energy of erg s-1, at GHz, it is over an order of magnitude brighter than the brightest known supernova (SN) remnants (e.g., Lonsdale et al. 2006; Parra et al. 2007; Chomiuk & Wilcots 2009). However, its luminosity is comparable with the brightest young ( yr old) SNe (e.g., Weiler et al. 2002)
Spitler et al. (2016) showed that the FRBs’ arrival times are highly non Poissonic (see also e.g., Wang & Yu 2017). This fact makes it difficult to estimate the actual mean rate of the FRB 121102 events.
Here, I report on a search for persistent radio sources in galaxies in the nearby Universe (). I find 11 candidates, with luminosity greater than 10% of the FRB121102 persistent source. Regardless of the nature of these luminous radio sources, and their relation to FRBs, by estimating the completeness of the survey I was able to place an upper limit on the number density of such bright compact persistent sources in the local Universe. Furthermore, assuming that all the FRBs repeat and associated with persistent radio sources, I set a lower limit on the rate of FRB events per persistent source. I also discuss the volumetric rate of FRBs and the implications for FRB searches.
2. Search for FRB persistent sources
Here I present a search for persistent radio-luminous compact sources in the nearby Universe. In §2.1 I present the nearby galaxy sample, and in §2.2 I describe the cross matching of the galaxy list with the FIRST radio catalog. In §2.3 I estimate chance coincidence probabilities, while in §2.4 I discuss the radio sources’ variability. All the steps and analysis were performed using tools and catalogue available in the MATLAB Astronomy & Astrophysics Toolbox111https://webhome.weizmann.ac.il/home/eofek/matlab/ (Ofek 2014).
2.1. The nearby galaxy sample and its completeness
I compiled a catalog of nearby galaxies within 108 Mpc. The catalog is based on combining the HyperLEDA galaxies222http://leda.univ-lyon1.fr/ (Paturel et al. 2003; Makarov et al. 2014) with the NASA Extragalactic Database (NED333https://ned.ipac.caltech.edu/) redshifts, and the Sloan Digital Sky Survey (SDSS; York et al. 2000) galaxies with known redshifts. Both catalogs are restricted to the FIRST444FIRST catalog version 2017 Dec 14. radio survey footprint (Becker, White, & Helfand 1995). This catalog is far from being complete and I estimate its completeness below. I note that the total area of the FIRST footprint is about 10,600 deg2.
The HyperLEDA catalog lists galaxies brighter than 18 mag, without redshifts. I compiled a catalog of all redshifts available in NED555This catalog, with redshifts, is available as part of the MATALB Astronomy & Astrophysics Toolbox (Ofek 2014), under cats.galaxies.NED_z.. I cross-matched galaxies in the HyperLEDA catalog with the redshift catalog. The association radius was set to . Next, I selected only galaxies with redshifts in the range 0 to 0.025 that are found in the FIRST footprints. Specifically, I demand that the FIRST coverage maps at the galaxy position have rms below 0.26 mJy and above zero. The resulting catalog has 16,152 entries.
I supplemented this catalog with SDSS galaxies in the FIRST footprint666The SDSS catalog contains many HyperLEDA galaxies., with redshifts above 0 and below 0.025 that are not listed in the HyperLEDA catalog ( association). This catalog contains an additional 12,663 galaxies. All the galaxies’ magnitudes were corrected for Galactic extinction (Cardelli et al. 1989; Schlegel et al. 1998).
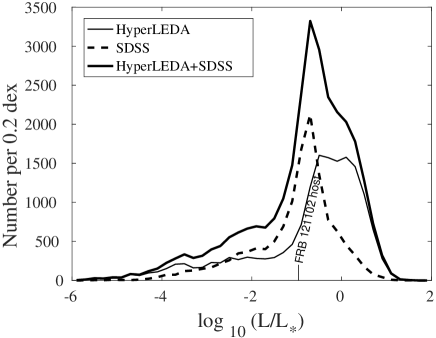
The luminosity functions of the two galaxy catalogue are shown in Figure 1. The luminosity function shows a steep drop for galaxies fainter than about . I note that the FRB 121102 host galaxy luminosity is near the peak of the luminosity function in Figure 1.
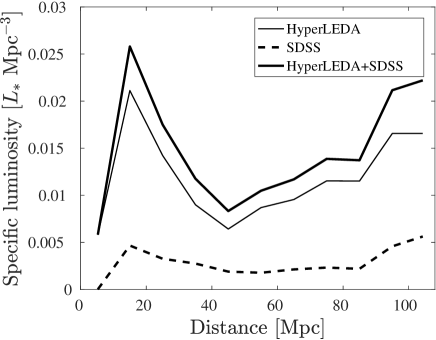
Next, I estimate the completeness of the combined galaxy catalog in terms of total -band luminosity in the nearby Universe. Figure 2 shows the galaxy sample -band luminosity per unit volume as a function of distance.
I also integrated the total -band luminosity in the Karachentsev et al. (2004) catalog of galaxies within 10 Mpc. In order to correct for the galaxy zone of avoidance, I restricted the search again to the FIRST footprints. Since the Karachentsev et al. catalog lists the -band magnitude, while our catalog uses the SDSS -band, I use a mag correction777Assuming a black-body spectrum with an effective temperature of 6000 K.. I find that the -band luminosity density in the Karachentsev et al. (2004) catalog is about 0.055 Mpc-3, where here is the luminosity corresponding to -band absolute magnitude of . This is close to the measured at (; e.g., Montero-Dorta & Prada 2009).
Assuming that the Karachentsev et al. (2004) catalog is nearly complete in terms of the total luminosity and star formation rate888If this assumption was wildly incorrect, then we would expect that blind SN surveys will find many more nearby SN associated with faint dwarf galaxies., and that the galaxy luminosity density within 10 Mpc is representative of the galaxy luminosity density at larger distances, I calculate how much luminosity is missing from of our HyperLEDASDSS catalog per unit volume as a function of distance, and integrate. I find that the total luminosity in our catalog has a completeness of . I note that this factor is uncertain due to the fact that the galaxy distribution is correlated. Given the galaxy correlation function (Tucker et al. 1997; Zehavi et al. 2002) I estimate the completeness to have about 10% uncertainty.
2.2. Search for radio sources associated with nearby galaxies
I cross-matched our galaxy catalogs with FIRST point sources. I defined point sources to have a major axis smaller than 3 times the uncertainty999The size uncertainty is calculated using the formula in: http://sundog.stsci.edu/first/catalogs/readme.html in the radio size measurement. The HyperLEDA-catalog search radius, for each galaxy, was set to the galaxy’s 25 mag arcsec-2 surface brightness semi-major axis listed in the catalog, while for the SDSS sample I used the SDSS Petrosian radius101010http://skyserver.sdss.org/dr7/en/help/docs/algorithm.asp?key=mag_petro.
In the cross-matching step, I selected only sources with intrinsic radio luminosity (assuming at the galaxy redshift) of of the luminosity of the persistent source associated with FRB 121102. For this, I used the FRB 121102 persistent source mean radio flux density of 0.18 mJy and luminosity distance of 938 Mpc (i.e., erg s-1).
The cross-matching yielded 122 possible matches, of which 91 are from the HyperLEDA catalog and 31 are from the SDSS catalog. The candidates are listed in Table 1, and in §2.3 I discuss the chance coincidence probability for these sources.
| R.A. | Dec. | z | Comment | ||||||||
|---|---|---|---|---|---|---|---|---|---|---|---|
| mJy | mJy | arcsec | mJy | mJy | ct/ks | ||||||
| 09:27:58.282 | 02:25:58.95 | 2.1 | 0.14 | 0.14 | 0.023 | 14.32 | Spiral arm + IR source | ||||
| 10:47:26.693 | 06:02:47.72 | 2.9 | 0.14 | 0.13 | 0.019 | 5.87 | 2.4 | 0.4 | -1.1 | Off galaxy center; passive galaxy | |
| 23:53:51.412 | 07:58:35.91 | 4.2 | 0.13 | 0.16 | 0.018 | 42.68 | Near spiral arm; near red+IR source | ||||
| 14:10:43.667 | 08:59:29.96 | 3.2 | 0.15 | 0.21 | 0.023 | 17.66 | 4.0 | 0.4 | 1.8 | Edge of spiral disk; red faint source? | |
| 10:25:26.189 | 17:15:47.97 | 2.8 | 0.13 | 0.11 | 0.018 | 7.08 | Spiral arm | ||||
| 10:58:23.641 | 24:13:55.32 | 2.3 | 0.15 | 0.12 | 0.021 | 29.79 | Spiral arm | ||||
| 13:14:41.932 | 29:59:59.19 | 2.2 | 0.14 | 0.14 | 0.023 | 20.58 | 4.0 | 0.5 | 3.4 | Edge of spiral galaxy; IR source | |
| 16:22:44.571 | 32:12:59.28 | 2.0 | 0.15 | 0.11 | 0.022 | 0.89 | 2.7 | 0.4 | 1.7 | Small blue galaxy; near center | |
| 14:00:38.929 | 02:51:22.79 | 1.5 | 0.15 | 0.11 | 0.025 | 26.41 | 18.8 | Elliptical galaxy halo; no vis/IR source | |||
| 11:45:29.346 | 19:23:27.46 | 3.5 | 0.20 | 0.26 | 0.025 | 33.35 | 2.4 | 0.4 | -2.3 | Edge of galaxy; No optical or IR source | |
| 14:19:18.855 | 39:40:36.03 | 21.1 | 0.15 | 0.95 | 0.020 | 0.50 | 18.5 | 1.0 | -2.2 | Compact blue star forming galaxy | |
| 00:17:27.498 | 09:34:26.56 | 2.5 | 0.15 | 0.15 | 0.023 | 0.51 | Center of galaxy | ||||
| 00:17:59.547 | 09:16:00.89 | 1.6 | 0.15 | 0.10 | 0.023 | 19.06 | 2.9 | 0.5 | 2.5 | Halo of galaxy, likely IR source | |
| 02:52:42.189 | 08:48:15.76 | 3.1 | 0.15 | 0.12 | 0.018 | 0.18 | 4.4 | 0.5 | 2.4 | Center of galaxy | |
| 11:24:03.341 | 07:47:01.13 | 2.1 | 0.14 | 0.16 | 0.025 | 0.50 | 3.7 | 0.6 | 2.5 | Center of galaxy | |
| 01:44:43.099 | 04:07:46.25 | 5.2 | 0.13 | 0.21 | 0.018 | 34.81 | 10.9 | 0.6 | 9.0 | Halo of galaxy, blue source + IR source |
Note. — A list of radio sources that spatially coincide with nearby galaxies. Sources above the horizontal-line separator are the 11 candidates. The full table is available electronically, and here I present only the first several entries. R.A. and Dec. are the J2000.0 right ascension and declination, respectively, of the radio source, is its peak radio flux, is its luminosity in units of the mean luminosity of the FRB 121102 persistence source, is the spatially coincident galaxy redshift, and is the angular separation between the galaxy and radio source. and are the NVSS flux density and its uncertainty, respectively, is the FIRST to NVSS variability in units of the 1- uncertainty (Equation 1), and is the ROSAT counts per kilo-second, from the ROSAT bright and faint source catalogs (Voges et al. 1999; 2000). For the ROSAT catalogue, I used a search radius. Entries with no data indicate non detection.
I inspected the SDSS and WISE (Wright et al. 2010) 4.6 micron-band images of all candidates. The most common candidates are associated with galactic nuclei to within 1 arcsec (85 sources). In these cases I assumed that the radio source is due to active galactic nuclei (AGN) activity in the galaxy center. As most radio sources above a flux density of a few mJy are AGNs, this assumption is probably reasonable. I further note that at a redshift of 0.025 one arcsecond corresponds to about kpc, which is an order of magnitude smaller than the typical size of galaxies. This gives some confidence that even if we remove from our sample persistent sources which are spatially coincidence with their galaxy’s center, the number of non-AGN sources missed is small.
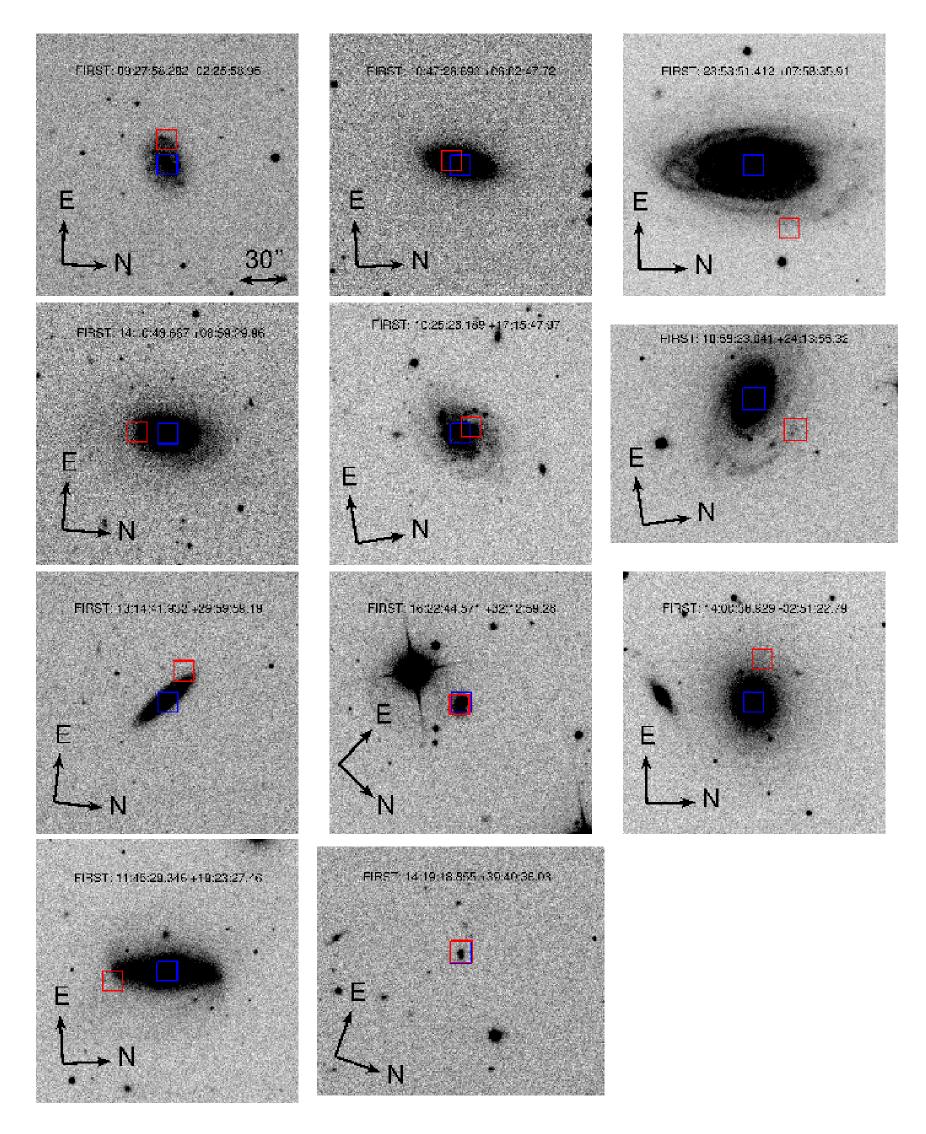
Many other sources seem to be projected on a galaxy, but outside any star formation region or light associated with the galaxy – these sources are sometimes associated with an unresolved source (likely a background quasar). Finally, 11 sources were found to coincide with galactic disks light, or compact star forming galaxies (similar to FRB 121102; Bassa et al. 2017). I regard these 11 sources as the persistent-source candidates, and they are listed at the top part of Table 1. However, if FRBs are related to AGN activity (e.g., Katz 2017; Vieyro et al. 2017), then the number of candidates changes to 85. Figure 3 shows the SDSS images of the 11 candidate galaxies, with markers showing the radio source position and galaxy center.
2.3. Chance coincidence
Given the total sky area of galaxies in our catalogs ( deg2), it is likely that at least some of the candidates are due to chance coincidence of background high-redshift sources with nearby galaxies. Here, I estimate the probability that the sources I find are background sources, unrelated to the spatially associated low-redshift galaxy.
For each galaxy in the catalogs (HyperLEDA and SDSS) I calculate its area on the celestial sphere (given its radius). Furthermore, given the galaxy distance, I calculate the number density of sources on the sky that are compact radio sources with luminosity of the FRB 121102 persistent radio-source luminosity. By multiplying the area of each galaxy by the corresponding surface density of radio sources and summing, I find that the expectancy value for the number of chance-coincidence background sources is 37.7. Excluding the 85 sources found within 1” from galactic nuclei, there are 37 sources spatially associated with nearby galaxies (i.e., ). The exclusion is small compared with the typical galaxy dimension and has a negligible effect on the expectancy value for chance coincidence.
Given that the expectancy is 37.7 and that the observed number is 37, it is likely that at least some of the 11 candidates are due to chance coincidence. Assuming that the selection process (e.g., association with galaxy light in images) selects the best candidates, than the probability that all the 11 candidates are associated with their galaxy (rather than background sources) is 2.9%. The probability that at most 5, 2, 1, 0 of the 11 candidates are associated with their galaxy is 20%, 40%, 43%, and 50%, respectively.
This analysis suggests that some, or even all, of the 11 candidates I found are background sources unrelated to the spatially associated galaxy. If follow-up observations will indicate that all 11 candidates are unrelated to FRBs this will improve the upper limit on the luminous radio source space density (see §3.1) by a factor of about 7.
I note that a reasonable follow-up prioritization of the 11 candidates in Table 1 is by the inverse galaxy size and association with star-forming regions. One reason is that smaller galaxies have lower probability for chance coincidence with background objects. In this respect, the most interesting candidate in the list is J141918394036. This source has the highest luminosity of all candidates and it is associated with a small-area blue galaxy.
2.4. Source variability
I cross-matched the sources in Table 1 with the NVSS catalog (Condon et al. 1998) with a match radius. The NVSS flux and error are listed in Table 1. I further calculated, and list in Table 1,
| (1) |
Here is the NVSS111111The NVSS and FIRST measurements each give a weighted mean flux over several epochs. peak-flux density, is the FIRST peak-flux density, , and are the NVSS and FIRST flux errors, respectively, and is a calibration error assumed to be (Condon et al. 1998). I note that Ofek et al. (2011) measurements of a few calibration sources suggest that the VLA calibration error may be smaller. Furthermore, Ofek & Frail (2011) found that any systematic offset between the FIRST and NVSS fluxes is small compared with the typical flux errors.
The FIRST-NVSS variability search indicates that these sources are roughly constant. However, I cannot rule out small amplitude variability due to scintillation or some long term decrease or increase in flux.
3. Analysis
3.1. Persistent source volumetric density
I found 11 persistent source candidates. This sets a 95% (1-sided) upper limit of 18.2 sources in the searched volume (Gehrels 1986). Assuming the persistent source density is proportional to the -band luminosity, and given the sky area and completeness of the catalog (§2.1), this gives 95% confidence-level upper limit on the number density of luminous persistent sources of:
| (2) |
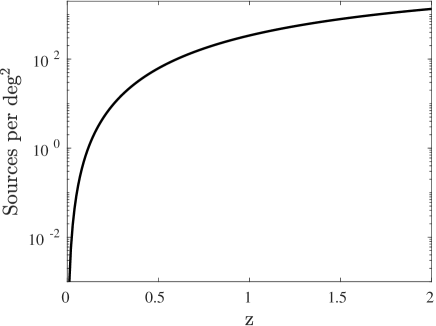
Using the total galaxy luminosity per unit volume I found in §2.1, this is equivalent to a number of persistent sources per galaxy of . However, if FRBs are related to galactic nuclei, then I find 85 candidates and the limit in Equation 2 will change to Mpc-3 ( L). I note that this estimate ignores any possible evolution of persistent sources with redshift. However, the expected increase in the star formation rate between to is only 8% (e.g., Wyder et al. 2005; Schiminovich et al. 2005). Given the density in Equation 2, Figure 4 presents the upper limit on the sky surface density of radio luminous persistent sources, as a function of redshift.
It is not yet clear whether the assumption that FRBs follow the galaxy light is correct. For example, based on the low luminosity of the FRB 121102 host (extinction corrected -band abs. mag. ), Nicholl et al. (2017) claimed that FRBs prefer dwarf galaxies. Using the Karachentsev et al. (2004) catalog, I calculate the fraction of -band luminosity in galaxies fainter than the host galaxy of FRB 121102 (i.e., -band abs. mag. ; assuming mag). I find that of the luminosity is in galaxies fainter than abs. mag. . Since it is expected that there is some incompleteness even in the Karachentsev et al. catalog, the actual fraction can be a little bit higher. Therefore, I cannot rule out the possibility that the FRB 121102 host galaxy luminosity follows the general galaxy luminosity function, at more than 97% confidence.
I note that the luminosity of the FRB 121102 host galaxy is near the peak of the luminosity function of galaxies in my catalog. Therefore, even if the assumption that persistent radio sources follow the -band light is incorrect, then my upper limit on the space density of radio persistent sources is likely still valid to an order of magnitude.
The upper limit on the FRB 121102 persistent source age estimated by Waxman (2017; see also Nicholl et al. 2017) is 300 yr, while the lower limit on its age is yr (Metzger et al. 2017; Waxman 2017). Adopting the persistent source age of yr, our number density implies a birth rate of
| (3) |
This suggests that the origin of FRB persistent sources is some sort of rare phenomenon (e.g., explosions). It is tempting to relate this birth rate to that of known events (e.g., Super Luminous Supernovae [SLSN] or Gamma-Ray Bursts [GRB]; e.g., Nicholl et al. 2017). Howevre, SLSN and GRB can be seen to large distances, and it is very likely that other fainter, yet unknown, transient classes exist. In this context I note that Waxman (2017) found that the total energy of the nebula associated with the FRB 121102 persistent source is of the order of erg. This is low relative to the energetics of known rare events.
3.2. The rate of FRBs
In order to constrain the rate of FRB events per persistent source, we need an estimate of the FRBs rate. There are many FRB rate estimates (e.g., Deneva et al. 2009; Burke-Spolaor et al. 2014; Champion et al. 2016; Lawrence et al. 2016; Vander Wiel et al. 2016). They are typically reported for different parameters (e.g., fluence limit and FRB duration), and therefore a comparison between these rates requires caution.
Furthermore, I note that FRB searches may be slightly biased by several reasons. For example: (1) Usually FRB searches are done up to some limiting dispersion measure (DM). The DM threshold may evolve with time (e.g., whenever a new record in DM is found, the DM threshold is updated). This may result in an incompleteness for bright/far FRB events. (2) FRB searches are performed using non-coherent de-dispersion. This may bias against FRBs with durations shorter than a fraction of a millisecond. I note that in Zackay & Ofek (2016) we suggested a computationally efficient method for calculating the coherent de-dispersion.
In order to avoid some of these complications, I prefer an estimate based on a single instrument. Therefore, for the rate estimate I adopt the Cahmpion et al. (2016) analysis of ten FRBs detected by the Parkes telescope. Cahmpion et al. (2016) report an FRB all-sky rate of day-1 (95% confidence errors) above fluence of 0.13 Jy ms for a minimal 0.128 ms pulse duration.
I note that since the radio telescope beam is not uniform and the observed cumulative flux density function of sources (so called –) is some power-law ( for Euclidean Universe; see however Vedantham et al. 2016), this may affect the effective beam size of the survey (used in the rate calculation). Assuming a cumulative flux density power-law of and assuming a Gaussian beam with a size equal to the beam full-width half maximum, the correction factor is 1 (see appendix C in Ofek et al. 2011). Therefore, here I adopt the Cahmpion et al. (2016) rate.
3.3. The FRB volumetric rate
Assuming that all FRBs repeat, that they are associated with radio persistent sources, their emission is isotropic, and using the FRB rate (§3.2), I use the upper limit on the persistent source number density (Eq. 2) to put a lower limit on the rate of FRB events per persistent source.
The first step is to estimate the volumetric rate of FRBs. To estimate the effective volume of the Parkes search, I use all the 16 FRBs found by the Parkes radio telescope121212Adopted from the FRB catalog: http://www.astronomy.swin.edu.au/pulsar/frbcat/. For each FRB DM I removed the estimated Milky Way DM, and I attributed a fraction131313Attributing a fraction of the DM to intergalactic dispersion is an approximation – in practice the host galaxy DM is coming from some unknown probability distribution of host-galaxy DM. of the remaining DM to intergalactic dispersion. The analysis is performed for in the range of to . I converted the remaining intergalactic DM to redshift via the formulae in Zheng et al. (2014) assuming Planck cosmological parameters (Ade et al. 2015). Each redshift was transformed to a cosmological volume. Given a flux limited survey, Euclidian universe, and no cosmological evolution, the expectation value of the survey volume is two times the average of the volumes enclosed by the sources (e.g., similar to the argument of the test; e.g., Schmidt 1968). Given the Universe geometry and cosmological evolution in the star formation rate, the ratio between the effective survey volume and the mean volume (corresponding to the redshift) of sources is somewhat smaller than 2 (i.e., star formation increases with redshift). In the calculation I assume the FRB rate follows the star formation rate and take into account the star-formation evolution from the compilation based on141414https://ned.ipac.caltech.edu/level5/March14/Madau/Madau5.html Wyder et al. (2005), Schiminovich et al. (2005), Robotham & Driver (2011), and Cucciati et al. (2012). In any case, the effect of evolution is considerably smaller than the uncertainty in the rate estimate. This allows us to calculate the FRB volumetric rate as a function of . Figure 5 shows the FRB rate as a function of .
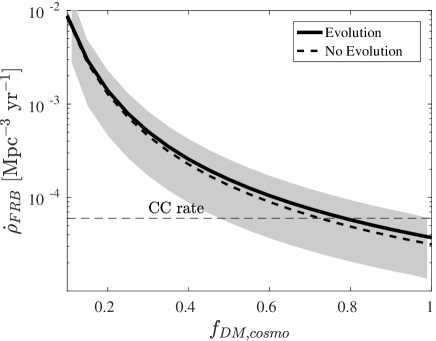
Regardless of , and assuming cosmological evolution in the FRB rate that follows the star formation rate, I find an FRB volumetric rate of
| (4) |
This estimate takes into account the effect of cosmological time dilation by multiplying the observed rate by , where is the volume-weighted mean redshift of the FRBs. I note that this estimate depends on the unknown luminosity function of FRBs and should be regarded as an order of magnitude estimate. Furthermore, if the FRB emission is beamed then the rate at Equation 4 is, again, only a lower limit.
3.4. FRB rate per persistent source
Assuming there is a steady state of FRB persistent source density that follows the star foramtion rate, and assuming that all FRBs are associated with persistent sources, I divide the lower limit on the FRB rate per unit volume (Eq. 4) by the upper limit on the persistent sources space density to derive a lower limit on the rate of FRBs per persistent source. Figure 6 presents the 95% confidence lower limit on rate of FRB events per persistent source as a function of .
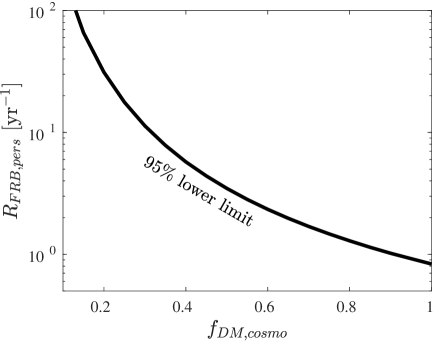
For I find an FRB rate per persistent source of yr-1. This lower limit on the rate corresponds to FRB events for which the intrinsic luminosity is as high as the FRBs seen by Parkes.
3.5. Predictions and implications for observing strategy
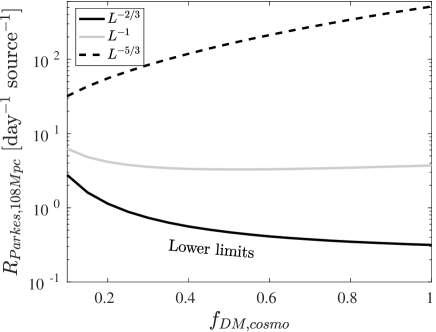
An interesting implication is that if all FRBs repeat and are associated with luminous radio sources, then searches for FRBs in nearby galaxies (e.g., M31) using small radio dishes are likely to fail as on average only one in galaxies hosts a luminous radio source. An observing strategy that is favored by my findings is to monitor for FRBs among the 11 candidates listed in Table 1. Figure 7 shows the predicted mean number of FRB events per persistent source per day that may be detected using a Parkes-like telescope if directed to an FRB-emitter source (i.e., presumably a persistent radio source) at a distance of 108 Mpc. This plot is shown for an FRB cumulative luminosity function , , and . The FRB rate per such source is estimated by
| (5) |
Here is the lower limit on the FRB rate per persistent source (§3.4; Fig. 6), is the mean distance of the Parkes detected FRBs (§3.3; i.e., for ), and is the assumed power-law index of the FRB cumulative luminosity function. I note that if FRBs emission is beamed in a constant direction then Figure 7 is correct on average for a population. However, in this case, some persistent radio sources will show no FRB emission. Furthermore, it is important to note that since the FRB 121102 events are not generated by a Poisson process, large deviations from the average expected rate are possible.
4. The nature of the luminous radio sources in nearby galaxies
An intriguing question is what is the origin of the luminous radio sources reported here? It is likely that at least some of of these sources are background objects unrelated to a nearby galaxy. Better estimate of the fraction of background objects requires follow-up observations. However, assuming that at least some of these sources are related to their spatially coincident galaxy, there are still several physical explanations.
First, it is possible that these sources are similar in nature to the radio persistent source associated with FRB 121102. This possibility can be further tested using follow-up radio spectral, temporal and interferometric observations.
Second, I would like to consider the possibility that some of these sources are just the bright end of the supernova (SN) remnants (SNR) luminosity function, or young SN with considerable circumstellar material that convert their kinetic energy to radiation on short time scales ( yr). This hypothesis can be tested by long-term monitoring of the radio sources, and a search for flux variability. I note that the brightest known radio SNe (e.g., Weiler et al. 2002) are as bright as the FRB 121102 persistent radio source. However, these SNe are variable on time scales of about one year, which is not consistent with the non-detection of variability between the NVSS (when available) and FIRST epochs which are typically several years apart.
Another possibility is gamma ray bursts (GRBs). In GRBs the ejecta velocity is much higher and therefore can produce luminous events (e.g., Levinson et al. 2002). In fact, in the past, the non-detection of transient radio sources was used to set an upper limit on the GRB space density, which can be translated to a lower limit on the GRBs beaming factor (Levinson et al. 2002; Gal-Yam et al. 2006).
Levinson et al. (2002) estimated the number of GRB radio afterglows in a flux-limited survey. However, our survey is both volume limited and luminosity limited. Therefore an upper limit on the number of expected GRB afterglows in our survey is given by their rate in a volume limited survey
| (6) |
Here is the GRB beaming factor (e.g., Gueta, Piran & Waxman 2005), and is their rate per unit volume. Assuming GRB afterglows can be observed for 100 yr (afterwards their luminosity is equivalent to that of SN remnants), and given the survey completeness, I conclude that there are GRB afterglows in my sample.
In any case, there are two differences between GRB afterglows and the FRB persistent sources: The first is that while the FRB persistent sources are presumably expanding only mildly relativistically (Waxman 2017), GRB afterglows are expected to expand relativistically. This may result in some differences in the angular size of FRB persistent sources vs. GRB radio afterglows and the scintillation induced variability (e.g., different frequency-dependent variability). Furthermore, there may be some differences in the radio spectrum. I suggest that radio follow-up observations are required in order to reveal the nature of the luminous radio sources reported in this paper.
5. Summary
To summarize, I present a survey aimed at searching for luminous compact radio sources in galaxies with .
-
1.
I find 11 sources with radio luminosity, at GHz, of erg s-1 (i.e., of the FRB 121102 persistent source luminosity) which are spatially associated with disks or star-forming regions of galaxies. Here I exclude sources that are spatially coincidence with galactic centers.
-
2.
Given the completeness estimate for the galaxy catalog, and the FIRST survey area, I place an upper limit on the density of luminous persistent sources in the nearby Universe ( Mpc-3). This upper limit assumes that luminous persistent sources follow the -band luminosity of galaxies. If FRBs are related to galactic nuclei this limit will be changed to Mpc-3.
-
3.
Such luminous radio sources are rare – about per galaxy.
-
4.
Assuming a persistent source life time of yr, their birth rate is yr-1 Mpc-3.
-
5.
Assuming all FRBs repeat and are associated with persistent radio sources, I set a lower limit on the FRB rate per persistent source of yr-1.
-
6.
About of the galaxy-population integrated luminosity is in galaxies fainter than the absolute mag. of the FRB 121102 host (). This suggests that it is too early to conclude that FRBs prefer dwarf galaxies.
-
7.
If some of the candidates in Table 1 are associated with FRBs then a few-days observation with sensitive (i.e., Parkes-like) radio telescopes may reveal FRB events from these sources. The detection of FRBs from such nearby galaxies may allow us to resolve the persistent source, and to probe the FRB luminosity function at lower luminosities than in the case of FRB 121102.
References
- Planck Collaboration et al. (2015) Planck Collaboration, Ade, P. A. R., Aghanim, N., et al. 2015, A&A, 580, A22
- Bassa et al. (2017) Bassa, C. G., Tendulkar, S. P., Adams, E. A. K., et al. 2017, arXiv:1705.07698
- Becker et al. (1995) Becker, R. H., White, R. L., & Helfand, D. J. 1995, ApJ, 450, 559
- Cardelli et al. (1989) Cardelli, J. A., Clayton, G. C., & Mathis, J. S. 1989, ApJ, 345, 245
- Champion et al. (2016) Champion, D. J., Petroff, E., Kramer, M., et al. 2016, MNRAS, 460, L30
- Chatterjee et al. (2017) Chatterjee, S., Law, C. J., Wharton, R. S., et al. 2017, Nature, 541, 58
- Chomiuk & Wilcots (2009) Chomiuk, L., & Wilcots, E. M. 2009, ApJ, 703, 370
- Cucciati et al. (2012) Cucciati, O., Tresse, L., Ilbert, O., et al. 2012, A&A, 539, A31
- Dai et al. (2017) Dai, Z. G., Wang, J. S., & Yu, Y. W. 2017, ApJ, 838, L7
- Gehrels (1986) Gehrels, N. 1986, ApJ, 303, 336
- Guetta et al. (2005) Guetta, D., Piran, T., & Waxman, E. 2005, ApJ, 619, 412
- Karachentsev et al. (2004) Karachentsev, I. D., Karachentseva, V. E., Huchtmeier, W. K., & Makarov, D. I. 2004, AJ, 127, 2031
- Katz (2017a) Katz, J. I. 2017a, arXiv:1704.08301
- Katz (2017b) Katz, J. I. 2017b, arXiv:1702.02161
- Kulkarni et al. (2014) Kulkarni, S. R., Ofek, E. O., Neill, J. D., Zheng, Z., & Juric, M. 2014, ApJ, 797, 70
- Lawrence et al. (2016) Lawrence, E., Vander Wiel, S., Law, C. J., Burke Spolaor, S., & Bower, G. C. 2016, arXiv:1611.00458
- Levinson et al. (2002) Levinson, A., Ofek, E. O., Waxman, E., & Gal-Yam, A. 2002, ApJ, 576, 923
- Li et al. (2011) Li, W., Chornock, R., Leaman, J., et al. 2011, MNRAS, 412, 1473
- Lonsdale et al. (2006) Lonsdale, C. J., Diamond, P. J., Thrall, H., Smith, H. E., & Lonsdale, C. J. 2006, ApJ, 647, 185
- Lorimer et al. (2007) Lorimer, D. R., Bailes, M., McLaughlin, M. A., Narkevic, D. J., & Crawford, F. 2007, Science, 318, 777
- Lyubarsky (2014) Lyubarsky, Y. 2014, MNRAS, 442, L9
- Lyutikov et al. (2016) Lyutikov, M., Burzawa, L., & Popov, S. B. 2016, MNRAS, 462, 941
- Maoz et al. (2015) Maoz, D., Loeb, A., Shvartzvald, Y., et al. 2015, MNRAS, 454, 2183
- Makarov et al. (2014) Makarov D., Prugniel P., Terekhova N., Courtois H., & Vauglin I. 2014, A&A, 570, A13
- Marcote et al. (2017) Marcote, B., Paragi, Z., Hessels, J. W. T., et al. 2017, ApJ, 834, L8
- Metzger et al. (2017) Metzger, B. D., Berger, E., & Margalit, B. 2017, arXiv:1701.02370
- Montero-Dorta & Prada (2009) Montero-Dorta, A. D., & Prada, F. 2009, MNRAS, 399, 1106
- Nicholl et al. (2017) Nicholl, M., Williams, P. K. G., Berger, E., et al. 2017, arXiv:1704.00022
- Ofek & Frail (2011) Ofek, E. O., & Frail, D. A. 2011, ApJ, 737, 45
- Ofek et al. (2011) Ofek, E. O., Frail, D. A., Breslauer, B., et al. 2011, ApJ, 740, 65
- Ofek (2014) Ofek, E. O. 2014, Astrophysics Source Code Library, ascl:1407.005
- Parra et al. (2007) Parra, R., Conway, J. E., Diamond, P. J., et al. 2007, ApJ, 659, 314
- Popov & Postnov (2010) Popov, S. B., & Postnov, K. A. 2010, Evolution of Cosmic Objects through their Physical Activity, 129
- Robotham & Driver (2011) Robotham, A. S. G., & Driver, S. P. 2011, MNRAS, 413, 2570
- Schiminovich et al. (2005) Schiminovich, D., Ilbert, O., Arnouts, S., et al. 2005, ApJ, 619, L47
- Schlegel et al. (1998) Schlegel, D. J., Finkbeiner, D. P., & Davis, M. 1998, ApJ, 500, 525
- Schmidt (1968) Schmidt, M. 1968, ApJ, 151, 393
- Spitler et al. (2016) Spitler, L. G., Scholz, P., Hessels, J. W. T., et al. 2016, Nature, 531, 202
- Tendulkar et al. (2016) Tendulkar, S. P., Kaspi, V. M., & Patel, C. 2016, ApJ, 827, 59
- Tendulkar et al. (2017) Tendulkar, S. P., Bassa, C. G., Cordes, J. M., et al. 2017, ApJ, 834, L7
- Thornton et al. (2013) Thornton, D., Stappers, B., Bailes, M., et al. 2013, Science, 341, 53
- Vedantham et al. (2016) Vedantham, H. K., Ravi, V., Hallinan, G., & Shannon, R. M. 2016, ApJ, 830, 75
- Vieyro et al. (2017) Vieyro, F. L., Romero, G. E., Bosch-Ramon, V., Marcote, B., & del Valle, M. V. 2017, arXiv:1704.08097
- Voges et al. (1999) Voges, W., Aschenbach, B., Boller, T., et al. 1999, A&A, 349, 389
- Voges et al. (2000) Voges, W., Aschenbach, B., Boller, T., et al. 2000, IAU Circ., 7432, 1
- Wang & Yu (2017) Wang, F. Y., & Yu, H. 2017, JCap, 3, 023
- Waxman (2017) Waxman, E. 2017, arXiv:1703.06723
- Weiler et al. (2002) Weiler, K. W., Panagia, N., Montes, M. J., & Sramek, R. A. 2002, ARA&A, 40, 387
- Wright et al. (2010) Wright, E. L., Eisenhardt, P. R. M., Mainzer, A. K., et al. 2010, AJ, 140, 1868-1881
- Wyder et al. (2005) Wyder, T. K., Treyer, M. A., Milliard, B., et al. 2005, ApJ, 619, L15
- York et al. (2000) York, D. G., Adelman, J., Anderson, J. E., Jr., et al. 2000, AJ, 120, 1579
- Zehavi et al. (2002) Zehavi, I., Blanton, M. R., Frieman, J. A., et al. 2002, ApJ, 571, 172
- Zheng et al. (2014) Zheng, Z., Ofek, E. O., Kulkarni, S. R., Neill, J. D., & Juric, M. 2014, ApJ, 797, 71